Finding the Best Feature Detector-Descriptor Combination Anders Lindbjerg Dahl, Henrik Aanæs DTU Informatics Technical University of Denmark Lyngby, Denmark
[email protected],
[email protected]
Abstract—Addressing the image correspondence problem by feature matching is a central part of computer vision and 3D inference from images. Consequently, there is a substantial amount of work on evaluating feature detection and feature description methodology. However, the performance of the feature matching is an interplay of both detector and descriptor methodology. Our main contribution is to evaluate the performance of some of the most popular descriptor and detector combinations on the DTU Robot dataset, which is a very large dataset with massive amounts of systematic data aimed at two view matching. The size of the dataset implies that we can also reasonably make deductions about the statistical significance of our results. We conclude, that the MSER and Difference of Gaussian (DoG) detectors with a SIFT or DAISY descriptor are the top performers. This performance is, however, not statistically significantly better than some other methods. As a byproduct of this investigation, we have also tested various DAISY type descriptors, and found that the difference among their performance is statistically insignificant using this dataset. Furthermore, we have not been able to produce results collaborating that using affine invariant feature detectors carries a statistical significant advantage on general scene types. Keywords-Interest point detector, Interest point descriptor, Feature evaluation, Combined descriptor detector evaluation
I. I NTRODUCTION The computational efficiency of a sparse image representation consisting of salient interest points, also referred to as features, is a major motivation for feature based methods for solving the image correspondence problem. Various detectors and descriptors have been proposed, but the question of how to optimally design an interest point characterization still remains open. The success of feature-based methods depends on the quality of the local characterization. In general it is not an easy task to judge the performance of such methods, because it is hard to validate if correspondence exist. However given knowledge about the geometry of the observed scene, it becomes easy to verify if two interest points corresponding in feature space also corresponds in the real scene. We therefore propose to use the DTU Robot dataset with known surface geometry presented in [1], [2] (see Sec. II for a brief description and Fig. 1). Based on this dataset we are able to systematically analyze the design of feature methods and due to the large variation in scene types
Kim Steenstrup Pedersen Department of Computer Science, DIKU University of Copenhagen Copenhagen, Denmark
[email protected]
(a)
(b)
(c)
(d)
Figure 1. Example of data and setup. Two images of the same scene with one close up (a) and one distant from the side (b), and the reconstructed 3D points (c). Corresponding interest points can be found using the geometric information of the scene with known camera positions and 3D scene surface as schematically illustrated in (d). Illustration from [1].
we can judge the statistical significance of our findings. Finding correspondence between image pairs using interest points is based on the assumption that common interest points will be detected in both images. For this to be useful, corresponding interest points have to be localized precisely on the same scene element, and the associated region around each interest point should cover the same part of the scene. Commonly, candidate points are detected using an interest point detector and a description of the local image structure – the so-called descriptors – surrounding the interest points are extracted. Following the extraction of descriptors, a comparison of these is made using a relevant similarity metric in order to determine correspondence between interest points. The rationale is that descriptors capture the essential visual appearance of the scene region covered by the interest point, and as a consequence the same scene point seen from different viewpoints and/or with different lighting should have similar descriptors. Therefore descriptors should preferably be invariant, or approximately, with respect to changes in viewpoint and lighting. Early work on correspondence from local image features was based on rotation and scale invariant features [3], [4],
and interest points from planer scenes was evaluated in [5]. Later the interest points have been adapted to affine transformation, to obtain robust characterization to larger viewpoint changes. These methods have been surveyed in [6], but the performance has been evaluated on quite limited datasets consisting of ten scenes each containing six images. The suggested evaluation criteria have since been used in numerous works together with this small dataset. Different approaches have been taken when describing the local visual appearance of interest points. A majority of approaches extract some descriptive feature, such as histograms of differential geometric image properties in each pixel [3], [7], [4], [8], using integral images [9], [10], or the responses of steerable filters [11], differential invariants or local jets [12], [13], [14], [5]. The SIFT [3], GLOH [7], and DAISY [8], [15], [16], [17] descriptors also includes a spatial pooling step in order to agglomerate the descriptive feature in an arrangement around the interest point. A selection of descriptors have previously been evaluated in [7] on the same dataset as used in [6]. Again the limitations of the dataset restricts the ability to generalize the results from this survey to a wider class of scene types and more natural variation in illumination. The ground truth in the data from [6] was obtained by an image homography. This limits the scene geometry to planar surfaces or scenes viewed from a large distance where a homography is a good approximation. Fraundorfer and Bishof [18] addressed this limitation by generating ground truth and requiring that a matched feature should be consistent with the camera geometry across three views. In Winder et al. [17], [19], [16], [20] results from Photo Tourism [21] were used as ground truth. Moreels and Perona [22] evaluated feature descriptors similar to [18] based on pure geometry by requiring three view geometric consistency with the epipolar geometry. In addition they used a depth constraint based on knowledge about the position of their experimental setup. Hereby they obtained unique correspondence between 500-1000 detected points from each object. The limitation of their experiment is the use of relatively simple scenes with mostly single objects resulting in little self-occlusion. However, self-occlusions are very frequent in real world scenes and many interest points are typically found near occluding boundaries, limiting the applicability of their conclusions. The aim of this work is to compare pairs of feature detectors and descriptors, to find the best combination. To keep the computational burden manageable the number of candidates have to be limited, and we thus only use candidates which have previously been reported to perform well. As for the detectors we choose Harris, Harris Affine, Harris Laplace, Hessian Laplace, Hessian Affine, MSER, and Difference of Gaussian (DoG), because they are popular and reported to work well in the literature [1], [23]. As for the feature descriptors, the state of the art is
3 Arc
Linear Path
2 Arc
c1 Ar
me Fra y e
K
Scene
Figure 2. The central frame in the nearest arc is the key frame, and the surface reconstruction is attempted to cover most of this frame. The three arcs are located on circular paths with radii of 0.5 m, 0.65 m and 0.8 m, which also defines the range of the linear path. Furthermore, Arc1 spans +/ − 40◦ , Arc2 +/ − 25◦ and Arc3 +/ − 20◦ . Illustration from [1].
currently the SIFT [3] and DAISY descriptors [8], [15], [16], [17] which we choose to use and implement using the framework of Winder and Brown [17]. We also include conventional (normalized) cross correlation as a baseline, since much work has been done using this descriptor. The DAISY descriptors however cover a wide range of descriptors; as such we choose to divide our analysis into two, where we first identify the best DAISY descriptors on a subset of the detectors. This is the subject of Sec. III, where 21 different variants of the DAISY descriptor are evaluated. Each combination is evaluated using ROC-curves (Receiver Operating Characteristics). Two representative descriptors are carried on to the last part of the analysis, reported in Sec. IV, where a matrix of the seven detectors and four descriptors are evaluated. A discussion of our results and recommendations is found in Sec. V. II. DATA AND E VALUATION In this investigation we use the DTU Robot dataset [1], [2]1 illustrated in Fig. 1. This dataset is constructed under controlled settings using an industrial robot. The set consists of 60 complex scenes, and Fig. 2 shows how each scene is viewed from 119 positions with known camera geometry. The dataset also incorporates light variation, but in this work we only focus on diffuse lighting. In addition the 60 scenes have been surface scanned using structured light. Together with the camera geometry this allows us to accurately determine the correct camera correspondences 1 http://roboimagedata.imm.dtu.dk/
2.5 pix
(a) app. 2 x 3 mm
2 x 5 pix
(b) Figure 3. Matching criteria for interest points. This figure gives a schematic illustration of a scene of a house and two images of the scene from two viewpoints. (a) The consistency with epipolar geometry, where corresponding descriptors should be within 2.5 pixels from the epipolar line. (b) Window of interest with a radius of 5 pixels and corresponding descriptors should be within this window, which is approximately 3 mm on the scene surface. Ground truth is obtained from the surface geometry. Illustration from [1].
without matching visual features. In real outdoor scenes, as presented in [16], there is no alternative to have ground truth based on feature matching, but this could likely bias the result. A. Evaluation criteria The evaluation framework used is similar to the one reported in [1], which only includes an evaluation of the matching performance of different detector methods on the DTU Robot dataset. We want to determine if a pair of corresponding features are correct or not, where correspondence is found by the Euclidean distance between feature descriptors. Fig. 2 illustrates how the features are matched between one key frame and all other images. Fig. 3 shows the two criteria that we use for determining correct correspondence. Correct matches have to be within 2.5 pixels of the epipolar line and the corresponding 3D point must be within a 5 pixel error margin corresponding to approximately 3 mm. Given an image pair, where one image is the key frame, a detector-descriptor pair is evaluated by 1) For each feature in the key frame find the distance to the best δb and the second best δs matching feature in the other image. 2) For each feature correspondence compute the ratio, r = δδsb , between the match score of the second best and the best correspondence. It is also determined if the best match is correct or not. 3) Using this ratio, r, as a predictor for correct matches, c.f. [3], the ROC (Receiver Operating Characteristic) curve, as a function of r, is constructed based on all features in an image pair. We compare the area under
the ROC curve (AUC). The area is between zero and one, where one indicates perfect performance of the detector-descriptor pair. 4) The AUC is used as the performance measure of a detector-descriptor combination on a pair of images. These AUCs are the basis for our statistical analysis. The AUC is chosen as a performance measure, in line with [16], because it elegantly removes the need to balance between many false positive or many false negatives. As a result it strongly relates to the underlying discriminative power of the method. We compare different detector-descriptor methods by computing the mean performance, i.e. the mean AUC over the 60 sets for each position, c.f. Fig. 6, 7 and Tab. II. Based on the central limit theorem, we assume these means to be normal distributed. We compare the means using students t-test µ1 − µ2 , σ ˆ
(1)
where µ1 and µ2 are the two means to be compared and σ ˆ is an estimate of the standard deviation. When computing an estimate of the variances, σ ˆ 2 , we perform an analysis of variance, assuming that for a given method and a given problem, performance is given by two factors Performance = Problem Difficulty + Method + Noise . Since we are interested in comparing the methods the variance due to the Problem Difficulty is factored out, which reduces the overall variance, σ ˆ 2 , making it easier for a difference in means to be significant. B. Implementation All feature detectors are computed by implementations provided by the authors of [3], [24], [25]2 , whereas we implemented our own interest point descriptors. They are estimated on an affine warped image patch sampled according to the parameters obtained from the interest point detection and rotated to one dominant gradient direction. The image patch is sampled with a radius of three times the scale of the feature point and we discard points that exceed the image borders. We found this to be a good tradeoff between performance and number of discarded sample points. In the experiments described in Sec. III we use a patch size of 66 × 66 pixels whereas the patches in the experiments in Sec. IV are 30 × 30. This is especially a consequence of the pixel similarity estimates where we have feature vectors of 900 dimensions. Using the 66 × 66 pixel patches this would be 4356 dimensions, which approximately slows the calculation down with a factor four. We only observed a minor loss in precision, which is shown in Tab. I “spatial layout – 1-8-8” 2 http://www.robots.ox.ac.uk/∼vgg/research/affine/
Comparison Descriptor type
Spatial layout
Descriptor dimensionality Scene types
Affine vs. Laplace
Type Type 1 Type 2 Type 3 1-6 1-8-8 1-4-8-12 1-6 lf 1-6 sf 1-6 lg 1-6 sg Small Large Houses Books Fabric Greens Beer cans Laplacian Affine
Performance 0.781 0.785 0.791 0.786 0.804 0.802 0.784 0.778 0.784 0.763 0.783 0.788 0.751 0.791 0.831 0.799 0.696 0.783 0.788
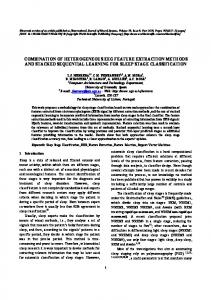
Table I M EAN AUC FOR DIFFERENT GROUPINGS OF THE DESCRIPTOR TYPES . T HE TABLE SHOWS MEAN VALUE OF ALL POSITIONS . I N F IG . 4 THE SPATIAL LAYOUT IS SHOWN . Figure 4. Layout of the descriptors for spatial summation. The circles mark the size of the sample points and the dark color shows the Gaussian weighing. First row one ring with six samples – (1-6) (a), two rings with eight samples in each – (1-8-8) (b), three rings with four, eight and twelve samples – (1-4-8-12) (c). Second row one ring with six samples – large footprint – (1-6 lf) (d), small footprint – (1-6 sf) (e). One ring with six samples – large sample area – (1-6 lg) (f), small sample area – (1-6 sg) (g).
should be compared to “HesAff” and “HarAff” – “DAISYI” and “DAISY-II” in Tab. II. It shows a performance loss of 0.013 caused by reduction in patch size. Our implementation of the DAISY descriptor closely follows the description of Winder et al. [16]3 . To ensure that the only difference between the DAISY and SIFT descriptors were the sampling, we chose to implement our own SIFT descriptor. To validate the performance we did a small experiment to compare to the original implementation of Lowe [3]4 , and we obtained similar performance with patches of 66 × 66 pixels and about 5% fewer matching descriptors with the 30 × 30 patches. III. C OMPARING DAISY DESCRIPTORS Brown et al.[20] presents a framework for optimizing feature descriptors. They have chosen the DAISY-type descriptor presented in Winder and Brown [17], because it is easily reconfigurable. The optimization is based on three outdoor scenes where ground truth is obtained from the bundler software [21], which is based on the SIFT framework [3]. In this experiment we have performed a similar investigation to Brown et al., but based on the extended DTU Robot dataset, where ground truth geometry is based on precise calibration and structured light scanning. In order to 3 http://cvlab.epfl.ch/∼brown/patchdata/patchdata.html 4 http://www.cs.ubc.ca/∼lowe/keypoints/
keep the computational burden manageable, we only did this experiment on the Harris affine and Harris Laplace features. The descriptors proposed by Brown et al.[20] are varied in the spatial layout and differential-geometric response. The spatial layout that we have tested are illustrated in Fig. 4. We have varied the number of sample points, the size of sample points and their relative distance. We employ three differential-geometric responses – the directional binned gradients in four and eight directions (Type 1), average positive and negative gradients (Type 2) and steerable filters (Type 3). The experimental result is summarized in Tab. I. This approach closely follows Winder et al.[16]. The results show that the effect of changing the differential-geometric response is limited, so it is clearly an advantage to select either Type 1 or 2, because the computational cost of these descriptors is much lower. There is a small advantage in selecting a spatial layout where two rings are sampled, but three ring sampling does not give an improvement. Fig. 5 shows that this advantage is seen for all positions. The dimensionality difference arise from number of sample directions in Type 1, combinations of positive and negative gradients in Type 2, and number of directions of the steerable filters in Type 3. But there is almost no difference in selecting the large dimensionality over the small. There is a clear difference in Scene type, where the AUC is significantly higher for less specular objects like fabric than for specular objects like beer cans. The difference between affine and non-affine feature detectors is surprisingly small, which might be a result of complexity of the evaluated scenes with many occluding boundaries. The findings regarding affine detectors are confirmed by the experiments presented in Sec. IV.
a)
b)
c)
0.9
0.9
0.9
0.85
0.85
0.85
0.8
0.8
0.8
0.75
0.75
0.75
0.7
0.7
0.7
0.65 −40
−30
−20
−10
0
10
20
30
0.65 0.5
40
0.9
0.55
1−6 (ld) 1−6 (hd) 1−8−8 (ld) 1−8−8 (hd) 1−4−8−12 (ld) 1−4−8−12 (hd) 1−6 (ld, lf) 1−6 (hd, lf) 1−6 (ld, sf) 1−6 (hd, sf) 1−6 (ld, lg) 1−6 (hd, lg) 1−6 (ld, sg) 1−6 (hd, sg)
0.85
0.8
0.75
0.7
0.65 −20
−10
0
10
0.6
0.7
0.75
0.8
0.65 −25
−20
0.5
0.5
0.4
0.4
0.3
0.3
0.2
0.2
0.1
0.1
0 −0.05
20
0.65
d)
0
e)
−15
0 0.05 −0.05
−10
−5
0
5
10
15
20
25
1−6 (ld, lg) 1−6 (ld, sg) 1−8−8 (hd)
0
0.05
f)
Figure 5. Performance evaluation of the DAISY descriptor. Average AUCs for Type 2 descriptors are shown in (a - d). The vertical axis in the graphs show the AUC, and the horizontal is the angle (a,c,d) and distance (b) relative to the key-frame. Each graph corresponds to the sample path shown in Fig. 2, with Arc 1 (a), Linear Path (b), Arc 2 (c) and Arc 3 (d). The labels relate to the descriptor design shown in Fig. 4. In (e - f) probability density functions for different descriptor designs are shown for a 30◦ angle where (e) is affine interest points and (f) is non-affine. This shows that with a sparse sampling the performance goes down for the non-affine, but the affine invariance can be compensated by a dense sampling.
Har HarAff HarLap HesAff HesLap MSER DOG Avg.
Corr 0.615 0.629 0.635 0.636 0.630 0.648 0.646 0.634
SIFT 0.767 0.818 0.814 0.795 0.757 0.846 0.849 0.807
DAISY-I 0.729 0.791 0.784 0.773 0.740 0.826 0.837 0.783
DAISY-II 0.741 0.798 0.790 0.779 0.742 0.832 0.843 0.789
Avg. 0.713 0.759 0.756 0.746 0.717 0.788 0.794 0.753
Table II M EAN AUC OVER ALL POSITIONS FOR THE FEATURE DETECTOR AND DESCRIPTOR COMBINATIONS . T OP 3 PERFORMERS HIGHLIGHTED WITH BOLD - FACE (H AR IS H ARRIS CORNERS , H AR A FF IS H ARRIS AFFINE , H AR L AP IS H ARRIS L APLACE , H ES A FF IS H ESSIAN AFFINE AND H ES L AP IS H ESSIAN L APLACE FEATURE DETECTORS RESPECTIVELY ).
From this study, we choose the two-ring DAISY descriptor with small (DAISY-I) and large dimensionality (DAISY-II) for further analysis. This is done together with SIFT and a vector of simple pixel intensities (normalized cross correlation). These four descriptors are analyzed in combination with seven feature detectors.
IV. C OMPARING D ETECTOR -D ESCRIPTOR C OMBINATIONS In this section we present the evaluation of detectordescriptor combinations with the aim of finding the best performers. We compare a combination of the four feature descriptors (SIFT, DAISY-I, DAISY-II and cross correlation) with seven feature detectors. These detectors are Harris corner detector [26], Harris Laplace, Harris affine, Hessian Laplace, Hessian affine [6], MSER [24], and Difference of Gaussians (DoG) [3]. The combined result is summarized in Tab. II and Fig. 6 To evaluate the significance of the performance difference we have estimated the average standard deviation σ ˆ of (1). Overall we obtain σ ˆ = 0.08, but if we exclude cross correlation, which has a higher variance than all others, then we obtain σ ˆ = 0.05. To give an idea of significance based on Student’s t-test from (1) we consider a difference larger than 0.05 as significantly different on a 84% confidence level and 0.1 as significant on a 98% level. The performance is computed for all 28 combinations on all 119 camera positions, where the distribution of the performance was evaluated over all 60 scenes. Our central evaluation criterion is the mean over these 60 scenes for a given position and detector-descriptor combination. Due to
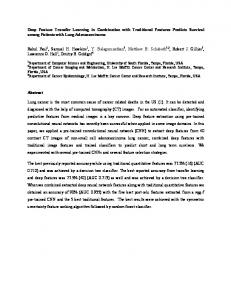
Figure 6. Mean AUC for the MSER detector displayed for all four descriptors and for all positions. The vertical axis in the graphs show the AUC, and the horizontal is the angle (a,c,d) and distance (b) relative to the key-frame. Each graph corresponds to the sample path shown in Fig. 2, with Arc 1 (a), Linear Path (b), Arc 2 (c) and Arc 3 (d). It is seen that the SIFT and the two DAISY descriptors have very similar performance, compared to a σ ˆ = 0.05, but outperform the correlation.
space limitations we are only able to present a summarized evaluation as shown in Fig. 6 and Tab. II outlining our conclusions. Fig. 6 shows a combination with the same detector but different descriptors. Cross correlation is clearly outperformed by the other descriptors. SIFT and DAISY has almost identical performance, and Tab. II shows that their average difference is less than 0.015, which is statistically insignificant. In Fig. 7 the SIFT descriptor is shown in combination with the seven detectors. We chose to show SIFT, but very similar results were obtained for the DAISY descriptors. Here there is a difference in performance where MSER and DOG detectors perform about one standard deviation better than the Harris affine and Harris Laplace detectors, and about two standard deviations better than the Harris based detectors, which is statistically significant. Harris corner detector with no scale adaption performs well when the scale change is not to large. So, our experiments suggest that the best choice is a DOG or MSER detector with a SIFT or DAISY descriptor, or a perhaps a Harris corner detector if the scale change is low. The dataset used also has different categories of scene types like ’fabric’, ’books’, ’model houses’, etc. and running the experiments on a specific scene type did not change the
overall picture. Compared to the results in [1], where the recall rate of detectors was evaluated on the same dataset, it is interesting to see that the best performers in a full feature tracking frame work are not identical to the ones with the best recall rates. Again this implies that the discriminative power of the extracted features vary for different feature detectors. This last point is especially noteworthy for the MSER detectors. Both the descriptor experiment presented in Sec. III and this combined experiment show that an affine detector has an advantage, but this advantage is small compared to variance making it statistically insignificant, see Fig. 8. V. D ISCUSSION Based on the experiments reported in this paper the general conclusion is that the best detector-descriptor combination is either the DOG or MSER detectors and SIFT or DAISY descriptors. If the scale change is low a Harris corner detector would be superior and also faster and simpler to run and implement. The experiments also show, that many other performance differences exist, which confirm other studies, but these differences are not statistically significant. This demonstrates a need for considering statistical significance when performing these type of comparisons, necessitating the use of large datasets to make meaningful estimates of significance and variance, such as the dataset used here [1].
a)
b)
d)
c)
e)
Figure 7. Mean AUC for the SIFT descriptor displayed for all seven detectors and all positions. The vertical axis in the graphs show the AUC, and the horizontal is the angle (a,c,d) and distance (b) relative to the key-frame. Each graph corresponds to the sample path shown in Fig. 2, with Arc 1 (a), Linear Path (b), Arc 2 (c) and Arc 3 (d). Here it is seen that the MSER and DOG detectors are the top performers, outperforming the Harris based detectors on a statistically borderline level, and significantly outperforming the hessian based descriptors. The performance of the ’pure’ Harris corner detector is very scale dependent. Similar results are obtained for the two DAISY descriptors, as indicated in Fig. 6. The validity of our findings is further cooperated by considered the probability distribution functions for each position, in (e) the pdf is shown for 0.86◦ of Arc 2.
Furthermore, it is interesting to note that the DOG detectors perform much better than the Hessian type detectors, although they are very similar, i.e. the DOG is basically a well-engineered approximation of the Laplace filter, which is equal to the trace of the Hessian. This indicates that perhaps a better-engineered version of the Harris Laplace corner detector, inspired by the DOG detector, could be made. This is especially interesting in the light that the Harris corners performed better than the Hessians. A last point of curiosity is that we have not been able to produce results collaborating that using affine invariant feature detectors carries a statistical significant advantage on general scene types. However this type of invariance may have merit in e.g. 3D reconstruction of urban type scenes or other near-planar scenes. R EFERENCES [1] H. Aanæs, A. L. Dahl, and K. S. Pedersen, “On recall rate of interest point detectors,” in 3DPVT, 2010. [Online]. Available: http://campwww.informatik.tu-muenchen.de/3DPVT2010/ data/media/e-proceeding/session07.html#paper97 [2] H. Aanæs, A. L. Dahl, and V. Perfernov, “Technical report on two view ground truth image data,” DTU Informatics, Technical University of Denmark, Tech. Rep., 2009.
Figure 8. Affine vs. non-affine (Lap). Affine performs slightly better with large angles, but the improvement is not significant.
[3] D. Lowe, “Distinctive image features from scale-invariant keypoints,” IJCV, vol. 60, no. 2, pp. 91–110, 2004. [4] C. Schmid and R. Mohr, “Local grayvalue invariants for image retrieval,” IEEE T-PAMI, vol. 19, no. 5, pp. 530–535,
1997. [5] C. Schmid, R. Mohr, and C. Bauckhage, “Evaluation of interest point detectors,” IJCV, vol. 37, no. 4, pp. 151–172, 2000. [6] K. Mikolajczyk, T. Tuytelaars, C. Schmid, A. Zisserman, J. Matas, F. Schaffalitzky, T. Kadir, and L. Gool, “A comparison of affine region detectors,” IJCV, vol. 65, no. 1-2, pp. 43–72, 2005. [7] K. Mikolajczyk and C. Schmid, “A performance evaluation of local descriptors,” IEEE T-PAMI, vol. 27, no. 10, pp. 1615– 1630, 2005. [8] E. Tola, V. Lepetit, and P. Fua, “A Fast Local Descriptor for Dense Matching,” in CVPR, 2008. [9] H. Bay, T. Tuytelaars, and L. Van Gool, “Surf: Speeded up robust features,” ECCV, pp. 404–417, 2006. [10] H. Bay, A. Ess, T. Tuytelaars, and L. Van Gool, “Speededup robust features (SURF),” Computer Vision and Image Understanding, vol. 110, no. 3, pp. 346–359, 2008. [11] W. Freeman and E. Adelson, “The design and use of steerable filters,” IEEE T-PAMI, vol. 13, no. 9, pp. 891–906, 1991. [12] E. Balmashnova and L. Florack, “Novel similarity measures for differential invariant descriptors for generic object retrieval,” JMIV, vol. 31, no. 2-3, pp. 121–132, 2008. [13] L. Florack, B. ter Haar Romeny, J. Koenderink, and M. Viergever, “Cartesian differential invariants in scalespace,” JMIV, vol. 3, no. 4, pp. 327–348, 1993. [14] J. J. Koenderink and A. J. van Doorn, “Representation of local geometry in the visual system,” Biological Cybernetics, vol. 55, pp. 367–375, 1987. [15] E. Tola, V. Lepetit, and P. Fua, “DAISY: An efficient dense descriptor applied to wide-baseline stereo,” IEEE T-PAMI, vol. 32, no. 5, pp. 815–830, May 2009. [16] S. Winder, G. Hua, and M. Brown, “Picking the best daisy,” in CVPR, 2009. [17] S. A. J. Winder and M. Brown, “Learning local image descriptors,” in CVPR, 2007, pp. 1–8. [18] F. Fraundorfer and H. Bischof, “Evaluation of local detectors on non-planar scenes,” in Proc. 28th workshop of AAPR, 2004, pp. 125–132. [19] G. Hua, M. Brown, and S. Winder, “Discriminant embedding for local image descriptors,” ICCV, pp. 1–8, 2007. [20] M. Brown, G. Hua, and S. Winder, “Discriminative Learning of Local Image Descriptors,” IEEE T-PAMI, 2010. [21] N. Snavely, S. Seitz, and R. Szeliski, “Modeling the world from internet photo collections,” IJCV, vol. 80, no. 2, pp. 189–210, 2008.
[22] P. Moreels and P. Perona, “Evaluation of features detectors and descriptors based on 3d objects,” IJCV, vol. 73, no. 3, pp. 263–284, 2007. [23] T. Tuytelaars and K. Mikolajczyk, “Local invariant feature detectors: a survey,” Found. Trends. Comput. Graph. Vis., vol. 3, no. 3, pp. 177–280, 2008. [24] J. Matas, O. Chum, M. Urban, and T. Pajdla, “Robust widebaseline stereo from maximally stable extremal regions,” Image and Vision Computing, vol. 22, no. 10, pp. 761–767, 2004. [25] K. Mikolajczyk and C. Schmid, “Scale & affine invariant interest point detectors,” IJCV, vol. 60, no. 1, pp. 63–86, 2004. [26] C. Harris and M. Stephens, “A combined corner and edge detector,” in 4th Alvey Vision Conf., 1988, pp. 147–151.