FINGERPRINT PREDICTION USING CLASSIFIER ENSEMBLES
Promise Molale*, Bhekisipho Twala and Solly Seeletse *Department of Statistics and Operational Research, University of Limpopo, Medunsa Campus, P O Box 197, Medunsa 0240, South Africa
[email protected] [email protected] [email protected]
FINGERPRINT PREDICTION USING CLASSIFIER ENSEMBLES
ABSTRACT In this study, the application of classifiers to problems in fingerprint prediction is investigated. Six supervised learning and two statistical fingerprint classification methods (classifiers) are considered: linear discriminant analysis (LDA); logistic discrimination (LgD),
k-nearest neighbour (k-NN), artificial neural network (ANN),
association rules (AR) decision tree (DT), naive Bayes classifier (NBC) and the support vector machine (SVM). The performance of several multiple classifier systems are also demonstrated and evaluated in terms of their ability to correctly predicting or classifying a fingerprint using the National Institute of Standards and Technology (NIST) biometric image database. Examining the performance of the base classifiers showed DT, SVM and ANN to have the highest accuracy while LDA has the lowest accuracy rate. The results further show all the multi stage systems to significantly outperform the baseline classifiers. Accordingly, good performance is consistently derived from boosting.
KEY WORDS: fingerprints; classifier, machine learning, prediction
1 INTRODUCTION Fingerprint classification has long been an important part of any fingerprint system. Recently, several classifiers have been developed for fingerprint classification [Oteru et al., 1974; Amit et al., 1997; Jain et al., 1999; Capelli et al., 1999; Senior, 2001].The performance of classification-based IAFIS depends on the number of classes and on the distribution of fingerprints. As we know, the number of fingerprint classes is often small and in some cases the fingerprints are non-uniformly distributed.
In recent years, there has been an explosion of studies in the Machine Learning (ML) and statistical pattern recognition (SPR) communities discussing how to combine models or model predictions. Many studies in both communities have shown that combining (ensemble) individual classifiers is an effective technique for improving predictive accuracy. The performance of multiple classifier systems not only depends on
the power of the individual classifiers in the system but also influenced by the independence between individuals.
A classifier ensemble is generated by training multiple learners for the same task and then combining their predictions as demonstrated later in the study. There are different ways in which ensembles can be generated with the resulting output from each classifier then combined to classify new instances. The popular approaches to creating ensembles include changing the instances used for training through techniques such as bagging [Breiman, 1996], boosting [Freund and Schapire, 1996], stacking [Wolpert, 1992], changing the features used in training [Ho, 1995] introducing randomness in the classifier itself [Dietterich, 2000].
The major contribution of the study is to show the accuracy of eight classifiers for predicting fingerprints patterns and further show how the use of ensemble classifiers improves fingerprint pattern prediction. Five of the classifiers are in the top ten algorithms in data mining [Wu et al, 2008]. To the best of our knowledge this is the first study that has looked at ensemble classifiers for improving fingerprint prediction accuracy.
The study is organized as follows. The next section briefly gives details of the five classifiers used in this study, followed by a description of different types of MCS architectures. Then the robustness and accuracy of five MCSs to two image datasets which were fused is empirically explored. We close with conclusions and directions for future research.
2 SUPERVISED LEARNING METHODS Eight base methods of classifier construction which are considered in our study are given below.
Linear discriminant analysis (LDA): The two most important assumptions in LDA are that the data (for the variables) represent a sample from a multivariate normal distribution and the variance/covariance matrices of variables are homogeneous across groups (they are equal). With these assumptions, a linear discriminant function can be computed. In order to understand how the posterior probabilities are computed for classification purposes, it is important to first consider the so-called Mahalanobis distance (a measure of distance between two points in the space defined by two or more correlated variables). Mahalanobis distance is used to do the classification, and thus, derive the probabilities.
Logistic discrimination (LgDA): Logistic Discrimination Analysis (LgDA), due to Cox (1966) is related to logistic regression analysis. The dependent variable can only take values of 0 and 1, say, given two classes. This technique is partially parametric, as the probability density functions for the classes are not modelled but rather the ratios between them. A new element is classified as 0 if
π0 c
and as 1 if π0 c , where c is the cut-off point score. Typically, the
error rate is lowest for cut-off point = 0.5 (Rumelhart et al., 1986). In fact, the slope of the cumulative logistic probability function has been shown to be steepest in the region where, say, πi = 0.5. Thus, if i 0.5 , the unknown instance is classified as “1” and if i 0.5 , the unknown instance is classified as “0”. The generalization of the logistic discrimination approach to the case of three or more classes is known as the Multinomial Logit Model (MLM) and the derivation is similar to that of the logistic discrimination model. For more details about MLMs the interested reader is referred to Hosmer and Lameshow (1989).
k-nearest neighbour (k-NN): One of the most venerable algorithms in ML is the nearest neighbour. k-NN methods are sometimes referred to as memory-based reasoning, Instance-Based Learning (IBL) or case-based learning techniques [Aha et al., 1991]. They essentially learn by assigning to an unclassified sample point the classification of the nearest of a set of previously
classified points. The entire training set is stored in the memory. To classify a new instance, the Euclidean distance (possible weighted) is computed between the instance and each stored training instance and the new instance is assigned the class of the nearest neighbouring instance. More generally, these k-NNs are computed and the new instance is assigned the class that is most frequent among the k neighbours.
Artificial neural network (ANN): Artificial neural networks [Ripley, 1992] are usually nonparametric approaches (i.e., no assumptions about the data are made). They are represented by connections between a very large number of simple computing processors or elements (neurons). They have been used for a variety of classification and regression problems.
There
are
many
types of ANNs, but for the purposes of this study we shall concentrate on single unit perceptrons and multi-layer perceptrons also known as “back propagation networks”. The ANN is trained by supplying it with a large number of numerical observations of the patterns to be learned (input data pattern) whose corresponding classifications (target values or desired output) are known.
Association rules (AR): The goal of AR learning is to detect relationships or associations between specific values of categorical variables in large data sets. ARs shows attribute value conditions that occur frequently together in a given dataset. The Apriori [Agrawal et al., 1993] is a classic algorithm for learning association rules in data mining. In recent years, the Apriori has mostly been applied on databases containing transactions (for example, collections of items bought by customers, or details of a website frequentation). There are other algorithms that are designed for finding association rules in data having with no transactions, or having no recorded time when transaction took place. However, these are not covered in this paper.
Decision trees (DT): Decision trees [Breiman et al., 1984; Quinlan, 1993] are powerful and popular tools for classification and prediction. A DT is constructed by repeatedly splitting the sample in
two descendant subsets starting with the entire sample. The problem is to find the attribute that splits the sample optimally. One property that sets DTs apart from all other classifiers is their invariance to monotone transformations of the predictor variables. For example, replacing any subset of the predictor variables
{x j}
by (possible different)
arbitrary strictly monotone functions of them {x j m j (x j )} , gives rise to the same tree model. Thus, there is no issue of having to experiment with different possible transformations
m j (x j )
for each individual predictor
xj
to try to find the best ones. This
invariance provides immunity to the presence of extreme values (“outliers”) in the predictor variable space. In addition, DTs incorporate
Naive Bayes classifier (NBC): The naive Bayes classifier is perhaps the simplest and most widely studied probabilistic learning method based on the so-called Bayesian theorem and is particularly suited when the dimensionality of the inputs is high. The independence assumptions often do not have an impact on reality. Therefore, they are considered as naive. Despite its simplicity, NBC can often outperform more sophisticated classification methods. NBC learns from the training data, the conditional probability of each attribute A i, given the class label C [Duda and Hart, 1973]. The NBC can handle an arbitrary number of predictor (independent) attributes whether continuous or categorical. The strong major assumption is that all attributes Ai are independent given the value of the class C. Classification is therefore done applying Bayes rule to compute the probability of C given
A1 ,...,An and
then predicting the class with the highest posterior probability
[Kononenko, 1991].
Support Vector Machines (SVM): Support vector machines (SVMs) are pattern classifiers that can be expressed in the form of hyper-planes to discriminate positive instances from negative instances pioneered by Vapnik (1995). The principal goal of the SVM approach is to fix the computational problem of predicting with kernels. The basic idea of SVMs is to determine a classifier or regression machine which minimizes the empirical risk (i.e.,
the training set error) and the confidence interval (which corresponds to the generalisation or test set error). In other words, the idea is to fix the empirical risk associated with architecture and then use a method to minimize the generalisation error. Motivated by statistical learning theory, SVMs have successfully been applied to numerical tasks, including classification. They can perform both binary classification (pattern recognition) and real valued function approximation (regression estimation) tasks.
3 MULTIPLE CLASSIFER ARCHITECTURES (MCSs) MCSs can be classified into one of three architectural types: (1) Static Parallel (SP); (2) Multi-Stage (MS); and (3) Dynamic Classifier Selection (DCS). The outputs from each classifier are combined to deliver a final classification decision. A large number of combination functions are available. These include: voting methods (simple majority vote, weighted majority vote, the product or sum of model outputs also known as the product rule, the minimum rule, the maximum rule); Rank based methods (borda count); Probabilistic methods (Bayesian methods).
Static parallel (SP): SP is probably the most popular architecture and it is where two or more classifiers developed independent in parallel [Zhu et al., 2001]. The outputs from each classifier are then combined to deliver a final classification decision (where the decision is selected from a set of possible class labels). A large number of combination functions or sampling strategies are available.
Multi-stage (MS): In this type of architecture the classifiers are constructed iteratively. At each iteration the parameter estimation process is dependent upon the classification properties of the classifier(s) from previous stages. Some MS approaches generate models that are applied in parallel using the same type of combination rules used for SP methods.
Dynamic classifier selection (DCS): For DCS, different classifiers are developed or applied to different regions within the problem domain. While one classifier may be shown to outperform all others based on global measures of performance, it may not dominate all other classifiers entirely. With DCS local regions of interest are determined first and then separate classifiers developed for each region of interest.
Now in order to explore the different architectures, we first need to look at how a general ensemble classifier is generated.
Classifier ensemble: A generalized classifier ensemble algorithm is summarized in the following steps [Twala, 2010]:
1. Partition original dataset into n training datasets, TR1, TR2, ...,TRn; 2. Construct n individual models (M1, M2, Mn) with the different training datasets TR1, TR2, …, TRn to obtain n individual classifiers (ensemble members) generated by different algorithms. 3. Select m the de-correlated classifiers from n classifiers using de-correlation maximization algorithm [Jolliffe, 1986]; 4. Using step 3, obtain m classifier output values (misclassification error rates) of an unknown instance; 5. Transforming output value to reliability degrees of positive class and negative class, given the imbalance of some datasets; 6. Fuse the multiple classifiers into aggregate output in terms of majority voting.
Note that, five different training techniques are looked at when creating the ensembles, i.e. bagging, boosting, stacking, feature set sub-sampling, and randomization. All five techniques use the same instances for the training task.
4 EXPERIMENTAL SET-UP For the simulation study, the eight base methods of classifier construction were chosen. Each method utilizes a different form of parametric estimation/learning; between them they generate different models forms: linear models, density estimation, trees and networks; and they are all practically applicable within biometric fingerprint images with known examples of their application within the biometric industry. The methods also come from two diverse research communities: machine learning and statistics.
The experiments were performed using the NIST special database 4 biometric images dataset [Watson and Wilson, 1992; Candela and Chellappa, 1993]. The dataset consist of 256 grey-level images; two different fingerprint instances (F = first, S = second) are present for each finger. Each fingerprint was manually analysed by a domain expert and assigned to one of the following 5 classes: arch (A), left loop (L), right loop (R), tented arch (T) and whorl (W). The dataset contains 2000 uniformly distributed fingerprint pairs in five classes (A = 3.75%; T = 2.9%; L = 33.8%; R = 31.7% and W = 27.9%). The cardinality of the less frequent class was removed, resulting to 1204 pairs (the first fingerprint from each class have been chosen according to the right proportion).
To begin, single classifiers were constructed using each method. These were used to provide benchmarks against which various multiple classifier systems were assessed. To select the appropriate number of ensemble members, the de-correlation maximization method by Jolliffe (1986) was utilized. The five classification techniques were applied to the test sample and the cross validation sample. The input variables were transformed to dummy variables for logistic discrimination and the feed-forward neural network.
For the LD and LgD classifiers the Venables and Ripley [2001] SPLUS code is utilised; the remaining six classifiers are performed using the Waikato Environment for Knowledge Analysis (WEKA) software [Witten and Frank, 2005]. WEKA is a collection of machine learning algorithms for data mining tasks. The algorithms can either be applied
directly to the dataset or called from your own Java code. For the purposes of this study, we follow the former procedure and by using the default values.
Using the de-correlation technique, five classifiers or members are selected for each ensemble, making an overall total of ten ensembles. For example ensemble 1 (ENS1) is composed of LDA, LgD. ANN, AR and DT; ensemble 2 (ENS2) is composed of LDA, LgD, ANN, AR and k-NN, and so on.
All statistical tests are conducted using the SPLUS statistical software program. Analyses of variance, using the General Linear Model procedure are used to examine the main effects and their respective interactions. To measure the performance of classifiers, the training set/test set methodology is employed. For each run, each dataset is split randomly into 80% training set and 20% testing or validating set. The performance of each classifier is then assessed by the misclassification rate (i.e., the per cent of misclassified instances out of the total instances in the validation data).
5 EXPERIMENTAL RESULTS
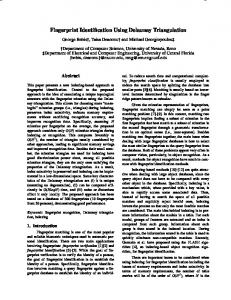
The results are summarized in Figure 1-4 in terms of misclassification error against the Baseline classifiers (BASE) and their respective ensembles (ENS1, ENS2, ENS3, …, ENS10).
Fig. 1: Mean Misclassification rate for base line classifiers
For the baseline classifiers, DT achieves the highest accuracy rate (73.7%), followed by SVM (71.5%), ANN (71.4%), NBC (69.4%), k-NN (68.2), AR (67.4%) and LgD (65.3%), respectively. The worst performance is by LDA with an accuracy rate of 63.9%. The differences in performance between the base individual classifiers are significant at the 5% level (with the exception of SVM and ANN which were found not to be significant).
All the static parallel systems (Figure 2) show some potential to significantly outperform the baseline. However, bagging is feature selection, with only ensembles using ANN, LgD and DT showing major improvement. Multi-stage systems provide statistically significant benefits over baseline models. The clear winners in static parallel architecture are boosting (79.44% accuracy) and randomization (77.76% accuracy), which provide large and significant improvements over the baseline and other multiple classifier systems for all methods considered. The best ensemble performances are when ANN and DT are components (Figure 3) while most ensembles with LgD or LDA as components struggle.
Fig. 2:Ensemble classifiers (static parallel)
Fig. 3: Ensemble classifiers (multi
parallel)
DCSs that look to segment the population in a number of sub-regions are consistently poor performers, with all the experiments yielding results that are inferior (in some instances) to the single best classifier. However, the performance of most static parallel
and multi-stage combination strategies provide statistically significant improvements compared to DCSs (Figure 4).
Fig. 4: Ensemble classifiers (dynamic classifier selection)
6 CONCLUSION The paper has described how it can be beneficial to combine the results of a number of different classifiers in ensemble classifier systems when dealing with biometric images for example in the crime investigation industry. Although there is no general, universally applicable rule as to how classifiers should best be combined, it has been shown that, when the individual classifiers are tuneable over a range of decision thresholds and capable of delivering a confidence estimate with their output, boosting using a static parallel system is a useful tool for appropriate combination outputs.
In summary, it has been found that the combination of multiple classifiers can enhance the classification and identification accuracy to a great extent. Based on the experiments and findings on this study, it can be concluded that multiple classifier combination can play an important roles in biometric image classification by making full use of the abundant and detailed information in imaging and integrating the benefits of different classifiers. Overall, multiple classier learning by boosting achieved good results across all different architectures with multi stage exhibiting higher accuracy rates. The good performance of DT as an individual could be attributed to its pruning, i.e. removing outliers from the dataset, strategy (which is able to handle outliers in data). The poor
performance of k-NN is expected as it struggles with data with high dimensionality due to its heavy reliance on the distance metric property. Furthermore, for the dataset used in the experiments the dimensionality of the inputs (or attributes) is low, this could have contributed to the poor performance of the NBC which relies heavily on the high dimensionality of inputs.
ACKNOWLEDGEMENT This study was carried out with the financial support of the Council of Scientific and Industrial Research and the Statistics and Operational Research Department at the University of Limpopo, Medunsa Campus. We would also like to thank NIST for allowing us to have access on Special 4 biometric images database and further use them for all our experiments.
REFERENCES Agrawal, R., T. Imielinski and A. Swami, 1993. Mining Association Rules between Sets of Items in Large Databases, SIGMOD Conference, pp: 207-216. Aha, D.W., D. Kibbler and M.K. Albert, 1991. Instance-based learning algorithms. Machine Learning, 6: pp: 37-66. Amit, Y., D. Geman, and K. Wilder, 1997. Joint Induction of Shape Features and Tree Classifiers. IEEE Transc. on Pattern Anal. and machine Intell., 19 (11), pp: 13001305. Breiman, L., 1996. Bagging predictors. Machine Learning, 26: 123-140. Breiman, L., J. Friedman, R. Olshen and C. Stone, 1984. Classification and Regression Trees. Wadsworth. Candela, G.T. and R. Chellappa, 1993. Comparative Performance of Classification Methods for Fingerprints. NIST Technical Report NISTIR 5163. Cappelli, R., A. Lumini, D. Maio., and D. Maltoni, 1999. Fingerprint Classification by Direct image Partitioning. IEEE Transc. On Pattern Anal. and Machine Intell., 21 (5), pp: 402-421.
Cox, D.R., 1966. Some Procedures Associated with The Logistic Qualitative Response Curve. In: Research Papers in Statistics: Festschrift for J. Neyman and F.N. David (Eds.). Wiley, New York, pp: 55-71. Dietterich, T., 2000. An experimental comparison of three methods for constructing ensembles of decision trees: Bagging, boosting and randomization. Machine Learning, 40: pp: 139-158. Duda, R.O. and P.E. Hart, 1973. Pattern Classification. 2nd Edn., John Wiley and Sons, New York. Freund, Y. and R. Schapire, 1996. A decision theoretic generalization of on-line learning and an application to boosting. J. Comput. Syst., 55: 119-139. Ho, T.K., 1995. Random decision forests. Proc. of the 3rd Int’l Conf. on Document Analysis and Recognition, pp: 278-282. Hosmer, D.W. and S. Lameshow, 1989. Applied Logistic Regression. Wiley, New York. Jain, A.K., S. Prabhakar and L. Hong., 1999. A Multichannel Approach to Fingerprint Classification. IEEE Transc. On Pattern Anal. and Machine Intell., 21 (4), pp: 3482359. Jolliffe, I., 1986. Principal Component Analysis. Springer Verlag. Kononenko, I., 1991. Semi-naïve Bayesian classifier. Proc. of the European Conference on Artificial Intell., pp: 206-219. Oteru, S., H. Kobayashi., Kato., T., Noda, F., and Kimura, H., 1974. Automated fingerprint classifier. Proc. of Intl Conf. Pattern Recognition, pp: 1985-189. Quinlan, J.R., 1993. C.4.5: Programs for Machine Learning. Los Altos, Morgan Kauffman Publishers, Inc, California. Ripley, B.D., 1992. Pattern Recognition and Neural Networks. Cambridge University Press, John Wiley, New York. Rumelhart,
D.E.,
G.E.
Hinton
and
R.J.
Williams,
1986.
Learning
Internal
Representations by Error Propagation. In: Parallel Distributed Processing, Rumelhart, D.E. and J.L. McClelland (Eds.). MIT Press, pp: 318-362. Senior, A., 2001. A Combination Fingerprint Classifier. IEEE Transc. On Pattern Anal. and Machine Intell., 23 (10), pp: 1165-1174.
Twala, B., 2010. Multiple Classifier application to credit risk assessment, Expert Systems and Applications, 37: pp: 3326-3336. Vapnik, V.N., 1995. Statistical Learning Theory. John Wiley & Sons, New York. Venables, W.N. and B.D. Ripley, 2001. Modern Applied Statistics with S-PLUS. Third Edition, Springer-Verlag. Watson, C.I. and C.L. Wilson, 1992. NIST Special Database 4: Fingerprint Database, Technical report, National Institute of Standards and Technology. Witten, I.H. and E. Frank, 2005. Data Mining: Practical Machine Learning Tools and Techniques. San Francisco, Morgan Kaufmann Publishers, CA., USA. Wolpert, D., 1992. Stacked generalization. Neural Networks, 5: pp: 241-259. Wu., X., V. Kumar, J.R. Quinlan, J. Ghosh, Q. Yang, H. Motoda, G.J. McLachlan, B. Liu, P.S. Yu., Z-H. Zhou, M. Steinbach, D.J. hand, D. Steinberg, 2008. The top 10 algorithms in data mining. Knowledge Information Systems, 14, pp: 1-37. Zhu, H., P.A. Beling and G.A. Overstreet, 2001. A study in the combination of two consumer credit scores. J. Operat. Res. Soc., 52: 2543-2559.