'Department of Semiconductor Devices and Microelectronics, Novosibirsk State Technical University. 630092, Karl Marx Avenue 20, Novosibirsk Russia.
|l~ ~ lDg
Finite Element Based Macromodeling of Drag-Force Flowmeter
Victor A. Gridchin', Vladimir A. Kolchuzhin2 'Department of Semiconductor Devices and Microelectronics, Novosibirsk State Technical University 630092, Karl Marx Avenue 20, Novosibirsk Russia. 2Department of Microsystems and Precision Engineering, Chemnitz University of Technology, 09107, Chemnitz Germany Abstract The paper is concerned with an advanced simulation method based on FEM for extract lumped and integrated parameters, which describing a behaviour of the drag-force gas flowmeter. The macromodel of the drag-force flowmeter based on obtained results have been developed and compared with experimental data. This model can be used for an estimation static characteristic of flowmeter and circuit level simulations. -
I.
drag-force flowmeter is capable of measuring sporadic and multi-directional flows. The paper is organized as follows. In Section 2, the principle of operation is presented. The design of structure and numerical features of coupled-field FE analysis are discussed in Section 3, 4. In the last section, we provide conclusions.
The problem of the gas flow measurement is the important in measuring technique. Technical realization of the small gas flow measurement (less than 500 liter/hour) is most complex. This problem can be solved with using the MEMS-based devices [1-8]. With the rapid development of such sensors there is a growing need for fast and accurate MEMS design procedures. Microsystems design needs in various analytical and numerical methods for virtual prototyping. [9,10]. Mechanical components are commonly analyzing by Finite Element Methods (FEM) which is the state of the art for component design of MEMS. Physical effects related with electromagnetic, mechanical, fluid and thermal fields in complex devices are accurately described for static, harmonic and transient load situations [9,10]. Methods described in these sources allow fulfilling the accurate analysis of physical effects in 3D devices. On the other hand, there are numerous sophisticated tools which allow the virtual prototyping for circuits and control systems. They are well established for Electronic Design Automation (EDA). The problem is how to obtain a macromodel or lumped network model from these accurate results that represents just input/output interface terminals and can be directly linked into the system- or circuit-level [10]. The paper presents some results of the simulation for gas flowmeter, which has been developed at the Department of Semiconductor Devices and Microelectronics, NSTU [8]. The drag-force flowmeter is designed for using in medical breath monitoring systems, monitoring systems and automatic control of technological processes. The flowmeter is a silicon structure with four piezoresistors. The drag force is used here as a sensing principle. Main advantages of this flowmeter are: high sensitivity, durability, small dimensions and low cost. A
1-4244-0427-4/06/$20.00 ©2006 IEEE
DESIGN AND PRINCIPLE OF OPERATION
II.
INTRODUCTION
-
The flowmeter is using the drag force as a sensing principle, Fig.1 (domain 1). The flow-induced forces deflect the plate (domain 2) and the piezoresistors detects this deflection (domain 3). The output signal is taking from Wheatstone bridge (domain 4). 1. Fluid domain
2. Structural
3. Conductivity
4. Circuit domain
p =fi(v)
c =f2(F)
ARi=f3(U)
Vout =f4(ARi) RV
v
p
DA0pv D
2
Input QX
M7Alh
AR,
R
21
Design parameters {j
=2
.7,44
TU
Externalfactors
VIUt VI
R3
ICD F,
=
2
Output V
Fig. 1. Physical domains involved in operation of the flow sensor.
The
sensor
is based
on a
polished silicon (100)-oriented
n-
type substrate and standard IC-processing. To get the
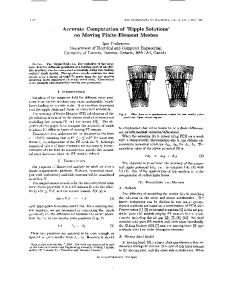
maximum of sensitivity the low doped silicon was used. The elastic sensing element with a thickness of 30 ptm is made by anisotropic wet etching in silicon. The size of chip is lOxIO mm. Two prototypes of sensor chip with large aerodynamic resistance, presented in Fig.2 have made for investigations. The slot d between the frame and the sensing element are 0.5 and 1 mm.
The aerodynamic resistance depends on the size, shape, and attitude of the elastic element. Reynolds number is another factor that determines resistance. In fact, considering the flow problems, the drag coefficient depends on Reynolds number as indicated in [11]:
362
-
Oct. 18 -Oct. 20, 2006 FOST2006
CD(Re) = Cl + C2/Re where C1 and C2 are the coefficients depends the elastic element. A
on
the shape of
Type II
Type I
A-A
1 1 10
III.
d
A
FLUID-STRUCTURE ANALYSIS
In first step of analysis the pressure distributions p(x,y,z) through the elastic element and pressure drop along the pipe were determined. After this step of simulation the pressure applied to the elastic element can be determined for the further mechanical analysis. For the ANSYS/FLOTRAN simulation the following FE model was built, Fig.3. The incompressible flow of gas is flowing trough the rectangular pipe with the flowmeter chip in the middle. The length of pipe is enough for satisfying the condition of uniformed flow at the pipe outlet and near the chip location. All tangential velocity on the boundaries is equal to zero. The outflow pressure was established as zero. At the inlet the uniformly distributed velocity vz was specified. The character of gas flow is determining by the dimensionless Reynolds number:
Re = p vL l ,u
Fig.2. Sketch of the chips with sensitivity element.
It is possible sequentially to get the transfer characteristic of where L is characteristic length, ,u is a fluid viscosity of the the sensor, that is output signal of the piezoresistive bridge as fluid. To compute drag coefficient the Reynolds number was changed from 10 to 105 and the turbulence model has been function of the gas flow [2,8]: activated if the Reynolds number is in excess of about 2000.
Vout
=
-;T44V2CDP (
Vs
yh)
4
where I and h are length and thickness of the sensitivity element; v and p are velocity and density of the fluid; 44 iS piezoresistive coefficient; Vs is voltage source. This function includes 7 parameters. The simplified analytical model gives possibilities to evaluative characteristics. We can perform sensitivity analysis to estimate influence of the each parameter on transfer characteristic: Sensitivity avou
Parameter 1 2 3 4 5 6 7
7r44 p
v
CD 1 h Vs
1.381 10-9 1.29 2 500 3. 1030. 10-6 3
Pa' kg/m3 mlsec2 m m
Volt
r
1.74109
mVolt Pa-' m Volt/ kg/m3
4.00.10-3
mVoltper unit
1.86 2.41
1.60 103 -1.60 105 0.80
m VoltlmlseC2
mVoltlm mVoltlm m Volt/Volt
6outlet: P
In the accepted model for simplification of calculations it has not been taken into account complex geometry of sensors. The simulation process can be divided into a four domains, Fig. 1. From the flow rate Q the pipe fluid velocity can be defined as: v = QIA1, where A1 is the pipe cross-section area. FE software products ANSYS/Multiphysics 9.0 has been used for performing the coupled-field analysis. It provides the more detail representation of characteristics of the flowmeter and the possibility to check our FE solution with simple analytical model at each domain of signal transformation. We have developed the APDL scripts which generates the 3D FE model from layout data.
-
Fig.3. Sketch of the fluid simulation domain with boundary conditions.
Drag force was calculated by means of integration of the surface of sensitivity element:
pressure on
FD= J[p(x, y, z)] dxdy AD
Then drag coefficient is: C
2FD
PV2A2 where A2 is frontal area of the sensitivity element. The received dependence of the coefficient CD Reynolds number is shown in the Fig.4:
363
-
versus
where [Ks] is the governing stiffness matrix; [KG] is the conductivity matrix; IF} is the nodal force vector; I}I is the nodal current vector; I{u} is the nodal displacement vector; I (P is the nodal electric potential vector; The piezoresistive coupling problem is solved as a sequence of 2 iterations: 1) The nodal displacements under the influence of external mechanical load are computed: {u} =[Ks]-' {F} After that the elements stress in gauss points is calculated:
1, E+05 r
U* l .L)
(1to
1, E+00 1, E+00
{C} = [D] [B]. {U} In such relations [D] is the elasticity matrix and [B] is the
1, E+01
1, E+02
1, E+03
1 E+04
strain-displacement matrix;
1, E+05
2)
Reynolds number
calculated: {f} = [KG ]-1 *{I}
Fig.4. Drag coefficient CD of the structures as function of IReynolds number.
IV.
The distribution of potentials in the deformed
COUPLED-FIELD PIEZORESISTIVE ANALYSIS
V.
In second step the components of mechanic,al stresses at the resistor location area were calculated. The pres,sure distribution p(x,y,z) received from the fluid analysis was iintroduced to the structure model. Anisotropic material properti es of silicon and nonlinear mechanical model have been vised. After the calculation of the stress distribution the str^ess components through the piezoresistors were integrated and this integral value was used as an input value for calcul ating the output signals. The relation between output signal and mechanical stresses for the work range of pressures iis linear, Fig.7. However, the FE method allows considerinjg the non-linear relations as well. In Fig.5 the FE model of the sensitivitty element with piezoresistor is shown.
body
is
RESULTS OF ANALYSIS
The Simulink model of the drag-force flowmeter consists of 4 blocks with correspond to the principle of operation, Fig.6. The results of modeling are shown on Fig.7.
Fig.6. Simulink implementation of the drag-force flowmeter.
)Vs
(OO
Vout
R2
5 F md
Fig.5. FE model of the half sensitivity element with piezoresistors. The coupled-field finite element matrix for the piezoresistive analysis is given by: |[Ks]I L[
1
fful
[KG({&})]]{
_ {F}
{F}
-
Static experimental characteristics of the sensor were determined through a series of calibration tests in the two ranges of air flow rate from 10 to 120 and 300 to 1200 liter per hour. Numerical verifications based on both the FEM and macromodelling are presented on the Fig.8-9. The results simulated by FEM are validated by comparison with experimental tests and shown the reasonable coincidence. At flow rate smaller than 100 1/h, results of macro modelling coordinated to experiment within the limits of 15 percent. For the large flow rate difference between results of numerical modelling and experimental increases and for the rate 1000 1/h already makes over 30 percent. In the accepted analytical model of a sensor the sizes of a slot are considered as constants that are fairly for small flow rate. Numerical verifications based on the FEM agree within a 10 percent.
364 -
[3] Svedin N., Kalvesten E., Stemme E., and Stemme G., 'A New Silicon GasFlow Sensor Based on Lift Force'. Journal of Microelectromechanical Systems, Vol.7, No.3, 1998. [4] Osipovich L.A., Gutkin L.A. 'A strain-gage gas flowmeter.' Datchiki & Systemi (Sensors & Systems), 2001, v.4. (in Russian). [5] T. von Papen, H. Steffes, H.D. Ngo, E. Obermeier, 'A micro surface fence probe for the application in flow reversal areas'. Sensors and Actuators, A 97-98, 2002, pp. 264-270. [6] Fan Zh., Chen J., Zou J., Bullen D., Liu Ch. and Delcomyn F., 'Design and fabrication of artificial lateral line flow sensors.' J. Micromech. Microeng. No.12, 2002, 655-661. [7] Radhakrishnan Sh. and Lal A., 'In-channel Micromechanical drag flow sensor with electronic readout.' 16th IEEE International Microelectromechanical Systems Conference, Japan, pp 307-310, 2003. [8] Kolchuzhin V.A., Gridchin V.A., 'The integrated tensometric gas flow meter'. Nauchniy vestnik. NSTU, 2004. (in Russian). [9] Mehner J.E., 'Entwurf in der Mikrosystemtechnik', Dresden Univ. Press 2000. [10] Senturia S. D., 'Microsystem Design', Kluwer 2000. [ 11] Idelchik I.E. 'Handbook of hydraulic resistance', 1996. [12] ANSYS Inc.: ANSYS Users Guide, Theory Reference manual. Canonsburg, USA.
x 10
4
0.8 E
Z 0.6
2 ._>~ 0
0
0.4
0 LL
> 1
0.20
Flow
50
rate,
0
100
I/h
0
2500
1200r
2000
1000
1500
cl
1000 0L 0
x
10
3
2
3
800
1
2
Velocityrm/s
_-l
4
3
400
106
0
1
Velocityrm/s
0.8
8
0.6
6
ty- 0.4
4
3,0-
0.2
2
0 0
0.5
Force, N
5
Stress,
10-3
Pa
10 x 106
>
E
4
3 E I
o
5
Stress,
Pa
10
x
106
|Ao/A
0.063
0
A4 0.9 Ao/Al = 0. 195|
0,5 Flow
50
rate, I/h
.
100
0,00
20
Fig.7. Analytical behavior of the drag-force gas flowmeter.
V.
=
0n
2-2
0_ o
2,0
.2 115-
3
E
A experement - macromodelling
2,5
0
1
x
4
0
2
Velocityrm/s
600
500
n
1
40
60 Flow rate in 1/h
80
100
120
Fig.8. Accuracy of simulation results compared to experimental behavior of the drag-force gas flowmeter (flow rate from 10 to 120 liter per hour).
CONCLUSIONS
We have used a simulation method based on FEM for extract lumped and integrated parameters, which describing a behaviour of the drag-force gas flowmeter. The macromodel of the drag-force flowmeter based on obtained results and analytical descriptions have been developed and compared with experimental data. This model can be used for an estimation static characteristic of flowmeter and circuit level simulations. The developed approaches can be used in the future to design new sensing microsystems. Further work will be focused on dynamic systems capturing inertial effects.
350
A experement
300
-
macromodelling
-- FE simulation
250 E
-' 200
|Ao/A
.2) en
:-
0
=
0.063
150 100
IAo/AI
=
50
REFERENCES [1] Miller R. W., 'Flow Measurement Engineering Handbook', McGraw-Hill, New York. [2] Su Y., Evans A. G. R. and Brunnschweiler A., 'Micromachined silicon cantilever paddles with piezoresistive readout for flow sensing.' Journal of Micromechanics and Microengineering. No.6, 69-72, 1996.
-
300
400
500
600
0.195
700 800 900 Flow rate in I/h
1000
1100
1200
1300
Fig.9. Accuracy of simulation results compared to experimental behavior of the drag-force gas flowmeter (flow rate from 300 to 1200 liter per hour).
365
-