Finite Element Parametric Study on the Performance of Strip Footings on Reinforced Crushed Limestone over Embankment Soil Murad Abu-Farsakh Research Associate Professor, Louisiana Transportation Research Center, Louisiana State University, 4101 Gourrier Avenue, Baton Rouge, LA 70808, USA, Email:
[email protected]
Jie Gu Graduate Student, Department of Civil and Environmental Engineering, Louisiana State University, Baton Rouge, LA 70803, USA, Email:
[email protected]
George Voyiadjis Chair and Bingham C. Stewart Distinguished Professor, Department of Civil and Environmental Engineering, Louisiana State University, 3508B Patrick F. Taylor Hall, Baton Rouge, LA 70803, USA, Email:
[email protected]
Qiming Chen Research Associate, Louisiana Transportation Research Center, Louisiana State University, 4101 Gourrier Avenue, Baton Rouge, LA 70808, USA, Email:
[email protected]
ABSTRACT Finite element analyses (FEA) were performed to evaluate the benefits of replacing embankment soil underneath strip footing that supports bridge approach slab with reinforced crushed limestone. Benefits were assessed in terms of increasing the ultimate bearing capacity and reducing the footing settlement. The crushed limestone was modeled using the DruckerPrager constitutive model, and the crushed limestone-reinforcement interaction was modeled using the Coulomb friction model. The finite element model was first verified by laboratory model footing tests and then used to analyze the strip footing supported by reinforced crushed limestone in order to seek an optimum reinforcement design. To this end, several reinforcement design parameters were investigated, including depth of first reinforcement layer, effective reinforcement length, number/spacing of reinforcement layers, reinforcement stiffness, footing embedment, and footing width. The results of this study showed that there exists an optimum depth of first reinforcement layer where the highest bearing capacity can be achieved. The influence of other design parameters on the footing’s bearing capacity and settlement was also analyzed and discussed in this paper. Regression analysis was performed on the results of FEA in an attempt to develop a model that evaluates the increase in the bearing capacity of reinforced crushed limestone.
KEYWORDS:
Geosynthetics, Reinforced crushed limestone, Finite element analysis, reinforcement, Bearing Capacity Ratio, Settlement reduction factor, Regression analysis.
- 723 -
Vol. 17 [2012], Bund. F
724
INTRODUCTION The construction of shallow foundations on top of existing weak soil deposits or on embankment soils of low to medium plasticity can result in low load bearing capacity and/or excessive footing settlement problems. This can cause structural damage, reduction in durability, and/or deterioration in the performance level. Therefore, appropriate engineering measures are generally required in order to ensure the expected performance of infrastructures. Conventional treatment methods were to replace part of the weak soil with an adequately thick layer of stronger granular fill, increase the dimensions of the footing, or a combination of two. An alternative and more economical solution is the use of geogrid (or steel mesh) to reinforce the soils. This can be done by either reinforcing the existing soil directly or replacing poor soils with stronger granular fill in combination with the inclusion of reinforcements. The resulting composite zone (reinforced soil mass) will improve the load carrying capacity of the footing and provide better pressure distribution on top of the underlying weak soils, hence reducing the associated settlements. In the past two decades, reinforced soil structures, largely on granular soils, have successfully been used in many geotechnical engineering applications, such as earth retaining walls, embankments, pavements, and shallow foundations. Researchers have also shown that reinforcement is a cost-effective solution to increase the ultimate bearing capacity and/or reduce the settlement of shallow footings compared to the conventional methods, such as replacing natural soils or increasing footings’ dimensions. The early study on reinforced soil foundation (RSF) was conducted by Binquet and Lee (1975) to evaluate the benefits of metal strips on the bearing capacity of reinforced sand soil. Since then, several researchers (e.g., Milligan and Love 1984; Guido et al. 1986; Mandal and Sah 1992; Omar et al. 1994; Chadbourne 1994; Espinoza and Bray 1995; Lee and Manjunath 2000; Sadoglu et al. 2009; Chen et al. 2009; Latha and Somwanshi 2009) have conducted experimental studies on small-scale model tests to investigate the potential benefits of reinforcing the soil (sand, clay, and aggregate) underneath the footing. These studies have qualitatively demonstrated that reinforcing the soil can increase the soil’s ultimate bearing capacity and help reduce the footing settlement by redistributing the applied loads to a wider area. The work of Abu-Farsakh et al. (2007a) and Adams and Collin (1997) on large-scale model tests on geosynthetic-reinforced clay and sand further confirmed the benefits brought by the RSF. Researchers introduced the bearing capacity ratio (BCR), which is defined as the ratio of the bearing capacity of the RSF to that of unreinforced soil foundation, to evaluate the benefits of using RSFs. Many of these research efforts aimed at investigating parameters and variables that would contribute to the BCR value. Yetimoglu et al. (1994) performed both laboratory model tests and finite element analyses on rectangular footing on top of geogrid-reinforced sands. They identified the factors that significantly affect the bearing capacity of the reinforced foundation, including the depth of first layer reinforcement, the vertical spacing of reinforcement layers, the size of reinforcement sheet, and the number of reinforcement layers. From the finite element analysis of strip footing on reinforced clay, Maharaj (2003) concluded that in the case of a single layer of reinforcement below footing, there is an optimum embedment depth of reinforcement at which the reduction in settlement is maximized. He also found that the footing settlement was reduced with the increase in the number of reinforcement layers and reported that the increase in geosynthetics’ stiffness resulted in reducing the settlement of the footing. A finite element parametric study conducted by Abu-Farsakh et al. (2007b) on geogrid reinforced embankment silty clay soil demonstrated the effect of various parameters contributing to the benefits of reinforcing the soil.
Vol. V 17 [2012], Bund.. F
72 25
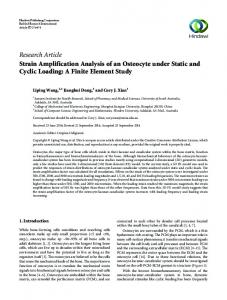
One O potential application to RSF is in n the designn of bridge aapproach slabb for highwaay engin neering to min nimize the ressulting differeential settlemeents. Excessivve differentiaal settlement oof the co oncrete appro oach slab currrently causes a significantt bridge “bum mp” problem. Past solutionns for prreventing thee bump from developing involved i the improvemennt of natural soil under thhe emban nkment, the use u of selecteed embankmeent fill materiials, and the uuse of piles w with decreasinng length hs supporting g the concretee approach slaab. These sollutions did noot perform well in reducinng the am mount of diffeerential settlements. To sollve this probllem, the state of Louisiana recommendeed chang ging the desig gn of approach slab by incrreasing its riggidity. Consequently, the sslab and trafffic loads will be transsferred to the two ends of the slab ratheer than distribbuted over the length of thhe slab. Accordingly, a shallow fou A undation is needed at the ffar end of thee approach slaab to carry that part of o the load. To o achieve a better bearing capacity and to prevent exxcessive settlement, the sooil underrneath the foo oting needs to o be reinforceed or replacedd with crusheed limestone iin combinatioon with reinforcemen nt (Figure 1). Based on a previous sstudy conducted by Abu--Farsakh et aal. 7b), the effecttive reinforcing zone for the t embankm ment soil was found to be 1.5B; B is thhe (2007 width h of footing. As A such, a deepth of 1.5B of embankm ment soil is reecommended to be replaceed with reinforced r cru ushed limesto one within thee embankmennt soil. Strip footings are tthen placed oon the reeinforced cru ushed limesto one to suppo ort loads froom the approoach slab, thhus helping tto minim mize the appro oach slab bum mp problem.
Fig gure 1: Rein nforced soil foundation f aapplied to appproach slab Most M of the afo orementioned d studies focu used on footinngs on reinforrced sand or reeinforced clayy, yet th he benefits of replacing weak w soil witth reinforcedd aggregate bbeneath a foooting have noot receiv ved enough attention. a In addition, a the realization oof potential bbenefits of foooting on RS SF depen nds on multip ple factors and a variables that need too be implem mented in a rrational desiggn metho od. It is thereefore importan nt to seek opttimum designn parameters through a paarametric studdy on thee influence off each factor on o the behaviior of a strip footing on geeosynthetics-rreinforced soiil. Over the years, thee finite elemen nt method has been provenn to be the moost effective ttechnique useed to con nduct compleex numerical analyses of many m geotechhnical probleems. The maiin objective oof this sttudy is to con nduct a finitee element parrametric studyy to investigaate the influeence of variouus factorrs on the beh havior, bearin ng capacity, and a settlemennt of strip foooting on reinfforced crusheed limesttone over em mbankment so oil and seek an optimum m reinforcemeent design. T The parameters being studied inclu ude the optim mum top spaciing for first rreinforced layyer, length off reinforcemennt
Vol. 17 [2012], Bund. F
726
layers, footing width, number/spacing of reinforcement layers, stiffness of reinforcement, footing embedment, and footing width. The performance of reinforced crushed limestone was assessed in terms of increasing the bearing capacity [bearing capacity ratio (BCR)] and reducing the footing settlement [settlement reduction factor (SRF)]. The BCR is the ratio of the bearing capacity of a footing for reinforced soil to that of unreinforced soil at a certain s/B ratio. The SRF here is the ratio of the immediate settlement of the footing on reinforced soil to that of unreinforced soil at a specified footing pressure.
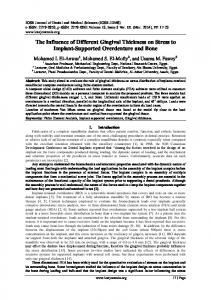
FINITE ELEMENT MODEL (FEM) The commercial FEM program ABAQUS was used in this study (Hibbitt, Karlson, & Sorensen, Inc. 2002). A two-dimensional plane strain model was adopted to simulate the strip footing over reinforced crushed limestone to depth (D) equal to 1.5 times the footing width (B) over embankment soil. Because of symmetry, only half of the footing was simulated. The geomaterials were discretized using four-node isoparametric elements, while the reinforcement was modeled using two-node isoparametric truss elements. The reinforcement-crushed limestone interaction was simulated by two fully bonded contact surface. The boundary dimensions for the finite element model were determined by conducting several analyses on different mesh sizes to select the dimension of the mesh in which the footing’s bearing capacity is not affected by the boundary conditions. Sensitivity analysis was also conducted to find the degree of mesh refinement to minimize mesh-dependent effects and converge upon a unique solution. The finally adopted finite element model, which has the dimensions of 7.5B × 7.5B and includes 16,500 elements, is illustrated in Figure 2. In the figure, the width of the footing, depth of the first reinforcement layer (also called top layer spacing), depth of the last reinforcement layer, and vertical spacing between reinforcement layers is designated as B, u, D, and h, respectively. The footing is regarded as rigid, so applying load on the footing is equal to applying uniform vertical downward displacements at the nodes immediately underneath the footing. Horizontal displacements at the interface between the footing and soil were restrained to zero, assuming perfect roughness of the interface and symmetry of the footing. The vertical displacement was applied in increments of 1000 to achieve a smooth response curve. In the loading process, a footing pressure producing a footing settlement of 10% of the footing width (s/B = 0.1; here s is the footing settlement) at the footing center was taken as the ultimate bearing stress (Yoo, 2001). The embedment of a footing was simulated by applying a uniform pressure (σ = γsDf, with γs as the soil’s unit weight and Df as the embedment depth of footing) at the bottom level of the footing. The initial geostatic stress condition of the reinforced soil was established by applying the gravity force due to soil in steps with the reinforcement in place.
Vol. 17 [2012], Bund. F
727
Figure 2: Finite element model of strip footing on reinforced crushed limestone over embankment soil
MATERIAL MODEL AND PARAMETERS The studied soil was modeled as an isotropic elasto-plastic continuum described by the extended Drucker-Prager model. The linear Drucker-Prager criterion was used in this study and is written as:
F = t − p ⋅ tan β − d = 0
(1)
3 1 1 1 r t = ⋅ q ⋅ 1 + − 1 − ⋅ 2 K K q
(2)
where, β is the slope of the linear yield surface in the P-t stress plane and is commonly referred to as the friction angle of the material; d is the cohesion of the material; K is the ratio of the yield stress in triaxial tension to the yield stress in triaxial compression; p is the mean effective stress; q
Vol. 17 [2012], Bund. F
728
is the Mises equivalent stress; and r is the third invariant of deviatoric stress. Under plane strain condition,
β = arctan
3 ⋅ sin ϕ 1 1 + ⋅ sin 2 ϕ 3
;
d=
and
c ⋅ 3 ⋅ cos ϕ 1 1 + sin 2 ϕ 3
(3)
where, φ is the Mohr-Coulomb frictional angle of the soil and c is the Mohr-Coulomb cohesion of the soil. A full interlocking behavior is believed to exist between crushed limestone aggregates and grid reinforcement due to the size and angularity of limestone aggregates. This was assumed in many previous studies (e.g., Nazzal 2007). As such, a full interlocking between the grid reinforcement and the surrounding crushed limestone is also assumed in this study, i.e. crushed limestone and grid reinforcement are tied together at interface so that there is no relative motion between them. This type of contact interactions can be achieved by tied contact available in ABAQUS/standard. The crushed limestone material used in this study has a friction angle of 48° obtained from large-scale direct shear test. The elastic modulus of the crushed limestone was estimated from triaxial and geogauge tests to be 120 MPa. An embankment soil of medium plasticity was also used. Previous research study conducted on marginal embankment soil in Louisiana (Cai et al. 2005) indicated that the soil has a plasticity index (PI) of 15 and a liquid limit (LL) of 27. Eight different uniaxial reinforcements of different elastic moduli are used in this study, designated as Type I through VIII. Type IV and Type VI reinforcements correspond to the steel wire mesh (SWM) and steel bar mesh (SBM) that were used by Abu-Farsakh et al. (2007a) to reinforce the crushed limestone in the small-scale laboratory model footing tests. The properties of studied geomaterials and reinforcements are summarized in Table 1.
Table 1: Material properties Material
Friction Cohesion Elastic modulus Elastic Tensile modulus Poisson (MPa) (kN/m) Ratio Angle (φ) (kPa) 48 120 0.35 30 80 260 0.3 1473 0.3 2945 0.3 5890 0.3 11780 0.3
Crushed limestone * Embankment soil ** Reinforcement I Reinforcement II Reinforcement III Reinforcement IV (SWM) Reinforcement V Reinforcement VI (SBM) Reinforcement VII Reinforcement III SWM: Steel wire mesh; SBM: Steel bar mesh;
-
23560 35607
0.3 0.3
-
70947 141895
0.3 0.3
Vol. 17 [2012], Bund. F
729
* Parameters from large-scale direct shear test; ** Parameters from previous research study ( Cai, C.S. et al., 2005).
VERFICATION OF FINITE ELMENT MODEL It was difficult to perform large-scale experiment. Instead small-scale model tests (152 mm × 152 mm) were conducted in the laboratory using the same crushed limestone aggregate material (Abu-Farsakh et al., 2007a). The FE model was first verified by comparing the results of finite element analyses with the results of laboratory model footings tests unreinforced crushed limestone and crushed limestone reinforced with geogrids and SWM reinforcements. Figure 3 presents the comparison between experimental results and FE numerical results, which shows that the model can simulate the reinforced crushed limestone as well as unreinforced crushed limestone with good accuracy.
0 0.2
5
0.4
10
0.6
15
0.8
20 25
LAB (unreinforced soil) FEM (unreinforced soil)
30
1.2 0
2500
5000
Footing Settlement (inch)
1500
0
2000 0
1
1000
(m m )
500
0
2000 0
0.2
5
0.4
10
0.6
15
1000
1500
20
0.8
LAB (3-layers geogrid reinforced soil) FEM (3-layers geogrid reinforced soil) asso
1 0
7500 10000 12500
500
2500
5000
25
7500 10000 12500
(kPa)
(kPa)
(a) unreinforced soil
(b) 3-layers of geogrid reinforced soil
0
500
1000
1500
2000 0
0.2
5
0.4
10
0.6
15
0.8
20
1
25
1.2
30
(mm)
Footing Pressure (psi) 0
Footing Settlement (inch)
Footing Settlem ent (inch)
0
35
1.4 LAB (1-layer SWM reinforced soil) FEM (1-layer SWM reinforced soil)
1.6
40 45
1.8 0
2500
5000
7500
10000 12500
(kPa)
(c) 1-layer of SWM reinforced soil
Figure 3: Comparison between experimental results and finite element analysis
(mm)
Footing Pressure (psi)
Footing Pressure (psi)
Vol. 17 [2012], Bund. F
730
RESULTS AND ANALYSES General Based on results of previous experimental and numerical studies (Abu-Farsakh et al., 2007a, b), the effective depth of reinforcement was obtained to be about 1.5B (B is footing width). Therefore, in this analysis, the embankment soil under the strip footing was replaced with reinforced crushed limestone to a depth equal to 1.5B under the footing. A comprehensive finite element parametric study was then conducted to evaluate the influence of various factors on the performance of strip footing on the reinforced crushed limestone layer on top of embankment soil. For each case (including both unreinforced and reinforced cases), the load-deformation curve obtained from the finite element simulation was used to determine the ultimate bearing capacity and settlement of the footing. The ultimate bearing capacity of the footing was defined as the bearing capacity that corresponds to a settlement ratio (s/B) of 10%. The vertical stress distributions within the foundation soil below the footing and the strain distribution along the reinforcements layers are first presented, which will help in understanding the reinforcement mechanisms. The vertical stresses obtained at the load corresponding to the ultimate load capacity of unreinforced crushed limestone were normalized against the applied footing stress. Figures 4a and 4b depict the normalized vertical stresses obtained at 1.5B and 3.0B, respectively, below the footing for unreinforced cases and cases reinforced with threelayers and six-layers of SWM. In both cases, the reinforcements were placed within 1.5B beneath the footing. The figures clearly indicated that the inclusion of reinforcement layers resulted in reducing the magnitude of vertical stress through redistributing the load applied on the footing onto a wider range compared to the unreinforced case. This redistribution of load to a more uniform pattern below the reinforced zone will help reduce the consolidation settlement of underlying soft clayey soil which is a long-time process and directly related to the induced stresses. The more reinforcement layers included in the foundation soil, the more significant the reinforcement effect in the sense of reducing stresses in the foundation soil. 1
Normalized Vertical Stress
Normalized Vertical Stress
1 0.9 0.8
Unreinforced Soil 3-layers Reinforced Soil 6-layers Reinforced Soil
0.7 0.6 0.5 0.4 0.3 0.2 0.1 0 0
1
2
3
4
5
Horizontal Distance from Central Line(B)
(a) 1.5 B below the footing
6
0.9 Unreinforced Soil 3-layers Reinforced Soil 6-layers Reinforced Soil
0.8 0.7 0.6 0.5 0.4 0.3 0.2 0.1 0 0
1
2
3
4
5
Horizontal Distance from Central Line(B)
(b) 3.0 B below the footing
Figure 4: Normalized vertical stress distribution for cases reinforced with SWM reinforcement obtained at s/B=10%
6
Vol. 17 [2012], Bund. F
731
The strain distribution along the reinforcements, obtained at the load corresponding to the ultimate load capacity of unreinforced crushed limestone for three-layers and six-layers of SWM are shown in Figures 5a and 5b, respectively. In both cases, the reinforcements were placed within 1.5B beneath the footing. Figure 5 shows that the maximum strain along reinforcement occurs directly beneath the center of the footing and dramatically decreases as the distance away from the center of footing increases. As expected, the first reinforcement layer usually experiences the largest strain, while the last reinforcement layer experiences the lowest strain. The strains obtained along reinforcements for the three-layer case are larger than those obtained for the six-layer case. Figure 5 indicates that the developed tensile strains along reinforcement are within 1.5B-2.0B range from the center of the footing. This indicates that the reinforcement beyond the effective length of le ≈ 4.0B results in insignificant mobilized tensile strength and, thus, provides negligible effects on the improved performance of reinforced soil foundations. Accordingly, the length of reinforcement layers in reinforced soil foundation should be ≥ 4.0B for full mobilization of the reinforcements. Therefore, to fully mobilize the benefits brought by the reinforcement, the length of reinforcement layers was placed in the entire length of the model in the rest of the study. 2 1st layer reinforcement
1st layer reinforcement
1.5
1.5
Strain Developed in Reinforcement (%)
Strain Developed in Reinforcement (%)
2
2nd layer reinforcement 3rd layer reinforcement
1
0.5
0 0
1
2
3
4
5
6
7
-0.5
2nd layer reinforcement 3rd layer reinforcement 4th layer reinforcement 5th layer reinforcement 6th layer reinforcement
1
0.5
0
8
0
1
2
3
4
5
6
7
8
-0.5 Horizontal Distance from Central Line (B)
(a) 3-layers reinforced soil
Horizontal Distance from Central Line (B)
(b) 6-layers reinforced soil
Figure 5: Strain distribution along reinforcements, obtained at the ultimate load capacity of unreinforced soil, for SWM reinforcement
Optimum Location of Top Reinforcement Layer One important step in the design of RSF is the selection of the depth of the first reinforcement layer (u), which is believed to have a considerable effect on the benefit of reinforced soils as defined in terms of BCR (Yetimoglu et al., 1994; Singh, 1988; and Elvidge and Raymond, 2001). The u parameter needed to be evaluated before the FE parametric study was conducted. To do so, finite element analyses were conducted on a single layer, two layers, and three layers of SWM reinforced crushed limestone sections with the top reinforcement layer placed at varying depth ratios (u/B), where the spacing ratio h/B kept constant and was 0.35 for multiple-layer reinforced systems. Figure 6 presents the variations of BCR as a function of top layer spacing (u).
Vol. 17 [2012], Bund. F
732
For the single-layer reinforcement case, the BCR increases with the increase of the depth ratio (u/B) and then decreases after reaching a threshold value of u/B. This threshold depth ratio (u/B) for the single-layer of reinforcement, at which a peak BCR is obtained, is found to be u/B = 0.35. The variation of the BCR with depth ratios (u/B) is similar in the two-layer and three-layer reinforcement cases. The threshold depth ratio slightly decreases with the increase in the number of reinforcement layers. In these cases, the u/B ratio is about 0.33, which is the same ratio adopted in the FE parametric study. 1-layer SWM reinforced soil 2-layer SWM reinforced soil, h/B=0.35 3-layer SWM reinforced soil, h/B=0.35 1.5
BCR at s/B=10%
1.45 1.4 1.35 1.3 1.25 1.2 1.15 1.1 1.05 1 0
0.1
0.2
0.3
0.4
0.5
0.6
0.7
0.8
0.9
1
Top Layer Spacing (u/B)
Figure 6: Variation of BCR with u/B ratio in single-layer, two-layers and three-layers reinforcement s/B=10% The findings of the present study on the optimum u/B ratio are similar to those reported by other researchers (e.g., Shin et al. 2002; and Abu-Farsakh et al. 2007a, b). The results of FE analysis on reinforced silty clay soils by Abu-Farsakh et al. (2007b) showed that the optimum location of the top reinforcement layer (u/B) varies from 0.5 for one reinforcement layer to 0.3 for three reinforcements layers. The results of laboratory model footing tests conducted by AbuFarsakh et al. (2007a) showed that the u/B = 0.33 for geogrid-reinforced silty clay and sand. Shin et al. (2002) showed that for strip footings on geogrid-reinforced sand and clay the ultimate BCR can be achieved when u/B is around 0.3 for reinforced sand and 0.4 for reinforced clay. From the results of rectangular footing on geogrid-reinforced sand, Yetimoglu et al. (1994) observed that the BCR varied from 1.6 to 1.0 when the u/B changed from 0.3 to 1.2 in single-layer reinforced sand and that the BCR varied from 3.0 to 1.0 when u/B changed from 0.15 to 1.2 in the multilayer reinforced sand. The results of laboratory strip footing tests conducted by Sakti and Das (1994) on geotextile-reinforced clay showed that the most beneficial effect of geotextile reinforcement on the bearing capacity is realized when the first layer is placed at a (u/B) of 0.35 to 0.4 below the footing. These studies suggest that the optimum u/B value depends on the type of footings, type of soils, and type of reinforcement.
Effect of Length of Reinforcement Layers As discussed in the previous section about the strain distribution along the reinforcement, the maximum strain along the reinforcement occurs directly beneath the center of the footing and
Vol. 17 [2012], Bund. F
733
gradually decreases as the distance away from the center of footing increases. Thus the length of reinforcement also can affect the performance of the reinforced soil. A series of finite element analysis on three-layer SWM and SBM reinforced soil was performed with different reinforcement length to further evaluate the effective length of reinforcement, le. The variations of the BCR and the SRF as a function of length of reinforcement layers are presented in Figures 7a and 7b, respectively. The figures show that the BCR reduces and the SRF increases with increase in the length of reinforcement; however, the trend became stable when le was larger than 4B, which is consistent with the finding in the previous section. This finding is also in agreement with the findings of other researchers (e.g., Shin et al. 2002, and Abu-Farsakh et al. 2007a, b). However, different effective lengths of reinforcements were also reported in literature (e.g., Das et al. 1994; Adams and Collin 1997; and Maharaj 2003). Based on the results of a series of smallscale and large-scale model footing tests on reinforced sand and silty clay, Abu-Farsakh et al. (2007a) obtained effective reinforcement length ranges between 4.0B and 6.0B for geogrid reinforced silty clay and about 6.0B for reinforced sand. A similar effective reinforcement length of 4.5B to 5.0B was also suggested by Shin et al. (2002) from laboratory model tests on strip footings with geogrid-reinforced clay. A much lower effective reinforcement length of 2.0B was reported by Adams and Collins (1997) based on large-scale tests on reinforced sand. Maharaj (2003) also reported the same effective reinforcement length of 2.0B through finite element analysis of strip footing sitting on reinforced clay. 1
BCR at s/B=10%
1.6 1.5 1.4 1.3 1.2 1.1 1 3-layer SWM Reinforced Soil, u=0.35, h/B=0.58 3-layer SBM Reinforced Soil, u/B=0.35, h/B=0.58
0.9 0.8 0
1
2
3
4
5
6
Reinforcement Length (B)
(a) Variation of BCR with reinforcement length
7
SRF at P=4048 kPa (700 psi)
1.7
0.95 0.9 0.85 0.8 0.75 0.7 0.65 0.6
3-layer SWM Reinforced Soil, u/B=0.35, h/B=0.58 3-layer SBM Reinforced Soil, u/B=0.35, h/B=0.58
0.55 0.5 0
1
2
3
4
5
6
7
Reinforcement Length (B)
(b) Variation of SRF with reinforcement length
Figure 7: Effect of length of reinforcement layers
Effect of Number/Spacing of Reinforcement Layers A series of finite element analyses were conducted to investigate the effect of number/spacing of reinforcement layers on the soil’s ultimate bearing capacity and footing settlement. All reinforcement layers were placed within the effective reinforcement depth of 1.5B below the strip footing [B = 1.22 m (4 ft)] with the bottom layer kept at a depth of 1.5B. Eight different reinforcement types placed at five different spacings were used in this FE analysis. The following reinforcement layers/spacing configurations were examined: three-layer (u/B = 0.35, h/B = 0.58), four-layer (u/B = 0.35, h/B = 0.38), six-layer (u/B = 0.35, h/B = 0.23), eight-layer (u/B = 0.35, h/B
Vol. 17 [2012], Bund. F
734
= 0.19), and twelve-layer (u/B = 0.35, h/B = 0.10) spacing. The corresponding pressure-settlement curves of SWM reinforcement are shown in Figure 8. Footing Pressure (psi) 0
500
1000
1500
2000
Footing Settlement (B)
0 0.05 0.1 0.15 0.2 unreinforced soil 3-layer reinforced soil, u/B=0.35, h/B=0,58 4-layer reinforced soil, u/B=0.35, h/B=0.38 6-layer reinforced soil, u/B=0.35, h/B=0.23 12-layer reinforced soil, u/B=0.35, h/B=0.10 asso
0.25 0.3 0.35 0
1000
2000
3000
4000
5000
6000
7000
8000
Footing Pressure (kPa)
Figure 8: Typical curves of footing pressure versus footing settlement for SWM For each case, the BCR at s/B =10% and the settlement reduction factor (SRF) at a footing pressure of 4823 kPa (700 psi) were calculated. Figures 9a and 9b depict the relationship between the reinforcement spacing and the BCR and SRF, respectively. For the SWM and SBM reinforcements used, the figures show that at a given settlement, the load carrying capacity of the footing decreases with the increase in reinforcement spacing, with larger decrease rates at small spacing. Besides, the footing settlement at the same load is smaller for closer reinforcement spacing. Therefore, for all reinforcements placed within effective reinforcement depth, smaller reinforcement spacing (i.e. more reinforcement layers) should always be desirable, provided that its cost is justified. Spacing Ratio, h/B
Spacing Ratio, h/B 0
0.1
0.2
0.3
0.4
0.5
0.6
0.7
0
2 1.8
0.2
0.3
0.4
0.5
0.6
0.7
30.6
0.7
0.9
1.6 SRF
BCR at s/B=10%
0.1
1
1.4 1.2
0.8 0.7 SBM Reinforced Soi, u/B=0.35 SWM Reinforced Soil, u/B=0.35
SBM Reinforced Soil, u/B=0.35
1
0.6
SWM Reinforced Soil, u/B=0.35
0.8
0.5 0
12 8 0.2 6 0.3 0.1
40.4
0.5
30.6
Number of Reinforcement Layers (N)
(a) Variation of BCR with reinforcement spacing
0.7
0
12 8 0.2 6 0.3 0.1
40.4
0.5
Number of Reinforcement Layers (N)
(b) Variation of SRF with reinforcement spacing
Figure 9: Effect of number/spacing of reinforcement layers
Vol. 17 [2012], Bund. F
735
Effect of Reinforcement Stiffness Reinforcement stiffness is one of the most important parameters influencing the performance of reinforced soil foundation. To examine this effect on the performance of footing on reinforced crushed limestone, eight different reinforcements with varying stiffness were analyzed from the perspective of increasing the soil’s ultimate bearing capacity and reducing the footing settlement. The properties of these reinforcements were presented in Table 1. Since the different reinforcements used in this study may have different thicknesses and both the soil’s elastic modulus and the reinforcement’s elastic modulus have significant effects on the behavior of the reinforced soil foundation system, the reinforcement stiffness was normalized as follows. Enormal = Jr / (Es*D)
(4)
where Enormal is the normalized stiffness of reinforcement, Jr is the tensile modulus per unit width at 2% strain, Es is the elastic modulus of crushed limestone, and D is the depth of the reinforced zone. A series of finite element analyses were conducted for each reinforcement stiffness using three-layer, six-layer and twelve-layer reinforced crushed limestone with uniform spacing between reinforcement layers. The calculated BCR values at s/B=10% versus the normalized reinforcement’s stiffnesses are presented in Figure 10a; the relationship between the footing’s SRF [at p=4823 kPa (700 psi)] and the normalized reinforcement’s stiffness is presented in Figure 10b. The figures clearly demonstrate that the RSF with stiffer reinforcements has larger bearing capacity and lower settlement than the RSF with weaker reinforcements, regardless of the number of reinforcement layers. The stiffness-related increase in the BCR and decrease in the SRF is more appreciable at low normalized reinforcement’s stiffness, and the effect gradually decreases as the normalized reinforcement’s stiffness exceeds 0.5. For the crushed limestone studied herein, reinforcements with a normalized stiffness ranging from 0.5 to 1 will maximize the benefits of the reinforced soil footing. 1.7
BCR at s/B=10%
1.6 1.5 1.4 1.3 12-layer reinforced soil, u/B=0.35, h/B=0.10 6-layer reinforced soil, u/B=0.35, h/B=0.23 3-layer reinforced soil, u/B=0.35, h/B=0.58
1.2 1.1 1 0
0.5
1
1.5
Normalized Reinforcement Stiffness
(a) BCR versus normalized reinforcements stiffness
2
SRF at p=4823 kPa (700 psi)
1
0.9
0.8
0.7 3-layer reinforced soil, u/B=0.35, h/B=0.58 6-layer reinforced soil, u/B=0.35, h/B=0.23 12-layer reinforced soil, u/B=0.35, h/B=0.10
0.6
0.5 0
0.5
1
1.5
2
Normalized Reinforcement Stiffness
(b) SRF versus normalized reinforcements stiffness
Figure 10: Effect of reinforcement stiffness for the footing overlying multi-layers of SWM reinforcement crushed limestone
Vol. 17 [2012], Bund. F
736
Effect of Footing Embedment Depth It is well known by geotechnical engineers that the embedment depth and width of footing sitting on unreinforced soil have a significant effect on its performance, and these effects are already included in the bearing capacity formulas. However, their influences on reinforced soil foundations are not well understood and will be investigated in this FE study. A footing placed at different embedment depths (Df = 0B, 0.25B, 0.5B, 0.75B, and 1B) on a multi-layer reinforced crushed limestone was analyzed using the FE model presented earlier. The variations of the BCR and the SRF as a function of footing embedment depth are presented in Figures11a and 11b, respectively. The figures show that the BCR reduces and the SRF increases at approximately linear manners with the increase in the embedment depth of the footing. The reduction trend of the BCR with the increase in the embedment depth (Figure 11a) can be attributed to a larger increase in the bearing capacity of the unreinforced soil foundation compared to that of reinforced soil foundation. The figure also shows that the variations of BCR and SRF with embedment ratio were similar for different layers of geogrid, which means that the number of geogrid layers has minimal effect on the trend of variation of BCR and SRF with embedment ratio. 1.6
B C R at s/B =10%
1.5 1.4 1.3 1.2 1.1
3-layer reinforced soil, u/B=0.35, h/B=0.58 6-layer reinforced soil, u/b=0.35, h/B=0.23 12-layer reinforced soil, u/B=0.35, h/B=0.10
1 0.9
SR F at p=4823i (700 psi)
1
0.9
0.8
0.7
3-layer reinforced soil, u/B=0.35, h/B=0.58 6-layer reinforced soil, u/B=0.35, h/B=0.23 12-layer reinforced soil, u/B=0.35, h/B=0.10
0.6
0.5
0.8 0
0.25
0.5
0.75
1
Embedment Ratio (d/B)
(a) BCR versus embedment ratio
0
0.25
0.5
0.75
1
Embedment Ratio (d/B)
(b) SRF versus embedment ratio
Figure 11: Effect of footing embedment depth for footing reinforced with SWM
Effect of Footing Width The effect of the footing’s width (or scale effect) on the performance of reinforced soil foundations was investigated by several researchers (e.g., Das et al., 1994, and Elvidge and Raymond, 2001). In this FE study, the effect of footing width on the BCR and SRF of reinforced soil foundations was investigated through changing the width of strip footing from 0.91m (3 ft) to 1.83 m (6 ft), and the results are presented in Figures 12a and 12b, respectively. The figures show that the bearing capacity ratio (BCR) reduces at approximately a linear manner, and the settlement reduction factor (SRF) increases with the increase in footing width. This result is similar to the findings of Das and Omar (1994) and Elvidge and Raymond (2001), which is that
Vol. 17 [2012], Bund. F
737
the increase in footing width resulted in a decrease in the BCR. Again, this trend is due to a larger increase in the bearing capacity of unreinforced soil foundation as compared to that of reinforced soil foundation brought up by the increase in the footing’s width. The increase in SRF is also attributed to more reduction in settlement with an increase in footing width, for unreinforced soil as compared to reinforced soil. B (m) 1.1096
B (m) 1.6096
2.1096
1.8
B C R at s/B = 10%
1.7 1.6 1.5 1.4 1.3 1.2 1.1
3-layer reinforced soil, u/B=0.35, h/B=0.58 6-layer reinforced soil, u/B=0.35, h/B=0.23 12-layer reinforced soil, u/B=0.35, h/B=0.10 asso
1 0.9 0.8 2
3
4
5
6
B (ft)
(a) BCR versus footing width
7
0.6096
S R F at p =4479 kP a (650 p si)
0.6096
1.1096
1.6096
2.1096
1 0.9 0.8 0.7 0.6
3-layer reinforced soil, u/B=0.35, h/B=0.58 6-layer reinforced soil, u/B=0.35,h/B=0.23 12-layer reinforced soil, u/B=0.35, h/B=0.10
0.5 0.4 2
3
4
5
6
7
B (ft)
(b) SRF versus footing width
Figure 12: Effect of footing embedment width for footing reinforced with SWM
STATISTICAL REGRESSION ANALYSIS As demonstrated by the finite element analyses, the behavior of a strip footing sitting on reinforced crushed limestone depends on many factors including the reinforcement spacing, reinforcement stiffness, footing embedment depth, and footing width. The effect of all these factors needs to be incorporated into a rational design method for reinforced foil foundation. In order to include the effect of crushed limestone properties in the design method, additional finite element analyses were conducted using friction angles of φ = 48o, 50o, and 52o and elastic modulus of Es = 100, 120, and 140 MPa on several cases of reinforced crushed limestone underlying by unreinforced embankment soil. Based on the database generated by FE parametric study, a multi-regression statistical analysis was conducted to develop a simple BCR model for use by geotechnical engineers in design of strip footings on reinforced crushed limestone over embankment soil in approach slab application. In developing the BCR model, all the reinforcement layers were assumed to lie within the effective reinforced depth and have enough length to fully mobilize its tensile contribution. The full model described in Eq. 5 that includes the effects of all variables and their interactions was first analyzed. BCR = β0 + β1*X1 + β2*X2 + β3*X3 + β4*X4 + β5*X5 + β6X6 + β7X1*X2 + β8*X1X3 + β9*X1X4 + β10*X1X5 + β11*X1X6 + β12*X2X3 + β13*X2X4 + β14*X2X5 + β15*X2X6 + β16*X3X4 + β17*X3X5 + β18*X3X6 + β19*X4X5 + β20*X4X6 + β21*X5X6
(5)
Vol. 17 [2012], Bund. F
738
where, BCR is the ultimate bearing capacity ratio of the reinforced soil (at s/B = 10%), X1 is the spacing ratio between reinforcement layers (h/B), X2 is the normalized stiffness of reinforcement [Jr / (Es*D)], X3 is the footing embedment ratio (d/B), X4 is the footing width ratio (B/4 ft), X5 is the normalized friction angle of soil (φ /48), and X6 is the normalized elastic modulus of soil (E/120 MPa). A stepwise variable selection procedure was then performed on the general model shown in Equation 5 to remove insignificant variables from the general model. The statistical variable selection procedure showed that no interaction between these variables is significant and that reinforcement spacing, reinforcement stiffness, footing embedment, and footing width are the statistically significant variables for the BCR at the 95% confidence level. The multiple regression analysis was then conducted on the reduced model, and the results yielded the model shown in Equation 6: BCR = 3.17874 - 0.41281*X1 + 0.07947*X2 - 0.21817*X3 - 0.37297*X4 - 1.65633*X5 + 0.41759*X6
(R2 = 0.95)
(6)
The relative importance of each independent variable on the BCR was assessed by comparing t values. Index |t| is a t-statistical parameter, which is used for evaluating the statistical significance of design parameters; the higher the value is, the more significant the parameter is. The results of t value comparison show that the spacing between reinforcement ratio (|t| =16.84) has the most significant effect on the increase of bearing capacity among all variables. The stiffness of reinforcement (|t| =5.14) has the weakest effect on the increase of bearing capacity among all variables. It is worth noting that there is a tradeoff between increasing reinforcement stiffness and reducing reinforcement spacing. However, based on the results of this study, the authors believe that decreasing spacing is better than increasing stiffness as far as reinforcement spacing is kept within acceptable design range [i.e., 152 mm (6 in.) ≤ h ≤ 457 mm (18 in.)] and provided that its cost is justified. The BCR regression model in Equation 6 was verified by comparing the results of the regression model with the results of finite element analysis determined for 40 new reinforced cases of different configurations. The results of the comparison are presented in Figure 13. The absolute errors range from 0.12% to 3.14%, which suggests that the BCR values predicted by the regression model in Equation 6 have good accuracy.
Vol. 17 [2012], Bund. F
739
1.8
BCR from Regression Model
1.7 1.6 1.5 1.4 1.3 1.2 1.1 1.0 1.0
1.1
1.2
1.3
1.4
1.5
1.6
1.7
1.8
BCR from FE Analysis
Figure 13: Comparison between BCR obtained from regression model and FE analysis
DISCUSSIONS In this paper, the parameters that affect the performance of footings on reinforced crushed limestone were extensively studied using FEM in this paper. The findings from FEM analyses expected to provide useful guidelines for geotechnical engineers in selecting appropriate values of design parameters. However, it should be pointed out that the findings from this study are only valid for strip footings placed on reinforced crushed limestone aggregate over embankment soil. This is because the parameters, such as optimum depth of the first reinforcement layer (u) and the effective length of the reinforcement (le), depend on the type of footings, type of soils, and type of reinforcement. The results of model tests conducted by Abu-Farsakh et al. (2007a) on different type of soils clearly demonstrated this dependency. This point has also been pointed out and discussed in detail by Yetimoglu (1994) and Abu-Farsakh et al. (2007b). Therefore, more studies on the influence of soil type and footing type, which were not covered in this FEM study, are highly desired in developing a rational and reliable design methodology for footings on reinforced crushed limestone. The FEM analyses were validated using small-scale laboratory tests and then used to analyze full-scale strip footing on reinforced crushed limestone over embankment soil. The results showed that the BCR decreases with the increase in footing width. This is in agreement with other research studies (Das et al., 1994; and Elvidge and Raymond, 2001). However, full-scale or/and field tests are highly recommended to further verify the findings from this study.
CONCLUSIONS Based on the results of finite element and regression analyses of a strip footing sitting on a reinforced crushed limestone zone of depth D =1.5B underlying by embankment soil, the following conclusions can be drawn: •
The effective length of reinforcement layers for full mobilization in reinforced crushed limestone was found to be equal to 4.0B, where B is the footing width.
Vol. 17 [2012], Bund. F
740
•
The inclusion of reinforcement layers reduces the magnitude of vertical stress through redistributing the load applied on the footing onto a wider range, thus helping reduce the consolidation settlement of the soil underneath the reinforced crushed limestone zone.
•
The optimum location of the top reinforcement layer was found to be equal to 0.35B for a single-layer reinforcement system and 0.3B for a multi-layer reinforcement system.
•
The bearing capacity ratio (BCR) of the reinforced crushed limestone decreases and settlement reduction factor (SRF) increases with the increase in reinforcement spacing..
•
The BCR of the crushed limestone increases and SRF decreases with the increase in the reinforcement stiffness. The stiffness-related increase is more remarkable at normalized reinforcement stiffness of less than 0.5.
•
The increase in footing embedment depth and/or footing width improves the ultimate bearing capacity of the unreinforced soil more than that of the reinforced soil, resulting in a decrease in the BCR and an increase in the SRF.
•
A regression model was developed for BCR of reinforced crushed limestone based on the results of FE analysis. The verification showed that the model can be used to estimate BCR with good accuracy.
ACKNOWLEDGMENTS This research is funded by the Louisiana Transportation Research Center (LTRC Project No. 04-2GT) and Louisiana Department of Transportation and Development (State Project No. 73699-1242). The authors would like to express their thanks to Mark Morvant and Zhongjie Zhang from LTRC for providing valuable help and support in this study.
REFERENCES 1. Abu-Farsakh, M. Y., Q. Chen, and S. Yoon (2007a) “Use of Reinforced Soil Foundation (RSF) to Support Shallow Foundation,” Report No. FHWA/LA.04/423, Louisiana Transportation Research Center, Baton Rouge, LA, 195 p. 2. Abu-Farsakh, M. Y., J. Gu, G.Z. Voyiadjis, and M. Tao (2007b) “Numerical Parametric Study of Strip Footing on Reinforced Embankment Soil,” Journal of the Transportation Research Board, No. 2004, Soil Mechanics, pp. 132 - 140. 3. Adams, M. T., and J.G. Collin (1997) “Large model spread footing load tests on geosynthetic reinforced soil foundations,” Journal of Geotechnical and Geoenvironmental Engineering, ASCE, Vol. 123, No.1, pp. 66-72. 4. Binquet, J., and K.L. Lee (1975) “Bearing capacity tests on reinforced earth slabs.” Journal of Geotechnical Engineering Division, ASCE, Vol. 101, No.GT12, pp. 12411255. 5. Cai, C.S., G.Z. Voyiadjis, and X. Shi (2005) Determination of interaction between bridge concrete approach slab and embankment settlement, Final Report, Louisiana
Vol. 17 [2012], Bund. F
741
Transportation Research Center (LTRC), Louisiana Department of Transportation and Development (LADOTD), Baton Rouge, LA, Report No. FHWA/LA. 05/403, 150p. 6. Chadbourne, W. (1994) “An investigation into the performance of shallow spread footings in reinforced cohesionless soil,” MS thesis, Tufts Univ., Medford, Mass. 7. Chen, Q., M. Abu-Farsakh, and R. Sharma (2009) “Experimental and analytical studies of reinforced crushed limestone.” Geotextiles and Geomembranes, Vol. 27, No. 5, pp. 357-367. 8. Das, B. M., E.C. Shin, and M.T. Omar (1994) “The bearing capacity of surface strip foundations on geogrid reinforced sand and clay – a comparative study,” Geotechnical and Geological Engineering, Vol. 12, No. 1, pp. 1-14. 9. Elvidge, C., and G. Raymond (2001) “Maximized bearing capacity from a single geosynthetic reinforcement layer.” Proceedings of the 54th Canadian Geotechnical Conference, Calgary, Alberta, pp. 475-480. 10. Espinoza, R., and J. Bray (1995) “An integrated approach to evaluating single layer reinforced soils,” Geosynthetics Int., Vol. 2, No. 4, pp. 723-739. 11. Guido, V., J. Knueppel, and M. Sweeny (1986) “Plate load tests on geogridreinforced earth slabs,” Proc., of Geosynthetics ’87, IFAI, St. Paul, Minn., pp. 216225. 12. Hibbitt, Karlson, and Sorensen (2002) ABAQUS Standard User’s Manuals, Version 6.3-1, Pawtucket, RI, USA. 13. Latha, G.M., and A. Somwanshi (2009) “Effect of reinforcement form on the bearing capacity of square footings on sand.” Geotextiles and Geomembranes, Vol. 27, No. 6, pp. 409-422. 14. Lee, K.M., and V.R. Manjunath (2000) “Experimental and numerical studies of geosynthetics-reinforced sand slopes loaded with a footing,” Canadian Geotechnical Journal, Vol. 37, pp. 828-842. 15. Maharaj D. K. (2003) “Nonlinear finite element analysis of strip footing on reinforced clay,” The Electronic Journal of Geotechnical Engineering, pp. 15. 16. Mandal, J. N., and H.S. Sah (1992). “Bearing capacity tests on geogrid-reinforced clay.” Geotextiles and Geomembranes, Vol. 11, No. 3, pp. 327-333. 17. Milligan, G., and J. Love (1984) “Model testing of geogrids under an aggregate layer in soft ground,” Proc., Symposium on Polymer Grid Reinforcement in Civil Engineering, ICL, London, England, pp. 4.2.1-4.2.11. 18. Nazzal, M. (2007) “Laboratory characterization and numerical modeling of geogrid reinforced bases in flexible pavements.” Ph.D. dissertation, Louisiana State
Vol. 17 [2012], Bund. F
742
University, Baton Rouge, USA. 19. Omar, M., B.M. Das, V. Puri, S. Yen, and E. Cook (1994) “Bearing capacity of foundations on geogrid-reinforced sand,” Proc., XII Int. Conf. on Soil Mech. and Found. Engrg., Vol. 3, A. A. Balkema, Rotterdam, The Netherlands, pp. 1279-1282. 20. Sadoglu, E., E. Cure, B. Moroglu, and B.A. Uzuner (2009) “Ultimate loads for eccentrically loaded model shallow strip footings on geotextile-reinforced sand.” Geotextiles and Geomembranes, Vol., 27, No. 3, pp. 176-182. 21. Sakti J. P. and B.M. Das (1994) “Model Tests for Strip Foundation on Clay Reinforced with Geotextile Layers,” Transportation Research Record, pp.40-45. 22. Shin, E. C., B.M. Das, E.S. Lee, and C. Atalar (2002) “Bearing capacity of strip foundation on geogrid-reinforced sand,” Geotechnical and Geological Engineering, Vol. 20, pp. 169-180. 23. Singh, H. (1988) Bearing capacity of reinforced soil beds. Ph.D. dissertation, Indian Institute of Science, Bangalore, India. 24. Yetimoglu, T., J.T. Wu, and A. Saglamer (1994) “Bearing capacity of rectangular footings on geogrid-reinforced sand,” Journal of Geotechnical Engineering, ASCE, Vol. 120, No.12, pp. 2083-2099. 25. Yoo, C. (2001) “Laboratory investigation of bearing capacity behavior of strip footing on geogrid-reinforced sand slope,” Geotextiles and Geomembranes, Vol. 19, No. 5, pp. 279-298.
© 2012 ejge