FIR Cutoff Frequency Calculating for ECG Signal Noise Removing Using Artificial Neural Network Sara Moein Computer Engineering Department, Islamic Azad University of Najafabad Branch, Najafabad, Esfahan, Iran
[email protected]
Abstract. In this paper, an automated approach for electrocardiogram (ECG) signal noise removing using artificial neural network is investigated. First, 150 of noisy heart signal are collected form MIT-BIH database. Then signals are transformed to frequency domain and cutoff frequency is calculated. Since heart signals are lowpass frequency, a Finite Impulse Response (FIR) filter is adequate to remove the noise. In the next step, a dataset is configured for a multilayer perceptron (MLP) training with feedforward algorithm. Finally, the MLP is trained and results of cutoff frequency calculation are shown. Keywords: Finite Impulse Response (FIR), Cutoff frequency, Dataset, Multilayer Percecptron.
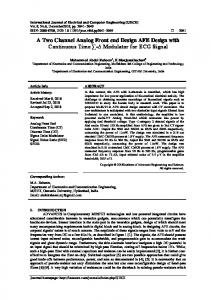
1 Introduction Electrical activity of heart can be presented by electrocardiogram (ECG). ECG contains information about heart rate, rhythm of heart beating and other points. Each ECG signal of a normal heartbeat consists of a three parts: P wave, QRS complex and T wave. Fig. 1 depicts the PQRST shape of ECG signal. The P wave reflects the activation of the right and left atria. The QRS complex shows depolarization of the right and left ventricles. The T wave, that is after QRS complex reflects ventricular activation [1]. Experienced physicians are able to make an informed medical diagnosis on the heart condition by observing the ECG signals. However, the presence of artifacts and noise within the signal may influence the diagnosis. Artifacts and noise are generated by biological and environmental recourses. Mechanical movement of electrodes and power line interferences causes ECG artifact [2]. Noise, on the other hand, can come from various sources, such as intrinsic noise from the recorder and noise from the electrode-skin contact [3]. Y. Tan, Y. Shi, and K.C. Tan (Eds.): ICSI 2010, Part II, LNCS 6146, pp. 124–131, 2010. © Springer-Verlag Berlin Heidelberg 2010
FIR Cutoff Frequency Calculating for ECG Signal Noise Removing Using ANN
125
Fig. 1. ECG signal from a normal human
2 Literature Review Nowadays many researchers work on signal noise removing [4], [5], [6], [7], [9]. Hyun D.K et al. [5] grouped various noised signals into six categories by context estimation, and effectively reconfigured noise reduction filter by neural network and genetic algorithm (GA). Neural network based control module effectively select optimal filter block by noise context based clustering at running mode and filtering performance was improved by GA at evolution mode. Manash S. [4] et al. Designed and applied a notch filter to the ECG signal containing power line noise. Complete design is performed with FDA tool in the Matlab. The equiripple notch filter designed is having higher order due to which increase in the computational complexity observed. In another study, Moein, S. [8] used Kalman filter for ECG signal noise removing. In her study author used neural network for calculating Kalman filter parameters and results show that neural network can be applied for noise removing using Kalman filter. Considering previous researches, this paper is an attempt to apply artificial neural network to gain the cutoff frequency for FIR filter. In other words, this study mainly focuses on intelligent cutoff frequency calculating.
3 FIR Filter Given a finite duration of nonzero input values, the effect is that an FIR filter will always have a finite duration of nonzero output values, and that is how FIR filters got their name. FIR filters were selected over IIR as they are stable and the effect of finite word length on the specified frequency or time domain response of the output noise is smaller than that for Infinite Impulse Response (IIR) filters [10], [11].
126
S. Moein
The ideal lowpass filter is one that allows through all frequency components of a
signal below a designated cutoff frequency ωc , and rejects all frequency components of a signal above ωc .
4 Methodology 4.1 Database Physiobank is a complete collection of heart signals of normal and patient human. In this research, 150 of noisy ECG signals are collected form three databases. MIT-BIH Arrhythmia Database that is collection of 48 fully annotated half-hour two-lead ECGs, MIT-BIH Normal Sinus Rhythm Database that includes 18 long-term ECG recordings of subjects referred to the Arrhythmia Laboratory at Boston's Beth Israel Hospital and MIT-BIH Supraventricular Arrhythmia Database that includes 78 halfhour ECG recordings chosen to supplement the examples of supraventricular arrhythmias in the MIT-BIH Arrhythmia Database [8]. All natural signals are corrupted by noises and artifacts caused by some recourses. To remove the noise of ECG signals FIR is an adequate filter. Cutoff frequency and order of FIR filter are two effective variables to design the filter. Here the objective is to find out the cutoff frequency using neural network. 4.2 Frequency Domain Considering the noise interference in ECG signals, all 150 Signals must be transformed to frequency domain using Fast Fourier Transform (FFT). Fig. 2 and 3 show examples of noisy signals and Fourier transform. 4.3 Dataset Configuration By transforming signals to frequency domain, to configure the dataset, statistical attributes of each signal in frequency domain are extracted. The attributes are standard deviation, variance etc. Standard deviation based on definition is as below (1):
σ =
N −1
∑
n=0
Where N is number of samples,
1 ( xn − μ ) 2 N
(1)
x n is data sample and μ is the mean. σ is the stan-
dard deviation. Using Matlab software, features are extracted from Fourier transform of each signal and results are collected in a dataset. Table 1 is part of dataset. Since the proposed method is based on a supervised learning for neural network, therefore it is necessary to calculate a target for each record of data in a dataset. The target is the value of
FIR Cutoff Frequency Calculating for ECG Signal Noise Removing Using ANN
127
cutoff frequency that can be calculated using frequency spectrum. Then the frequency must be normalized (2).
ω = 2 Where
ωc fs
f s is the sampling frequency.
(a)
(b) Fig. 2. Arrhythmia ECG signal a) noisy signal b) Frequency spectrum
(a)
(b) Fig. 3. Arrhythmia ECG signal a) noisy signal b) Frequency spectrum
(2)
128
S. Moein Table 1. Part of provided dataset
Signal
Mean FFT
Variance FFT
Standard Deviation
1
Arrhythmia
0.3303
107.4256
10.3646
0.33
2
Arrhythmia
0.2076
69.0750
8.3111
0.80
3
Arrhythmia
0.1390
122.1468
11.0520
0.80
4
Arrhythmia
0.3211
144.7610
12.0317
0.33
5
Arrhythmia
0.1124
113.5184
10.6545
0.22
6
superventricular
0.0595
47.3639
6.8821
0.22
7
superventricular
0.3818
186.4406
13.6543
0.33
8
Normal ECG
0.5862
331.1704
18.1981
0.33
9
Normal ECG
0.4293
1.2263e+003
35.0192
0.44
10
superventricular
0.5550
268.9242
16.3989
0.33
11
superventricular
0.0579
104.3169
10.2136
0.60
12
superventricular
0.6750
89.7411
9.4732
0.60
13
superventricular
0.0585
43.8329
6.6206
0.44
14
Arrhythmia
0.1148
222.9100
14.9302
0.44
15
Arrhythmia
0.0121
23.7992
4.8784
0.33
16
Normal ECG
0.0596
19.6352
4.4312
0.60
17
Normal ECG
0.1812
45.8616
6.7721
0.80
18
Normal ECG
0.2852
380.5688
19.5082
0.60
No.
c
Table 2 shows assigning a label to each ω c . It shows that the configured dataset consists of 6 classes. Table 2. Assigning a label to classes of cutoff frequency
Cutoff frequency 0.11 0.22 0.33 0.60 0.80 0.44
ωc
Label 0 1 2 3 4 5
FIR Cutoff Frequency Calculating for ECG Signal Noise Removing Using ANN
129
4.4 MLP Training Multilayer Perceptron (MLP) is an efficient neural network for classification problems and it has a considerable performance [7]. There are different issues involved in training the MLP network: • • • •
Number of hidden layer Number of nodes in hidden layer Converging to an optimal solution in a reasonable period of time Testing neural network for overfitting
The MLP with 3 nodes in input layer and 1 node in output layer is trained. 130 numbers of records of dataset will train the neural network and 20 records are used to test
Fig. 4. Effect of training cycle on performance of MSE Table 3. Comparison of real cutoff frequencies and calculated cutoff frequencies with MLP Test samples 1 2 3 4 5 6 7 8 9 10 11 12 13 14 15 16 17 18 19 20
Real cutoff frequency 1 2 3 2 0 4 0 2 5 4 1 3 1 2 2 2 5 0 0 4
Calculated cutoff with MLP 0.9809 2.2266 3.1637 1.9983 -0.0096 3.9686 0.3014 1.8595 5.1061 3.8616 1.0598 3.1343 1.3403 2.2266 2.0731 2.2780 4.9221 -0.0104 -0.0106 4.0107
130
S. Moein
Fig. 5. Error of MLP in calculating the cutoff frequency
the trained network. Number of nodes in hidden layer and number of training cycle are variable in different tests to gain the considerable performance. Fig. 4 shows the effect of variable training cycle on Mean Square Error (MSE) performance function of network. Where there are 10 nodes in hidden layer. It shows that the better performance occur with 300 and 700 training cycles. Table 3 shows results of MLP training with 10 nodes in hidden layer and 700 training cycles. First column shows the real cutoff frequencies and calculated cutoff frequencies are shown in second column. Fig. 5 presents the error of network. Using the calculated cutoff frequency and determining the order of FIR filter, the required parameters are prepared and noise removing can be done.
5 Conclusion Results show that neural network has the ability to be applied for solving problems of signal processing. It has good performance for calculating cutoff frequency and observing figures and tables shows that the error of network is less than 0.5. It proves that the performance is more than 90%. Therefore, it is true to claim that noise removing can be developed toward automatic solution using neural network. For future works, applying recurrent and unsupervised neural networks can improve the presented method.
References 1. Sornmo, L., Laguna, P.: Bioelectrical Signal Processing in Cardiac and Neurological Applications. Elsevier, Amsterdam (2005) 2. Medical Device Safety Reports, http://www.mdsr.ecri.org/ 3. Behbahani, S.C.: Investigation of Adaptive Filtering for Noise Cancellation in ECG signals. In: Second International Multi-Symposiums on Computer and Computational Sciences (2007)
FIR Cutoff Frequency Calculating for ECG Signal Noise Removing Using ANN
131
4. Mahesh, S., Agarvala, A., Uplane, M.: Design and implementation of digital FIR equiripple notch filter on ECG signal for removal of power line interference. J. WSEAS Transactions on Signal Processing 4, 221–230 (2008) 5. Hyun, D.K., Chul, H.M., Tae, S.K.: Advances in Neural Networks: Adaptable Noise Reduction of ECG Signals for Feature Extraction. Springer, Heidelberg (2006) 6. Moein, S.: Hepatitis Diagnosis by Training A MLP Artificial Neural Network. In: Worldcomp 2008 Conference, Las Vegas, USA (2008) 7. Moein, S.T.: Advances in Computational Biology: A MLP Neural Network for ECG Noise Removal Based on Kalman Filter. In: Arabnia, H.R. (ed.). Springer, Heidelberg (2010) (accepted in publish stage) 8. Archive of ECG signals, http://www.physionet.org/physiobank/database/PTB 9. Karimi-Ghartemani, K., Ziarani, A.C.: A nonlinear time frequency analysis method. IEEE Trans. Signal Process, 1585–1595 (2004) 10. Lian, Y., Hoo, P.J.: WSEAS Transactions on Electronics: Digital elliptic filter application for noise reduction in ECG signal 3, 65–70 (2006) 11. Sornmo, L.: Time-varying digital filtering of ECG baseline wander. J. Med. Biol. Eng. Comput. 31, 503–508 (1993)