Fixed Cost Pooling Strategies based on IR Evaluation Measures 1
1
1
1,
2
1
Aldo Lipani , Joao Palotti , Mihai Lupu , Florina Piroi Guido Zuccon & Allan Hanbury 1) Institute of Software Technology & Interactive Systems Vienna University of Technology, Austria 2) Faculty of Science & Technology Queensland University of Technology, Brisbane, Australia
[email protected] Aberdeen, Scotland 12/04/2017
@ald
i n a olip
To build an IR test collection with a fixed cost, are IR evaluation measures based-pooling strategies better than the fixed-depth pooling strategy in terms of pool bias?
2
To build an IR test collection with a fixed cost, are IR evaluation measures based-pooling strategies better than the fixed-depth pooling strategy in terms of pool bias?
3
What is the Pool Bias?
4
What is the Pool Bias?
4
What is the Pool Bias?
4
What is the Pool Bias?
I B 4
S A
D E
What is the Pool Bias?
I B 4
S A
D E
It is the effect that documents that were not selected in the pool created from the original runs will never be considered relevant
IR Evaluation Measures
5
IR Evaluation Measures
f(
5
)
>
f(
)
IR Evaluation Measures
f(
5
🤣
😂 😆 😄 😃 )😀 ☺ 😊 🙂 😉 😌 😏
>
f(
🤣
😂 😆 😄 😃 )😀 ☺ 😊 🙂 😉 😌 😏
IR Evaluation Measures
f(
5
🤣
😂 😆 😄 😃 )😀 ☺ 😊 🙂 😉 😌 😏
🤣
🤣 😂 😆 😃 😏 😅 😕 ☹ 😒 😭 😤
>
f(
🤣
😂 😆 😄 😃 )😀 ☺ 😊 🙂 😉 😌 😏
🤣
🤣 😂 😆 😃 😏 😅 😕 ☹ 😒 😭 😤
IR Evaluation Measures
f(
5
🤣
😂 😆 😄 😃 )😀 ☺ 😊 🙂 😉 😌 😏
🤣
🤣 😂 😆 😃 😏 😅 😕 ☹ 😒 😭 😤
🤣
🤣 🤣 🤣 🤣 😡 😡 😡 😡 😡 😡 😡
>
f(
🤣
😂 😆 😄 😃 )😀 ☺ 😊 🙂 😉 😌 😏
🤣
🤣 😂 😆 😃 😏 😅 😕 ☹ 😒 😭 😤
🤣
🤣 🤣 🤣 🤣 😡 😡 😡 😡 😡 😡 😡
IR Evaluation Measures Based-Strategy
The 6 tested pooling strategies are: 4 Non-Adaptive: • DCGTake@N • PPTake@N • RRFTake@N • RBPATake@N
2 Adaptive: • RBPBTake@N • RBPCTake@N 6
Non-Adaptive Strategies
7
Non-Adaptive Strategies DCGTake@N based on DCG gain function: M(d, Rp ) =
X
r2Rp :d2r
7
DCG(⇢(d, r)) =
X
r2Rp :d2r
1 log2 (⇢(d, r) + 1)
Non-Adaptive Strategies DCGTake@N based on DCG gain function: M(d, Rp ) =
X
DCG(⇢(d, r)) =
r2Rp :d2r
RRFTake@N based on RR gain function:
7
X
r2Rp :d2r
1 log2 (⇢(d, r) + 1)
Non-Adaptive Strategies DCGTake@N based on DCG gain function: M(d, Rp ) =
X
DCG(⇢(d, r)) =
r2Rp :d2r
X
r2Rp :d2r
1 log2 (⇢(d, r) + 1)
RRFTake@N based on RR gain function:
PPTake@N based on MAP and Q-Measure like gain function:
7
Non-Adaptive Strategies DCGTake@N based on DCG gain function: M(d, Rp ) =
X
DCG(⇢(d, r)) =
r2Rp :d2r
X
r2Rp :d2r
1 log2 (⇢(d, r) + 1)
RRFTake@N based on RR gain function:
PPTake@N based on MAP and Q-Measure like gain function:
RBPATake@N based on RBP gain function:
7
Adaptive Strategies
8
Adaptive Strategies RBPBTake@N based on RBP gain and residual functions:
8
Adaptive Strategies RBPBTake@N based on RBP gain and residual functions:
8
Adaptive Strategies RBPBTake@N based on RBP gain and residual functions:
RBPCTake@N based on RBP gain, residual and base functions:
8
Adaptive Strategies RBPBTake@N based on RBP gain and residual functions:
RBPCTake@N based on RBP gain, residual and base functions:
Issues with the operationality of adaptive pooling strategies:
8
Adaptive Strategies RBPBTake@N based on RBP gain and residual functions:
RBPCTake@N based on RBP gain, residual and base functions:
Issues with the operationality of adaptive pooling strategies: 1. non agreeable
8
Adaptive Strategies RBPBTake@N based on RBP gain and residual functions:
RBPCTake@N based on RBP gain, residual and base functions:
Issues with the operationality of adaptive pooling strategies: 1. non agreeable 2. non ordinable
8
Adaptive Strategies RBPBTake@N based on RBP gain and residual functions:
RBPCTake@N based on RBP gain, residual and base functions:
Issues with the operationality of adaptive pooling strategies: 1. non agreeable 2. non ordinable 3. non parallelizable 8
Experimental Setup
9
Experimental Setup Test Collections Ad Hoc 2-8 Web 9, Web 2001, Robust 2005 Genomics 2005
9
Experimental Setup Domains Test Collections News Ad Hoc 2-8 Web Web 9, Web 2001, Robust 2005 Genomics Genomics 2005
9
Experimental Setup Domains Test Collections News Ad Hoc 2-8 Web Web 9, Web 2001, Robust 2005 Genomics Genomics 2005
We compared Take@N (baseline)
9
Experimental Setup Domains Test Collections News Ad Hoc 2-8 Web Web 9, Web 2001, Robust 2005 Genomics Genomics 2005
We compared Take@N (baseline)
9
Against 4 Non Adaptive Based 2 Adaptive Based
Experimental Setup Domains Test Collections News Ad Hoc 2-8 Web Web 9, Web 2001, Robust 2005 Genomics Genomics 2005
We compared Take@N (baseline) IR Evaluation Measures P@100 MAP NDCG 9
Against 4 Non Adaptive Based 2 Adaptive Based
Experimental Setup Domains Test Collections News Ad Hoc 2-8 Web Web 9, Web 2001, Robust 2005 Genomics Genomics 2005
We compared Take@N (baseline)
Against 4 Non Adaptive Based 2 Adaptive Based
IR Evaluation Measures
Bias Error Measures
P@100 MAP NDCG 9
MAE Mean Absolute Error SRE System Rank Error SRE* SRE with Statistical Significance
Conclusion & Future works
10
Conclusion & Future works The experimental results show that:
10
Conclusion & Future works The experimental results show that: • given a large budget, the Take@N strategy is guaranteed to be the least biased and therefore should be used;
10
Conclusion & Future works The experimental results show that: • given a large budget, the Take@N strategy is guaranteed to be the least biased and therefore should be used; • given a small budget, with which only very few documents can be assessed, then we should operationalise RBPCTake@N
10
Conclusion & Future works The experimental results show that: • given a large budget, the Take@N strategy is guaranteed to be the least biased and therefore should be used; • given a small budget, with which only very few documents can be assessed, then we should operationalise RBPCTake@N • given a moderate budget and if the cannot operationalise RBPC, the nonadaptive strategies do not underperform Take@N, but neither do they consistently improve
10
Conclusion & Future works The experimental results show that: • given a large budget, the Take@N strategy is guaranteed to be the least biased and therefore should be used; • given a small budget, with which only very few documents can be assessed, then we should operationalise RBPCTake@N • given a moderate budget and if the cannot operationalise RBPC, the nonadaptive strategies do not underperform Take@N, but neither do they consistently improve • P@100: all the non-adaptive outperform Take@N
10
Conclusion & Future works The experimental results show that: • given a large budget, the Take@N strategy is guaranteed to be the least biased and therefore should be used; • given a small budget, with which only very few documents can be assessed, then we should operationalise RBPCTake@N • given a moderate budget and if the cannot operationalise RBPC, the nonadaptive strategies do not underperform Take@N, but neither do they consistently improve • P@100: all the non-adaptive outperform Take@N We are planning to compare these pooling strategies with fusion methods-based pooling strategies [Lipani et al., SAC 2017], and multi-armed bandit-based pooling strategies [Losada et al., SAC 2016]
10
Fixed-Cost Pooling Strategies Based on IR Evaluation Measures MAP MAP
NDCG NDCG
P@100 P@100 DCG RBPA RBPA RBPC RBPC DCG PP PP
0.020.02
MAE
Lipani, 1Joao Palotti, 1Mihai Lupu, 2Guido Zuccon, 1Florina Piroi, 1Allan Hanbury University of Technology, 2Queensland University of Technology 0.000.00
1Vienna
Abstract
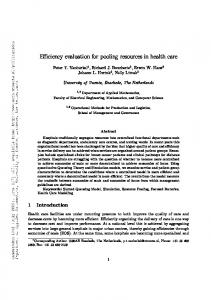
Results To measure the bias that a new run would have observed if it had not been part of the -0.02 -0.02 construction of the pool, we simulate its absence performing a leave-oneorganization-out approach. The bias measures used are:
0 1)0 Mean Absolute Error (MAE);
2) System Rank Error (SRE), and;
3) System Rank Error with Statistical Significance (SRE*). We tested it on 11 test collections:
Ad Hoc 2-8, Web 9, Web 2001-2002, Genomics 2005, Robust 2005. -200-200
The Pooling Method & The Pool Bias
Ad Hoc Ad Hoc 28 Test Collection Ad Hoc 3 for SRE*
The pooling method in a comic strip…
5.0
MAP2
2.5
20
What is pool bias?
-2
0.02
-6
0
0
D
2.5 0.0
7.5 5.0
-2.5
RBPA
RBPC
PP
RBPB
RRF
Genomics 2005 40 30
25 Ad Hoc 2
20
0
Ad Ad Hoc Hoc 32
10
Ad Ad Ad Hoc Hoc Hoc 342 2 Ad Ad Hoc 3 23 Ad Hoc AdHoc Hoc4 5.0 5.0 5.0 0 2 2 22 2 2.5 2.5 2.5 2.5 2.5 2.5 2.5 2.5 -1030000 10000 20000 30000 40000 10000 20000 40000 10000 20000 30000 40000 0 10000 20000 30000 40000 10000 20000 30000 40000 10000 20000 30000 40000 0 0 00 0.0 0.0 0.0 0.0 0.0 0.0 0.0 Robust 2005 Web 2001 Web 2002 0.0 -2 -2 -2-2 -2 -2.5 -2.5 -2.5 -2.5 0 -2.5 40 -2.5 -2.5 -2.5 -4 -4 -4-4 -4 -5.0 -5.0 -5.0 -5.0
Ad Ad Hoc AdHoc Hoc4
-255.0
Pool Pool SizeSize
-5.0 The Rest of the Test Collections for NDCG & SRE* 30 10
-6 -5.0 -6 to -5.0 -6-6in in -5.0 -6 -5.0 Figure Pool measured with respect T ake@N strategy terms of MAE, Figure 3. Pool biasbias measured with respect to T ake@N strategy terms of MAE, -7.5 3. -7.5 -7.5 -7.5 -7.5 2.5 20 Genomics Ad 52 the Ad Ad Hoc Hoc 753 2 on on Ad Ad Hoc Hoc 7543test Genomics Ad Ad Hoc 2005 7for 5 Ad Hoc20 Ad Hoc Ad Hoc 47 Ad Hoc SRE, SRE* for pooling strategies Hoc collection, di↵erent Genomics SRE, andand SRE* forHoc the pooling strategies thethe AdAd Hoc 82005 collection, for di↵erent Ad Hoc 5 8 test AdHoc Hoc Genomics -100 0.0 40 40 40 5.0 5.0 40 40(i.e. 40 10relevance 40 pool sizes (i.e. number of05040documents that require relevance judgement). pool sizes number of documents that require judgement). 5040 5050 50 2 2
SRE
BI
E AS
5.0
Ad Hoc 7 50
-50 -50 -0.02
DCG
-5.0
Ad Hoc 5
0.00
0 -20
-2.5
-4
SRE*
40
0.0
50 50
-5.0 -7.5
P@100
2.5
MAE SRE*
-2.5 -5.0
IR Evaluation Measures Based-Pooling Strategies
2.5 20 0.0 0 -200 -2.5 -20 -5.0
Non-Adaptive
2 0
DCGTake@N based on DCG gain function:
-2 -4 -6
Web 9
Robust 2005 Ad Hoc 5 7.5 40 50 5.0
0.00
0.00 0 0
-2.5 -20
-2.5 -20 -25 -5.0 -10
-5.0
1020 25 2.5
0
Web 92005 Robust 7.5
-5.0 -10-6 Robust Web 2001 2005 AdHoc Hoc Ad 75
7.5 40 5.0 20 50 2.5
10000 20000 30000 40000
RRFTake@N based on RR gain function:
-4 -20 -5.0 -25 -6 -7.5
-7.5
2.5 30 20 2525 20 0.0 0 00 10 -2.5 0 -20 -25 -25
2.5 30 0 200 2520 20-10 0.0 00-20 10 -2.5 -4 0-20 -20 -25
2.5 20 250 0.0 0 -2 0 -2.5
-10
DCG PP
Pool Size Web2001 92005 Robust Web
7.5
7.5 7.5 40 40 50 5.0 5.0 30 30 10 RBPA 25 2.5 2.5 20 20
RBPB 0.00 10 10 00.0 -2.5 00 -2.5 -25
3030 25 2020 0 1010
00 -25
-5.0 -10 Robust Web Web 2002 2005 Ad 2001 Hoc 7 Genomics 2005 Robust
RBPC RRF
-5.0 -10 -5.0 -10 -10
-10 -10 Web Robust 2001 2005 Genomics 2005 Web2002 2001
7.5 40 40 5.0 30 30 1010 2.5 2020
Web Web 200 Web2002 200 4040 30 30 10 2020
0.0 10 0100 -2.5 00
1010 0
-10 -5.0 -10 -10 -10
-10 -10 -10
00
Web 99 Web 2001 Web 2002 Web
Web2002 9 Web
SRE*
!
-2.5
Ad Hoc 4
NDCG
0
0.0
for you attention
SRE
-100-100
SRE
Recent studies have reconsidered the way we operationalise the pooling method, by considering the practical limitations often encountered by test collection builders. The biggest constraint is often the budget available for relevance assessments and the question is how best – in terms of the lowest pool bias – to select the documents to be assessed given a fixed budget. Here, we explore a series of 3 new pooling strategies introduced in this paper against 3 existing ones and a baseline. We show that there are significant differences depending on the evaluation measure ultimately used to assess the runs. We conclude that adaptive strategies are always best, but in their absence, for top-heavy evaluation measures we can continue to use the baseline, while for P@100 we should use any of the other non-adaptive strategies.
Thank you
MAE
1Aldo
RBPB RRF RRF RBPB
40 2 2 2 Figure 4. Pool with respect to402T2 ake@N strategy in terms 5.0 5.0 bias measured on NDCG 30 10 10 the rest of the test collections, -50pooling strategies on of SRE* for the for di↵erent300pool 0 0 00 2.5 2.5 20 20 sizes (i.e. number of documents that require relevance judgement).
PPTake@N based on RR gain function:
-2 0.0
-4 -2.5 -6 -5.0
-2 -2 -2 0.0 10 10-2 0 DCG RBPA0 RBPC DCG RBPA -4 -40-4 -40 -2.5 PP RBPB RRF PP RBPB -6 -6-6 -6 -5.0 -10 -10 -10 -10 10000 20000 3000010000 40000 10000 20000 10000 30000 40000 10000 10000 20000 30000 40000 20000 30000 40000 20000 30000 40000 10000 20000 30000 40000 Web 9 Web 9
Pool Size
RBPATake@N based on RR gain function: 2
Pool SizePool Size
RBPC RRF
DCG DCG PP PP
RBPA RBPA RBPB RBPB
RBPC RBPC RRF RRF
D
PP
20000 30000 40000 10000 20000 30000 40000 Pool PoolSize Size
Pool Siz
2
Figure 4. Figure on 4. NDCG bias measured respect Figure to on T ake@N 4. NDCG strategy with bias respect in terms Figure to on Ton ake@N NDCG 4. Poolstrategy with bias measured in terms totoT onTake@N NDCGstrategy with re Figure 4.Pool Pool biasmeasured measured NDCG withrespect respect ake@N strateg 0 Pool with 0 Pool bias measured Conclusion of SRE* for pooling strategies of measured SRE*on forthe therest pooling of thestrategies test ofofSRE* collections, on for the the for pooling di↵erent of thestrategies test ofstrategy pool SRE* collections, onon forthe the rest for pooling di↵erent ofofthe strategies test pool collections, on the for rest of Figure 3.the Pool bias with respect to Trest ake@N in terms of MAE, SRE* for the pooling strategies the rest the test collections, fordi↵e di↵t -2 number -2 number of documents sizes (i.e. sizes (i.e. that require of relevance documents sizes judgement). (i.e. that require relevance sizes judgement). that (i.e. require ofrelevance documents judgement). that require relev sizes (i.e.number numberof ofdocuments documents thatnumber requirerelevance judgement).
SRE, and SRE* for the pooling strategies on theRBPC Ad Hoc for di↵erent DCG8 test RBPAcollection, RBPC DCG RBPA -4 show that: -4 experimental results The PP RBPB RRF PP thatRBPB RRF pool sizes (i.e. number of documents require relevance judgement).
Adaptive
-6
-6
30000 40000 10000 20000 30000 40000 • given a large budget, 10000 the 20000 Take@N strategy isPool guaranteed to be the least biased Size Pool Size and therefore should be used
RBPBTake@N based on DCG gain function:
Figure 4. Poolwith bias respect measured NDCGstrategy with respect to T ake@N strategy in terms Figure 4. Pool bias measured on NDCG to on T ake@N in terms ofbudget, SRE*onforthe the pooling on the for rest ofdocuments the test collections, pool of SRE* the pooling strategies rest ofwhich thestrategies testonly collections, pool • for given a small with very fewdi↵erent can for bedi↵erent assessed, sizes (i.e. number of documents that require relevance judgement). sizes (i.e. then number documents that require relevance judgement). weof should operationalise RBPCTake@N
RBPCTake@N based on RR gain function:
• given a moderate budget and if we cannot operationalise RBPCTake@N, the non-adaptive pooling strategies do not underperform Take@N, but neither do they consistently improve
Aldo Lipani - aldolipani.com
[email protected] Vienna University of Technology Favoritenstr. 9-11/188, 1040 Vienna (Austria) Tel: + 43 1 58801 188302
PoolBiasEstimators
PoolB iasEs timat ors
• for P@100 all the non-adaptive pooling strategies outperform Take@N