Flood Forecasting in CrossGrid project L. Hluchy, V. D. Tran, O. Habala, B. Simo, E. Gatial, J. Astalos, M. Dobrucky Institute of Informatics, Slovak Academy of Sciences Dubravska cesta 9, 84507 Bratislava, Slovakia
[email protected]
Abstract. This paper presents a prototype of flood forecasting system based on Grid technologies. The system consists of workflow system for executing simulation cascade of meteorological, hydrological and hydraulic models, data management system for storing and accessing different computed and measured data, and web portals as user interfaces. The whole system is tied together by Grid technology and is used to support a virtual organization of experts, developers and users.
1. Introduction Over the past few years, floods have caused widespread damages throughout the world. Most of the continents were heavily threatened. Therefore, modeling and simulation of floods in order to forecast and to make necessary prevention is very important. The kernel of flood simulation is numerical modeling, which requires an appropriate physical model and robust numerical schemes for a good representation of reality. Simulating river floods is an extremely computation-intensive undertaking. Several days of CPU-time may be needed to simulate floods along large sections of rivers. For critical situations, e.g. when an advancing flood is simulated in order to predict which areas will be threatened so that necessary prevention measures can be implemented in time, long computation times are unacceptable. Therefore, using high performance computing platforms to reduce the computational time of flood simulation is imperative. In ANFAS project [11], several flood models have been parallelized. Remote processing tools have been also created for running simulations on remote high performance systems automatically from client system. The simulation results can be imported to GIS system for visualization and analysis. In CrossGrid project [12], meteorological and hydrological simulations are integrated into the system in order to forecast flood accurately. That requires cooperation between scientists in different areas, efficient data management system and a workflow system that can connect meteorological, hydrological and hydraulic simulations in a cascade. Therefore, Grid technologies are employed for implementing the system. This paper will describe the Grid-based flood forecasting system (Flood Virtual Organization - FloodVO) that is developed in CrossGrid project, its current status and
2
L. Hluchy, V. D. Tran, O. Habala, B. Simo, E. Gatial, J. Astalos, M. Dobrucky
future work. Section 2 briefly describes the architecture of FloodVO and its components. Details about each component are provided in Sections 3-5. In Section 6, the future work on knowledge system is described and Section 7 concludes the paper.
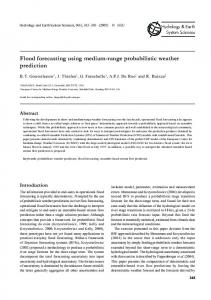
2. Flood forecasting system architecture Portals User interface layer Virtual organization
Workflow
Data management
Middleware layer
Grid infrastructure
Infrastructure layer
Fig. 1. FloodVO architecture
The architecture of FloodVO can be divided into three layers (Fig. 1). The testbeds of CrossGrid project provide the infrastructures for running Grid jobs. The executions of meteorological, hydrological and hydraulic simulations are managed by workflow system. Measured meteorological and hydrological data and simulation results are stored in storage elements and accessible via data management system. Users can access the data and models via web-based portals or Java-based migrating desktop.
3. Workflow in FloodVO A workflow system that we designed for our flood prediction system enables the user to define whole cascade execution in advance as a workflow and run it with the possibility to inspect every step. The whole flood simulation uses three main steps – meteorology, hydrology and hydraulics - to produce the final result – the prediction of the parts of the target area that are going to be flooded. When the expert wants to use already computed results
Flood Forecasting in CrossGrid project
3
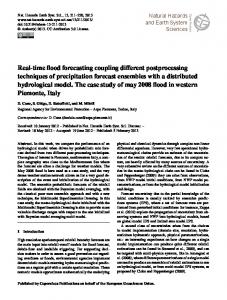
Aladin
HSPF Subcatchment2
Hydrology
HSPF Subcatchment1
Aladin visualization
HSPF Whole area
HSPF visualization
DaveF
DaveF visualization
Hydraulics
Aladin post processing
Meteorology
or does not need to compute the last step of the cascade, just parts of the cascade are required. The run of a single simulation model represents the simplest case.
Fig. 2 Workflow in FloodVO So we have several possible workflow templates that may be executed. We have decided to constrain the workflow selection to several predefined workflows in the first version. Workflow is defined for each target area based on the computation dependencies for that particular area. The changing part of the workflow is mainly hydrology because the run-off in the target catchment is computed from several subcatchments. Use case An expert who wants to perform a simulation chooses a target area and time for which to make the prediction. The choice is made by clicking on the map or choosing the name of the area from the list and entering the desired time span. Then the user chooses the workflow template from the list of templates available for the area of interest and selects the model to be used in each step. The possibility to select more models for the same step or even to enter user defined values instead of running a particular simulation step makes it possible to have several parallel instances of a workflow giving several results for the same time and area (Fig. 2). Workflow monitoring Outside of monitoring single jobs’ execution, it is possible to monitor the execution of whole workflows. List of workflows is similar to list of jobs, it presents workflow name, description, start time, current state and so on. Moreover, it is possible to look inside at the workflow structure to see the progress in detail. Results produced by a single step of the workflow can be inspected once that particular step has finished.
4
L. Hluchy, V. D. Tran, O. Habala, B. Simo, E. Gatial, J. Astalos, M. Dobrucky
There is a possibility to change the output of each step and run the rest of the workflow from that point with modified results. Workflow information storage The simulation model parameters for each model are stored in a corresponding configuration file. This file is stored in a temporary directory belonging to the workflow instance that the model is part of. As there is a static set of predefined workflow templates, workflow composition definition file does not have to be generated. Only the workflow instance file is created specifying concrete jobs representing each node of the workflow.
4. Data management in FloodVO This section will describe the current status of data management in FloodVO, as well as envisioned future development. It starts with the description of collected data and its path to FloodVO storage. Then the prototype implementation of data management system and metadata schema are briefly presented. The section is concluded with a general outline of our future plans for the final data management system of FloodVO. Data sources implemented in prototype The general schema of possible data sources for FloodVO operation was described in previous articles [6] and also included in the virtual organization (VO) figure. From these sources, only some were realised in the prototype stage of FloodVO. The most important data in FloodVO storage are the boundary condition for the operation of our meteorological prediction model ALADIN. Currently – because of the need of controlled testing environment – only historical data are available. The data also include a period in which severe flood occurred, thus making it particularly suitable for testing of the simulation cascade. The data was downloaded to FloodVO storage element (SE) and resides there, available through a fast internet connection for simulation purposes. The ALADIN boundary conditions, as well as the rest of all currently available data, is provided by our partner in the CROSSGRID project (a subcontractor), the Slovak Hydrometeorological Institute (SHMI). Because of a slow connection of SHMI to the Internet, all data is downloaded periodically to FloodVO SE, rather than being stored and made available at SHMI. The second type of data implemented in the prototype stage of FloodVO are radar images of current weather conditions in the pilot operation area. These are created by postprocessing of larger images at SHMI every 30 minutes and made immediatelly available for download by our software. The download occurs as well, twice each hour and the images are stored in the FloodVO SE The third type of currently available data are the ground-based water level, precipitation and temperature measurements provided by SHMI’s network of measurement stations. These measurements are periodically (the period depends on the type of data and the used measurement device) integrated into SHMI’s database. Because the period of measurement varies and this policy may be also changed by SHMI, we decided to collect all new available data (of interest to us) each 10 minutes
Flood Forecasting in CrossGrid project
5
and make it available for download by our SE software. Only some of the available measurement points are extracted from the database (shown as bright red dots in Fig. 3). The data is then written to a text file, which is downloaded to FloodVO SE, integrated into a relational database and archived.
Fig. 3 Measurement points of the regional centre Žilina The last type of data currently under development are satellite images of the pilot operation site. The negotiations with SHMI are not finished yet and the images will be available later for use in the FloodVO operation. Prototype implementation of data management software Data management in the prototype of FloodVO was implemented mainly using these software tools, provided by the European DataGrid (EDG) IST project [7]: • EDG Replica Manager (EDG RM) • EDG Local Replica Catalog (EDG LRC) • EDG Replication Metadata Catalogue (EDG RMC) • EDG Replica Optimization Service (EDG ROS) • EDG Spitfire [9] The prototype implementation defined only one storage element, located at flood-vo.ui.sav.sk. This SE concentrates all existing files needed in FloodVO operation. It is probable that this will change in the later development of FloodVO infrastructure. The metadata database was implemented using the MySQL [8] RDBMS and the EDG Spitfire Grid interface to this RDBMS. The client enables to add, modify, locate and delete metadata for given file in the FloodVO SE (identified by its GUID). The client can be also accessed from flood-vo.ui.sav.sk or (after installation) from any FloodVO member’s workstation.
6
L. Hluchy, V. D. Tran, O. Habala, B. Simo, E. Gatial, J. Astalos, M. Dobrucky
5. User interfaces There are three different user interfaces in various stages of development that provide access to the grid for the flood application.
Fig. 4 Screenshot of our GridPort based portal We have developed GridPort [1] based application portal, we are developing flood application specific portlets for the Jetspeed portal framework based application portal and we are being integrated with Java based client called Migrating Desktop. All of them are described in more detail below. Application portal based on GridPort toolkit We have started development of this version of application portal in the early stage of the CrossGrid project in order to provide basic demonstration and testing interface for our flood application (Fig. 4). The new grid and user interface technologies and support planned to be developed in the CrossGrid project were not available at that time so we decided to use already existing GridPort toolkit. This toolkit enabled the Perl CGI scripts to use grid services of underlying Globus [2] toolkit by wrapping Globus’ command line tools. It provided no additional support for building portals nor did it provide any support for new services being developed in the CrossGrid project. The portal provided access to basic grid services such as authentication of the users, job submission and management, file management and also enabled the user to run simulation models forming the flood application and view their results. We have dropped its further development when CrossGrid user interfaces became available.
Flood Forecasting in CrossGrid project
7
Fig. 5 Screenshot of the Jetspeed based application portal Application portal based on the Jetspeed portal framework The Jetspeed [3] portal framework has been chosen in the CrossGrid project as a modern powerful platform for creating grid application portal for the applications in the project (Fig. 5). This framework is also being used by other grid projects such as Alliance portal [4] and the new version of the GridPort toolkit – GridPort 3.0 [5]. Jetspeed is implemented as a server-side Java based engine (application server). Client services are plugged in using software components called portlets. Each portlet has a dedicated space on the screen, which it uses for communication with users. Portlets are independent from each other and user can arrange their position, size and visibility. Jetspeed, in contrast to GridPort, provides framework for building information portals (pluggable portlets mechanism, user interface management, security model based on permissions, groups and roles, persistence of information etc.) but does not provide any support for grid services and applications. Common grid portlets that can be used in Jetspeed are being developed in CrossGrid and other projects. Portlet for submission of specific simulation models of flood application has been developed and now we are focusing on automatization of a computation of the flood simulation cascade by employing workflows. We are also investigating the possibility of using groupware portlets from the CHEF [5] project.
8
L. Hluchy, V. D. Tran, O. Habala, B. Simo, E. Gatial, J. Astalos, M. Dobrucky
Fig. 6 Screenshot of the Migrating Desktop Migrating Desktop Migrating Desktop is a Java client being developed in the CrossGrid project (Fig. 6). The idea was to create user interface with greater interactivity than could be possible to achieve by using web technology. Current version provides access to basic grid services such as authentication, job management, file management. Support for specific application features is addressed by application and tool plugin interfaces that enable to plug in code handling application specific parameter definition and visualization. We have implemented both plugins for the flood application. Application plugin enables a user to specify input parameters for specific simulation model and submit it to the grid. Interface for parameter input is dynamically generated from the XML configuration files and default values are suggested. Examination of visualized results of the simulations is done via the tool plugin. Output of the visualization of meteorological and hydraulics simulations is a sequence of pictures so the tool plugin is a picture browser with simple animation feature.
6. Future work Many simulation models, in some cases, are not very reliable and are also dependent on many other factors (physical phenomena), which are not included in evaluation process of the models. Knowledge based treatment of historical data could provide enhanced functionality for the simulation models which strictly relies on the recent
Flood Forecasting in CrossGrid project
9
data sets. It also allows to construct several predicates of states according to knowledge evaluation with simulation run.
DATA SOURCES
METADATA & KNOWLEDGE REPOSITORY
Submission Metadata
SIMULATION PROCESES
User interaction
Meteorological Simulation Hydrological Simulation
REASONING Job submission
External resources
Hydraulic Simulation VISUALIZATION & POSTPROCESSING
Information about outputs
Grid environment
Fig. 7.Knowledge system in FloodVO
Knowledge repository will store information for the particular simulation and also for the reasoning process (Fig. 7). The information sets stored in the repository will depend on post-processing of simulation output, evaluation of relevance (relevance ranking) and user assessment (expert point of view). This enables to compare consequent data sets which are going to be processed and data sets which have already occurred in previous simulation processing. For example in meteorological simulation, similar cases of weather conditions can be found in the same season, but in different years. The statistical analysis methods can be used to search for similar cases. So, the reasoning process will have available information about the simulations, which had the most similar input data sets, also its outcomes and relevant information about condition of simulated environment. It is up to reasoning process implementation, whether it allows user to run next simulation job automatically with or without any changes or provides options to change simulation properties according to given information about previous simulation runs. The reasoning could be also able to obtain/store the information from/to external resources (e.g. utilize web service) and as well as experts. Reasoning system will cover ontological description of terms and its interrelations (e.g. relations between inputs and outputs of simulations), moreover, it will define possible inputs and outputs form/to external resources. Generally, ontology could be recorded in the DAML+OIL description language and accessed with reasoning application. According to this ontology, the information will be evaluated for every particular type of simulation. The user could be able to adjust behavior of reasoning by choosing different templates. The evaluation process includes relevant knowledge acquisition (to restrict irrelevant information), processing of data sets to prepare
10
L. Hluchy, V. D. Tran, O. Habala, B. Simo, E. Gatial, J. Astalos, M. Dobrucky
information (to reduce the detail level in information) and make available information for user and for inference algorithm. The algorithm of inference must also be able to process incomplete information about possible states. However, the reasoning procedure is in the phase of research, it will utilize methods from [13] propositional calculus and reasoning with uncertain information (probabilistic reasoning). It will be designed and tested as the last issue according to requests from users and developers of the simulation methods.
7. Conclusion In this paper, the Grid-based flood forecasting system is presented. The system consists of different user interfaces, workflow system for executing cascade of meteorological, hydrological and hydraulic simulations and data management system for storing and accessing different types of data
References 1. 2. 3. 4. 5.
6.
7. 8. 9.
10. 11. 12. 13.
GridPort toolkit. https://gridport.npaci.edu Globus toolkit. http://www.globus.org Jetspeed. http://jakarta.apache.org/jetspeed/site/index.html Alliance portal. http://www.extreme.indiana.edu/alliance/ Grid Port 3.0 Plans presentation. http://www.nesc.ac.uk/talks/261/Tuesday/GP3%20HotPage%20Combined%20Edinb urgh%20Presentation.ppt Hluchý L., Habala O., Simo B., Astalos J., Tran V.D., Dobrucký M.: Problem Solving Environment for Flood Forecasting. Proc. of The 7th World Multiconference on Systemics, Cybernetics and Informatics (SCI 2003), July 2003, Orlando, Florida, USA, pp. 350-355. Hoschek, W., et. al.: Data Management in the European DataGrid Project. The 2001 Globus Retreat, San Francisco, August 9-10 2001. Widenius, M., Axmark, D.: MySQL Reference Manual. O'Reilly and Associates, June 2002, 814 pages. Bell, W., et. al.: Project Spitfire - Towards Grid Web Service Databases. Technical report, Global Grid Forum Informational Document, GGF5, Edinburgh, Scotland, July 2002 WMO Core Metadata Standard - XML representation. World Weather Watch. http://www.wmo.ch/web/www/metadata/WMO-metadata-XML.html ANFAS: Data Fusion for Flood Analysis and Decision Support. IST-1999-11676. http://www.ercim.org/anfas/ Development of Grid Environment for Interactive Applications. IST-2001-32243. http://www.eu-crossgrid.org/ Nilsson J. Nils, Artificial intelligence: A New Synthesis, Morgan Kaufmann Publishers, Inc., San Francisco, California.