Probabilistic Flood Inundation Forecasting Using A Rating Curve Library Approach Caleb Buahin, Utah State University,
[email protected] Nikhil Sangwan, Purdue University,
[email protected] Cassandra Fagan, University of Texas,
[email protected] Curtis Rae, Brigham Young University,
[email protected] Advisors: Dr. David Maidment, Dr. Jeffery Horsburgh, Dr. Venkatesh Merwade, Dr. Jim Nelson
I. ABSTRACT Many researchers have highlighted the need to incorporate uncertainty assessment in flood inundation modeling. One approach to accomplish this goal is to use an ensemble of models with different conceptualizations, initial conditions, and parameterizations that capture the factors that contribute to uncertainty in model predictions. However, the computational expense associated with many hydraulic models, prohibit their use for such evaluations, especially when dealing with large spatial scales in real-time forecasting scenarios. To overcome this challenge, we use a rating curve library approach for inundation delineation. This approach involves pre-computing a rating curve at various cross-sections along a river by running a hydraulic model over a range of flows. River stage at each cross-section for a given flow forecast can then be readily interpolated from the rating curve library, thereby providing a computationally efficient and scalable method to delineate local inundation areas. We apply this method using a forecast automation software tool we have developed called the Rating Curve based Automatic Flood Forecasting (RCAFF; https://github.com/calebbuahin/RCAFF) tool, to streamline the workflow associated with the method. This software extracts cross sections and ratings curves from an existing HEC-RAS model; downloads real-time ensemble flow forecasts derived by downscaling runoff European Center for Medium range Weather Forecasting (ECMWF) model routed through the Routing Application for Parallel Computation of Discharge (RAPID) model; and dynamically delineates inundation extents and inundation probability maps. We investigate the feasibility of using this rating curve library method by applying the RCAFF tool to Shoal Creek in Austin, TX.
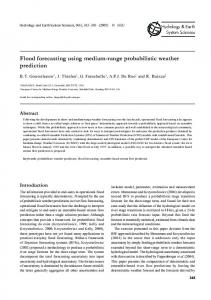
III. WORKFLOW
RCAFF HEC-RAS project file
Rating curve library
HEC-RAS Controller library
COMID mapping to cross-sections
Rating curve library
5/20/2015 6:00 A.M.
Rating curve library
5/25/2015 6:00 A.M.
Forecast file COMID mapping to crosssections ECMWF-RAPID streamflows from
Forecast file
Interpolation of water level at each cross-section using rating curve library
Water surface triangulation and subtraction of DEM using Triangle and GDAL
Q
Inundation depth and probability rasters
t
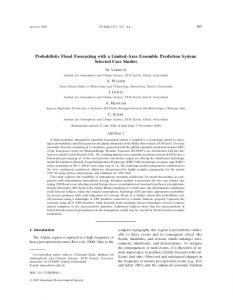
II. STUDY AREA
IV. RESULTS 5/25/2015 3:40 P.M.
5/25/2015 4:40 P.M.
5/25/2015 5:40 P.M.
Progression of Memorial Day flood
Rating curve library approach
RAS approach
Comparison
Comparison of results from automation and RAS
V. CONCLUSIONS
VI. ACKNOWLEDGEMENTS
• The rating curve library approach provides a computationally efficient and scalable method for forecasting flood inundation. • Inundation extents and depths predicted by our open source developed tool is consistent with the RAS mapping results. • First responders Tethys web application provides convenient access to inundation forecasts and inundation probability to first responders and the general public 15 days in advance to allow optimal allocation of flood mitigation resources.
This work was conducted as part of the National Flood Interoperability Experiment (NFIE) summer institute held at the National Water Center on the University of Alabama Campus, in Tuscaloosa from June 1st to July 17th, 2015. We wish to express our gratitude to the organizers of the institute including the Consortium of Universities for the Advancement of Hydrologic Sciences, Inc. (CUAHSI), the National Oceanic and Atmospheric Administration-National Weather Service (NOAA-NWS) and their federal partners for their financial support as well as the cyberinfrasture and datasets they provided during the course of the summer institute.