flood modeling and inundation risk evaluation using ...
Recommend Documents
Mar 11, 2009 - Abstract A coupled 1D-2D hydrodynamic model,. MIKE FLOOD was used to simulate the flood inundation extent and flooding depth in the delta.
Oct 23, 2000 - The flood inundation areas were extracted from RADARSAT images by visual and ... inundation map on using GIS and hydrodynamic modeling.
May 20, 2015 - a rating curve library approach for inundation delineation. ... We apply this method using a forecast automation software tool we have ...
Oct 21, 2014 - Abstract: Low-lying coastal regions and their populations are at risk during storm surge events and high freshwater discharges from upriver.
Oct 21, 2014 - storm surges and inundation for Hurricane Andrew in 1992. ..... two-dimensional formulaitons based on an Ivan-like storm over the Tampa Bay, ...
School of Natural Resources and Environment, University of Michigan, ... temporal patterns of flooding, as influenced by the combination of natural flood regimes ...
Integrate models in Python to create zone maps. Clip zone map to rice cultivation extent ... fb.com/OMLCenter. REFERENCES: [1] Sole, A., Giosa, L., Nolè, L., ...
Apr 14, 2017 - Analysis System (HEC-RAS) was utilized for hydraulic modeling. ... Therefore, high-resolution LiDAR and field verified survey data of.
Alfred P. Sloan Foundation Industries Studies ConferenceBoston, MA. Hall, J. (2007). "Probabilistic climate scenarios may misrepresent uncertainty and lead to ...
Dec 3, 2009 - ios that can be reasonably produced in this manner, and the relatively coarse ..... were identified in an automated fashion (ESRI, 2009). This.
Feb 22, 2017 - Flood inundation data assimilation and big data. Sanita Vetra-Carvalho Sarah L. ... Good dynamical model for urban flooding forecasting;. 2.
Keywords: Flood mapping, Modified LSWI, MODIS, ALOS ..... MODIS Terra (a) & Aqua (e) color composite surface reflect
Sep 6, 2017 - 1College of Water Sciences, Beijing Normal University, Beijing 100875, China. 2Beijing Key ... 3Jinan Hydrology Bureau, Jinan 250014, China.
gauging station in each major river are used for this compar- ison. The three locations were the Bahadurabad station of the. Brahmaputra; the Hardinge Bridge ...
media data with remote sensing, river gauge measurements and digital elevation ... The Thames (Isis) and Cherwell form the major river systems with many.
numerical schemes widely used in flood models such as Flood Modeller Pro .... implicit shallow-water finite element model of Venice. Lagoon to a 1-D model of ...
(2009) successfully performed flood inundation simula- tion by coupling of 1D and 2D Mike Flood hydrodynamic model during the year of 2001, and thus, ...
Roughly 20,000 houses, 70 schools and 100 other public buildings are exposed ... constraint in implementing and coordinating the rescue and post-disaster ... Though only 23% of the total area of the country lies in the Terai more than 47% of.
May 9, 2014 - of overland floods and water levels. Gianinetto et al. [23] evaluated flood extents before and after the flood events using two Landsat-5 ...
Apr 26, 2017 - cially in complex landscapes, flood inundation modelling us- ..... n = Manning's n roughness coefficient (m3 sâ1). x = Retardance class. v ...
[email protected]. Istiarto. Master of Engineering in Natural Disaster Management, Universitas Gadjah Mada, Yogyakarta, INDONESIA [email protected].
Dec 20, 2018 - of occurrence and intensity, corresponding to 5, 100, and 500 years. The flow ..... Res. Public Health 2019, 16, 5. 6 of 19 flooded in each episode. ..... A.M-G.; writingâreview and editing: M.C.; visualization: F.S.-F.; supervision:
Action plans dedicated to die reduction of flood effects include measures broadly classified .... data are made available each hour on the ftp server. Finally, data ...
Jan 9, 2008 - Tlie present paper deals with flood risk and its reduction using flood .... plemented in the central software Mike Flood Watch (DHI 2005a).
flood modeling and inundation risk evaluation using ...
Aug 31, 1992 - inundation risk evaluation due to sea level rise has received considerable ... which is the first application of the model over these coastal zones.
FLOOD MODELING AND INUNDATION RISK EVALUATION USING REMOTE SENSING IMAGERY IN COASTAL ZONE OF CHINA Xiaoping Du1,2,* , Huadong Guo1, Xiangtao Fan1, Junjie Zhu1, Zhenzhen Yan1, Qin Zhan1 and Sun Zhongchang1 1
Key Laboratory of Digital Earth, Center for Earth Observation and Digital Earth, Chinese Academy of Sciences, Beijing, 100094, China 2 Graduate University of Chinese Academy of Sciences, Beijing, 100049, China * Corresponding author: [email protected] hydrodynamic model can simulate the physical processes of flooding, which can forecast the extent of flood more precisely. This paper applies 2D hydrodynamic model of LISFLOOD-FP to assess flood area and depth over time, which is the first application of the model over these coastal zones. One of the most important factors affecting the propagation of flood is the surface friction, which is determined by the surface roughness, namely manning coefficient. The manning coefficient of floodplain surface has been converted by remote sensing imagery classification results, so that the accuracy of model prediction has been improved. This method has been applied in the present study for a city region, Tianjin, located in the Bohai Bay, China, and the inundation risk of this area has been evaluated and analyzed.
ABSTRACT Global climate change has caused sea level rise, and one of the most extremely consequences are the increased frequency and hazards of the storm surge disasters, therefore, how to effectively assess the risk of storm surge disaster is of importance to hazard reduction and mitigation. Howeverˈthe storm surge forecast models have complex parameters, which computational inefficiency. Traditional large-scale assessment usually takes elevation-area method based on GIS software, which result in large errors. The present study is attempted to: (1) Select proper two-dimensional hydraulic storm surge inundation model. This model not only has the physical realism but simple and efficient. (2)The present study will focus on the method to extract the required surface parameters based on the remote sensing data to integrate remote sensing data into the model. This project aims to provide the theoretical basis and methodologies for flood risk assessment in coastal zone of China.
As a result of human-induced climate change, global average sea levels are rising over decades, which will impact on human living in coastal regions and the natural environment[1]. Sea level rising increases the vulnerability of these areas to flood during storm surge[2]. Study of costal inundation risk evaluation due to sea level rise has received considerable attention worldwide[3-5]. China has a long coastline, along which are a number of estuaries and delta regions, where are most developed and densely populated. Consequently, the research on inundation probability and risk evaluation in China coastline zone will play an essential role in the mitigation of coastal hazards. DEM data with various high-resolution and remote sensing images have offered economically feasible data sources for flood risk evaluation, which are alternative data to traditional hydrologic data. The researchers home and aboard have undertaken some studies by different methodologies, among which area-elevation method with GIS software to calculate flood area is more popular. The
(3) Where h stands for water height, u and v are flowing speeds, and q is flow rate. To simplify the solution of the continuity equations and momentum equations, the LISFLOOD-FP raster flood routing model is used in this study. LISFLOOD-FP is a storage cell code, in which floodplain flows are similarly represented in terms of discretized continuity and mass flux equations[6, 7]. At the same time, floodplain is discretized as a grid of square cell. Flow between cells is then calculated as a function of the
903
IGARSS 2012
flood were numerical simulated by parameters alteration. After running the model, the range of inundation and depth changing with time in the specific storm surge in the study area will be obtained. The validation of the model will be assessed by the historical data. And finally, the flood inundation map will be got with the help of GIS software.
free surface height difference across each cell face˖ i, j
Where hi,j is the water free surface height at the cell (i,j)ˈ ο ݔand ο ݕare cell dimensions, n is the manning coefficientˈQx and Qy are flow rates between grid cells. It is simple and the result is very similar to a more precise of the diffusive wave equations[6].
3 3.1
INUNDATION RISK EVALUATION
DEM
Continuity Equations
Manning Coeffient
Land Use/ Land Cover
Simplified Equations
Hydrodynamic Model
Momentum Equations
Discretized and Solved Using Finite Differences
Data and Study Area
Remote Sensing Images
Inundation Risk Mapping and Validation
Boundary Conditions
History Data
Fig.2. Methodological approach to evaluate inundation risk over coastal zone
SRTM data are the most complete and high precision topographic data in the world, which has provided reliable sources for the geographical analysis. In the study area SRTM elevation accuracy has reached 2.39m (RMSE). The sophistical multispectral image of TM on Landsat satellite has been used for land use/cover classification. Tianjin, the study area, is located in the east of China, where mainly covers low altitude coastal plains and estuaries (Fig. 1˅. The central position is about 117e40ĄE and 39e0ĄN.
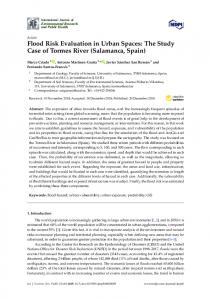
The classification result can be converted to manning roughness coefficient by the characteristics of the flood plain (Fig.3.). According to the result of French, R.H.[8], the manning coefficient of arable (grass) is set to 0.2, fallow (bare soil) set to 0.12, building set to 0.2 and water (salt pan) set to 0.03.
Fig.1. Rectangle shows the study area in Bohai Bay, China 3.2 Methodology (a)
The Framework of methodology is shown in Fig. 2. Remote sensing image acted as the data source; land use and land cover data in the study area can be obtained after data classification. Both overtopping flood and defense breaches
904
which will result in invalidation of model output. As a result, the building height in the city area has been roughly filtered and interpolated by ground surveying points.
(b)
Fig.4. Tide level recorded at Tanggu station of Tianjin, in September 1992. The developing process of the flood can be simulated by the model. The output of the model is the flood extent and depth over periods of time, which is quite similar to the history record of gauge station[9]. The flood map and consequent analysis can be carried out with the help of GIS software. The flood inundation maps are shown in Fig 5. The statistical analysis of flood inundation area grouped by land covers shows as Tab.1.
(c) Fig.3. Remote sensing image and classification result. (a) ETM+ image of study area, color composite of bands 5(red), 4(green), 3(blue) from October 6th 2002. (b) Classification result: arable (green), fallow (yellow), building (red), and water (blue). (c) Manning roughness coefficient. 3.3
Result Analysis
Typhoon Polly, developed in September 1992 (9216), was one of the most destructive storm surges in China. Part of Tianjin was inundated with a high tide of 5.93m. This typhoon caused flood in Tianjin coastal study area has been simulated and analyzed by the above method. Tide level of 40 hours was recorded at Tanggu Tide-gauge station from 2:00 p.m. on 31st August, 1992 (shown as Fig 4.). The SRTM height is influenced by the buildings in the city area,
(a)
905
the inundation risk of all the coastal regions in China. However, future effort should be made to further improve vertical accuracy of SRTM data in coastal areas.
5
ACKNOWLEDGEMENT
The research is jointly supported by the National Basic Research Program of China (2009CB723906), Director Foundation of Center for Earth Observation and Digital Earth Chinese Academy of Sciences (09ZZ12101B), and National Natural Science Foundation of China (41071274). The authors are grateful to International Scientific Data Mirror Network, Computer Network Information Center, Chinese Academy of Sciences for providing SRTM data. The TM data have been provided by data share plan of CEODE, CAS. 6 1.
(b) Fig.5. Inundation extent and depth.(a) Result of flood extent when the storm developing at the 20th hours. (b) Results at the 35th hours. Red polygon is the recorded extent according to Fujiang Yu[9] and the yellow extent is the result of the model.
2.
3. Tab.1. Inundation area (km2). Land Cover Grass Building Inundation 0.64 48.16 area
Salt pan
Bare soil
31.28
60.44
4.
In this study, a flood caused by 5.93m high wave storm surge has been simulated. The results can show the flood process into floodplain with time after the storm surge occurrence. Supported by GIS software, the flood areas changing within the flood periods have been obtained. The flood inundation risk map and damage evaluation have been carried out after overlay population and socio-economic data. 4
5.
6.
7.
CONCLUSION
Based on DEM data and remote sensing data, the present paper simulates the storm surge inundation process in the coastal areas of China, and evaluates the flood risk in this area. DEM data and remote sensing data, applied in the study, are global accessible and free, which has saved the cost of assessment, so that this methodology can offer a coastal flood risk evaluation example for the developing countries and areas. This method will be used to evaluate
8. 9.
906
REFERENCES
Parry, M.L., Climate Change 2007: impacts, adaptation and vulnerability: contribution of Working Group II to the fourth assessment report of the Intergovernmental Panel on Climate Change2007: Cambridge Univ Pr. Dasgupta, S., et al., "The impact of sea level rise on developing countries: A comparative analysis". World Bank Policy Research Working Paper No 4136, 2007. Meehl, G.A., et al., "How much more global warming and sea level rise?". Science, 2005. 307(5716): p. 1769. Purvis, M.J., P.D. Bates, and C.M. Hayes, "A probabilistic methodology to estimate future coastal flood risk due to sea level rise". Coastal Engineering, 2008. 55(12): p. 1062-1073. Vafeidis, A.T., et al., "A new global coastal database for impact and vulnerability analysis to sea-level rise". Journal of Coastal Research, 2008: p. 917-924. Horritt, M. and P. Bates, "Effects of spatial resolution on a raster based model of flood flow". Journal of Hydrology, 2001. 253(1-4): p. 239-249. Bates, P.D., et al., "Simplified two-dimensional numerical modelling of coastal flooding and example applications". Coastal Engineering, 2005. 52(9): p. 793-810. French, R.H., Open-channel hydraulics1985, New York: McGraw-Hill. Fujiang, Y., Z. Zhanhai, and L. Yihua. "A Storm Surge Numerical Forecast System Based on GIS". in Proceedings of the Congress International Association for Hydraulic Research. 2001. p.454-459