NATHAN LACY, GARY D. CHRISTIAN* and JAROMIR RUZICKA*. Department of Chemistry ..... 5 H.D. Goldman and L.G. Hargis, Anal. Chem., 41 (1969) 490.
Analytica Chimica Acta, 224 (1989) 373-381 Elsevier Science Publishers B.V., Amsterdam -
373 Printed in The Netherlands
FLOW INJECTION METHOD FOR ANTIMONY(II1) BASED ON ITS ENHANCEMENT OF THE MOLYBDENUM BLUE REACTION
NATHAN
LACY, GARY D. CHRISTIAN*
and JAROMIR RUZICKA*
Department of Chemistry, BG-10, University of Washmgton, Seattle, WA 98195 (U.S.A ) (Received 28th November 1988)
SUMMARY A simple flow-injection methodology is described for the determination of antimony using spectrophotometric detection. The method is based on the enhancing effect of antimony in the molybdenum blue reaction. Phosphate and heptamolybdate reagents are premixed and pumped as a reagent stream, into which the antimony sample is injected. This allows the formation of a mixed heteropoly complex, which is then rapidly reduced by ascorbic acid to form the intense blue complex, the absorbance of which is monitored at 660 nm. A continuous-flow procedure is used and 120 samples can be processed per hour. The measurement range is O-100 mg 1-l antimony, with a detection limit of 0.5 mg 1-l. The relative standard deviation is 0.65-2.1% in the range 20-5 mg 1-i. Arsenic and silica cause interferences of -4% and +4.6%, respectively, when present at concentrations equal to that of the antimony.
The molybdenum blue reaction for the determination of phosphate is very slow and requires as long as 30 min for complete reaction to occur, depending on the conditions of pH and temperature [ 11. Crouch and Malmstadt [2] showed that the time required for attaining complete reaction is highly dependent on pH, in that the rate of change in absorbance is inversely proportional to [H+ 1’. Further studies characterized a complex system wherein reaction orders for the constituents were concentration dependent and a 30-fold excess of MO (VI ) was required to ensure first-order kinetics for phosphate [ 31. The molybdenum blue method has also been used for determining silicate, arsenate, germanate and other 0x0 anions [4] wherein the reaction involves the formation of heteropoly molybdic acid species. Mixed heteropoly complexes with metals such as bismuth, niobium, nickel, thorium, tungsten and yttrium have been used for the determination of these metals, based on their enhancing effect on the molybdenum blue reaction. For bismuth, the reaction was found to be first order when the concentrations of all other reagents were held constant [ 51, and this fact was used by Hargis [ 61 in developing a reaction rate method for the determination of bismuth.
0003-2670/89/$03.50
0 1989 Elsevier Science Publishers B.V.
374
The determination of phosphate with numerous modifications has been adapted to flow-injection (FIA) methods [ 7-161, but FIA has not been applied to the molybdenum blue reaction for the measurement of a metal such as bismuth. Antimony also enhances the molybdenum blue reaction [ 171 and was used by Janse et al. [ 181, in their FIA system, but only for the purpose of optimizing parameters for phosphate determination. Current FIA methods for antimony use atomic absorption spectrometry for detection [19,20] and no FIA method was found for antimony based on its enhancement of the molybdenum blue reaction. The purpose of this work was to develop a quantitative FIA technique for the determination of antimony based on its enhancement of the molybdenum blue reaction, thereby allowing the use of a simple spectrophotometric detection system. EXPERIMENTAL
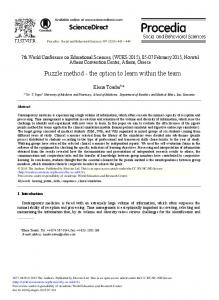
Apparatus The FIA system used in this work was of the same physical configuration as that used by Ruzicka and Hansen [ 71 for the high-sensitivity determination of phosphate (Fig. 1). The primary difference between this FIA system and that previously used by Ruzicka and Hansen was in the chemistry of the color development. In their original system for phosphate determination, the rate of the molybdenum blue reaction was enhanced through the use of a reaction manifold thermostated at 38°C. The current system used ambient temperature, which was 20” C and did not vary by more than 0.5’ C during the analyses. All parameters of the’classical molybdenum blue method, including the phosphate concentration, were held constant while varying only the concentration of antimony in the sample. In this way the enhancing effect of antimony could be evaluated and correlated with its concentration. A Tecator FIAstar 5010 Analyzer was used and was equipped with a FIAstar 5102-001 injector having a sample-loop volume of 100 ,ul. The 5010 Analyzer PUMP ml mm-’ CARRlER 1,
SAMPLE v
WASTE
Fig. 1. FIA manifold for the determination of antimony. Reagent 1 consisted of the phosphateheptamolybdate mixture and reagent 2 was the ascorbic acid solution. Absorbance was monitored at 660 nm.
375
was interfaced with a FIAstar 5032 controller and also an IBM AT personal computer (PC ) . The 5032 controller was used for setting the detector parameters while the IBM AT PC was used for controlling the pumping times and injection times via the Tecator Superflow program. The detector was a FIAstar 5023 spectrophotometer set at 660 mm, which utilized a flow-through cell having a volume of 18 ,~l and a path length of 10 mm. All Tygon pump tubing was of 0.64 mm i.d. diameter and color coded with orange/white collars. Each reagent pump tube provided flow-rates which were characterized at 1.1 ml min-‘, thereby providing a total flow-rate of 3.3 ml min-’ through the detector. Reagents All reagents used were of ACS reagent grade and all solutions were prepared using deionized, degassed water. A 0.0025 M ammonium heptamolybdate solution was prepared which was also 0.2 M in nitric acid and 10 mg 1-l in phosphate (as P, using KHzPO,). This solution was prepared fresh daily to help prevent contamination with silicon from the glassware, and no contamination was observed. A 5% (w/v) L-ascorbic acid solution in 10% (v/v) glycerine was prepared fresh daily to eliminate problems of air oxidation of the ascorbic acid. The 10% glycerine aids in preventing deposition of reaction products on the flow-through cell walls [ 71. A 400 mg 1-l antimony (as Sb) stock solution was prepared using potassium antimony, tartrate, a 100 mg 1-l silica (as Si) stock solution was prepared using silicic acid and a 400 mg 1-l arsenic (as As) stock solution was prepared using arsenic trioxide. Standards for analysis were prepared by appropriate dilutions of the antimony, silica and arsenic stock solutions. RESULTS AND DISCUSSION
Extensive research has been done to characterize the species formed between phosphate and heptamolybdate [ 21-231 and more details regarding the composition of the species formed and the associated reaction conditions can be found in the references cited. For the sake of discussion, the notation 12MPA will be used in referring to the unreduced yellow heteropoly complex formed between the heptamolybdate and phosphate. Additionally, although the mixed heteropoly complex of 12-MPA with antimony has not been well characterized, it shall be referred to as 12-MPA/Sb. Further, recognizing that the blue species formed is actually a mixed-valence entity resulting from the reduction of only some of the atoms in the complex from Mo(V1) to MO(V) [ 241, these shall be referred to as 12-MPAn and 12-MPAn/Sb. In reagent 1 (Fig. 1 ), all phosphate present will exist in the heteropoly form, 12-MPA. When antimony is added it becomes incorporated into the 12-MPA structure, yielding the mixed heteropoly complex, 12-MPA/Sb. When superstoichiometric amounts of antimony are used, only the mixed heteropoly form
376
is present, but when sub-stoichiometric amounts of antimony are used, both the 12-MPA and 12-MPA/Sb forms can exist in solution and, on addition of the reductant, color development will result from the reduction of both the heteropoly (H ) and mixed heteropoly (MH ) forms. Simple rate equations can now be written in terms of the appearance of the blue complexes, 12-MPAn or 12-MPAn/Sb, and the disappearance of the yellow complexes, 12-MPA or 12MPA/Sb: Rateu=d[12-MPAn]/dt=
-d[lB-MPA]/dt
RateMu =d[12-MPA,/Sb]/dt=
-d[l2_MPA/Sb]/dt
The observed rate, measured as dA/dt, should be proportional to the rates for the simultaneous reduction of the two forms of the complex which are present when the amount of antimony is sub-stoichiometric: Rate,b,. =dA/dtcc
(d[lB-MPA,]
+d[l2-MPA,/Sb])/dt
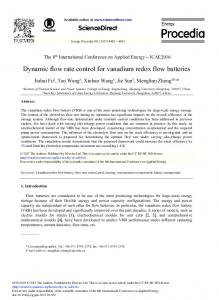
With no antimony present, the observed rate should be equal to the rate of the heteropoly reaction. As antimony is added, the observed rate should then increase until it becomes equal to the rate of the mixed heteropoly reaction. Murphy and Riley [ 251 examined the effect of antimony in this reaction system and showed that the antimony was being incorporated into the phosphateheptamolybdate complex with antimony:phosphorus atomic ratios of 1: 1 identical with those obtained for the similar bismuth: phosphorus complex [ 51. Because the 12-MPA is constantly merged with ascorbic acid, the influence of the heteropoly reaction is always present, producing a constant background absorbance. When antimony is injected into the reagent stream, the resulting increase in the observed absorbance is therefore a result of only the mixed heteropoly (12-MPA/Sb) reaction and appears as a normal FIA peak. Figure 2 shows the background absorbance profile for the heteropoly reaction in the absence of injected antimony when the flow was stopped. Color development was slow and the colored complex was unstable at times greater than 14 min (note the decrease in absorbance beyond 14 min) and 90% of the color development occurred within the first 5 min. Although the specific characteristics of our hypothesized observed rate increase due to antimony have not previously been determined, a well defined and predictable relationship should exist so that a calibration graph can be utilized in predicting the concentration of antimony present due to its enhancing effect in the system. Work by Campbell and Mellon [ 261 with bismuth showed a non-linear but reproducible relationship and, since the chemistries of bismuth and antimony are very similar, this might also be expected for the antimony calibration. Because FIA typically measures the analyte prior to attaining a steady state, the longer the sample is allowed to react, the greater will be the signal and
14 MINUTES
.
.
t
0
TIME
Fig. 2. Absorbance vs. time for the reagent streams when the flow was stopped.
hence the greater the sensitivity. Accordingly, the influence of using stopped flow in the analysis was also examined. There are two methods of data treatment in kinetic chemistry, derivative and integral [ 27,281. Because FIA systems can rapidly advance a sample into the detector and stop it there prior to a significant amount of the reaction having occurred, depending on various chemical and physical factors of the system, initial rate measurements can be performed on reactions. Also, because the detector signal is constantly monitored, a slope measurement yielding a reaction profile naturally results. Prior to attaining steady-state conditions, FIA peak-height measurements are clearly fixed-time kinetic measurements and stopped-flow measurements can incorporate the derivative techniques of both the initial-rate method and slope measurements. Each of these was considered for suitability in developing the FIA determination of antimony. Figure 3 shows stopped-flow curves for O-100 mg 1-l antimony in increments of 20 mg 1-l wherein the flow was stopped just past the peak zenith. A definite enhancement of the absorbance occurs as the concentration of antimony increases and results from the increased reaction rate for the mixed heteropoly species. The reaction profiles in Fig. 3 indicate that the initial rapid portion of the reaction is complete about 30 s after injection, at which point the rate curves begin to level off and become parallel to each other. This gradual increase in absorbance after stopping the flow is due to the reduction of the excess of 12-MPA and/or the excess of molybdate reagent. The reaction time for the sample from the confluence point to the detector is 10 s, during which ca. 75% of the reaction has occurred before stopping the flow. Accordingly, the 2% criterion [27] for using the initial-rate method cannot be met for this system.
378
-TIME
Fig. 3. Stopped-flow scans for samples of antimony just past the peak zenith. Fig. 4. Stopped-flow scans on the leading edge of the FIA peak.
It was observed that the leading edge slopes of the FIA curves increased in an orderly manner. In order to examine this aspect more closely and to ensure that the antimony-enhanced reaction was being measured, further stoppedflow experiments were conducted in which the flow was stopped on the very leading edge of the peak rather than on the tail (Fig. 4). Increases in the initial slope before the stop can be seen, but at this point the majority of the antimony-enhanced reaction has occurred owing to the transit time to the detector. Although reasonable results might be obtained if one were to measure dA/dt immediately after stopping the flow, consideration that a significant portion of the reaction has already occurred makes pursuit of the initial-rate method less realistic. Despite the fact that the initial slopes recorded in Fig. 4 are a result of both the rate of the catalyzed reaction and the physical movement of the sample into the flow cell, a correlation is observed between the initial slope and the concentration of antimony present. Manual evaluations of these initial slopes yielded linear results having a correlation coefficient of 0.987. Incorporation of a suitable data collection and handling system might provide more accurate evaluations of these initial slopes, thereby increasing their use in quantitative determinations. Since a continuous flow technique is simpler than a stopped-flow method and is suitable for fixed-time measurements, it was selected for the antimony determinations. The sample was allowed to react for ca. 10 s, which was the time for the sample zone to travel from the ascorbic acid confluence point to
379
the detector, with the absorbance being recorded as the sample passed through the flow-through cell. Relative standard deviations of 0.65,0.93,2.1 and 8.2% were obtained for 20, 10, 5 and 2 mg 1-l antimony standards, respectively, based on ten replicate injections of each standard. Figure 5 shows a calibration graph for the analysis, which also demonstrates its range. The graph is linear in the range O-20 mg 1-l antimony and has a correlation coefficient of 0.999. Even though the graph becomes non-linear at concentrations above 20 mg l-l, it is well defined and reproducible. Above 100 mg 1-l antimony steady-state conditions are achieved, so that all samples yield nearly the same absorbance. The ratio of antimony to phosphorus at the maximum level indicated in Fig. 5 is 1.7 : 1, correcting for dispersion. Although this is 70% greater than the 1:1 ratio previously determined, it is probably due to the increased amount of antimony required to ensure complete formation of the mixed heteropoly complex during the short reaction time allowed in the FIA system. Incorporation of a longer reaction coil in order to allow longer reaction times would probably result in a decrease in this ratio. Although this would provide for an increase in sensitivity, an offset due to increased dispersion of the sample would be experienced. Interference studies were conducted on arsenic and silica because they also form heteropoly complexes with heptamolybdate. For arsenic a slight reduction in absorbance was seen on going from 0 to 100 mg 1-l and for silica a slight increase in absorbance was noted on going from 0 to 100 mg l-l, with both trends demonstrating linearity. For interferent concentrations of 100 mg 1-l or five times the antimony concentration in the system, the errors were - 20% and + 23% for arsenic and silica, respectively. These values correspond to er-
;;; . 0607ti z
06-
2 OS8 “m 04aI
.
03-
-01
!
0
50
100 “lg
150
200
1-l ANTIMONY
Fig. 5. Calibration graph showing the range of the analysis and the maximum antimony concentration that can be determined.
rors of -4% and +4.6% when the concentrations of these interferents are equal to that of the antimony. Accordingly, the technique tolerates the presence of these interferents reasonably well. Extensive interference studies have already been conducted for mixed heteropoly chemistries, albeit not in an FIA system [ 6,22,29-32 1. It may well be assumed that these same species already identified as interferents will also interfere in the FIA method, depending on the relative reaction rates, i.e., if their reactions proceed rapidly enough so as to produce a significant absorbance change during the short residence time in the FIA system. The negative interference of arsenic possibly resulted from the depletion of the effective molybdate concentration and a slow rate of color development for the complex it formed. This would, in effect, decrease the overall amount of color development, resulting in a decrease in the observed absorbance. The slightly positive interference of silica indicates a slightly greater rate of color development.
Conclusion The determination of antimony has typically been done using techniques such as atomic absorption spectrometry, electrochemistry or calorimetric methods in which equilibrium conditions are attained. FIA methods have only been used with atomic absorption spectrometry, incorporating expensive equipment and complex methodologies. This work has shown an effective FIA application for the determination of antimony in the milligrams per liter range using a simple spectrophotometric detector and simple chemistry, thereby reducing analytical costs. The method is based on a fixed-time kinetic measurement of the enhancing effect of antimony on the molybdenum blue reaction and provides analysis times of 30 s per sample. Antimony can be determined in the range O-100 mg 1-l with a limit of detection of 0.5 mg 1-l (twice the peak-to-peak noise level). The analytical range of the method can be extended by increasing the amount of phosphate in the reagent stream, but provides the side-effect of raising the baseline absorbance. Stopped-flow analyses were not favorable owing to significant baseline fluctuations, so only continuous flow was used. However, given data acquisition software with suitable baseline correction features, stopped-flow determinations resulting in enhanced sensitivity would be feasible. The method shows good precision and exhibits small interferences from arsenic and silica except at high concentrations. Because of the kinetic nature of the analysis, the subject of interferences warrants further study wherein current advances in multicomponent analysis predicated on differential kinetics should prove useful.
381 REFERENCES 1 2 3 4 5 6 7 8 9 10 11
12 13 14 15 16 17 18 19 20 21 22 23 24 25 26 27 28 29 30 31 32
F.D. Snell and C.T. Snell, Calorimetric Methods of Analysis, 3rd edn., Vol. II, Van Nostrand New York, 1949, p. 662. S.R. Crouch and H.V. Malmstadt, Anal. Chem., 39 (1967) 1084. P.M. Beckwith, A. Scheeline and S.R. Crouch, Anal. Chem., 47 (1975) 1930. E.B. Sandell and H. Onishi, Photometric Determination of Traces of Metals, 4th edn., Part 1, Wiley New York, 1978, pp. 249-256. H.D. Goldman and L.G. Hargis, Anal. Chem., 41 (1969) 490. L.G. Hargis, Anal. Chem., 41 (1969) 597. J. Ruzicka and E.H. Hansen, Flow Injection Analysis, 2nd edn., Wiley-Interscience, New York, 1988, pp. 303-309. Y. Hirai, N. Yoza and S. Osashi, Anal. Chim. Acta, 115 (1980) 269. S. Motomizu, T. Wakimoto and K. Toei, Talanta, 30 (1983) 333. E.H. Hansen and J. Ruzicka, Anal. Chim. Acta, 87 (1976) 353. Y. Baba, N. Yoza and S. Ohashi, J. Chormatogr., 295 (1984) 153. Y. Baba, N. Yoza and S. Ohashi, J. Chromatogr., 318 (1985) 319. P. Linares, M.D. Luque de Castro and M. Valcarcel, Anal. Chem., 58 (1986) 120. K.S. Johnson and R.L. Petty, Anal. Chem., 54 (1982) 1185. P. Linares, M.D. Luque de Castro and M. Valcircel, Talanta, 33 (1986) 889. S. Motomizu and M. Oshima, Analyst, 112 (1987) 295. M. Malat, Absorpcni Anorganicka Fotometrie, Czechoslovakian Academy of Sciences, Prague, 1973, pp. 466-475. T.A.H.M. Janse, P.F.A. Van Der Wiel and G. Kateman, Anal. Chim. Acta, 155 (1983) 89. N. Zhou, W. Frech and E. Lundberg, Anal. Chim. Acta, 153 (1983) 23. M. Yamamoto, M. Yasuda and Y. Yamamoto, Anal. Chem., 57 (1985) 1382. Y. Sasaki, I. Lindqvist and L.G. Sillen, J. Inorg, Nucl. Chem., 9 (1959) 93. J.J. Cruywagen, J.B.B. Heyns and E.F.C.H. Rohwer, J. Inorg. Nucl. Chem., 40 (1978) 53. C.C. Kircher and S.R. Crouch, Anal. Chem., 55 (1983) 242. A. Cotton and G. Wilkinson, Advanced Inorganic Chemstry, 3rd edn., Wiley-Interscience, New York, 1972, pp. 952-957. J. Murphy and J.P. Riley, Anal. Chim. Acta, 27 (1962) 31. R.H. Campbell and M.G. Mellon, Anal. Chem., 32 (1960) 54. H.A. Mottola, Kinetic Aspects of Analytical Chemistry, Wiley, New York, 1988, pp. 25-36. H.L. Pardue, Clin. Chem., 23 (1977) 2189. B.L. Madison and J.C. Guyon, Anal. Chim. Acta, 42 (1968) 415. R.L. Heller and J.C. Guyon, Talanta, 17 (1970) 865. J.R. Clark and S.M. Wang, Anal. Chem., 26 (1954) 1230. S.R. Crouch and H.V. Malmstadt, Anal. Chem., 39 (1967) 1706.