Security in Cloud Manufacturing: Forecasting and Multi-correlation Techniques for Dealing with Cyber attacks Elvis Pontes, Anderson A. A. Silva, Adilson E. Guelfi, Sérgio T. Kofuji Laboratory of Integrated Systems of the Polytechnic School at the University of São Paulo (EPUSP) – São Paulo, Brazil 55 + (11)
[email protected],
[email protected] [email protected],
[email protected] http://www.pad.lsi.usp.br/ Originally presented in Proceedings of Sixth International Conference on Digital Information Management 2011 (ICDIM)
Abstract— with the advent of globalization and competitiveness all over the world, manufacturing systems are forced to be revised in order to meet three major qualities –data integration, distributed environment and centralized management. To cover the required qualities for the manufacturing systems, Internet based technologies were developed in the last few years. However, even thought collaboration and distributed access in Internet are regularly approached in those technologies; most of the times manufacturing systems do not consider cyber attacks and the inherent security events of the Internet computer systems. The goal of this paper is to propose a Two Stage System for dealing with cyber attacks, which allows: (1) employment of an Event Analysis System for making multi-correlation of security events detected by an Intrusion Detection System and logs from the computer Operational Systems; and (2) applying forecasting techniques on data generated by the Event Analysis Systems to predict future incoming cyber attacks. The obtained results allow concluding about the enhancement of the accuracy regarding forecasts of cyber attacks. Therefore, by anticipating cyber attacks it is possible to improve the manufacturing systems, given by the failure avoidance (considering data integration, distributed environment and centralized management). Keywords: event multi-correlation, cloud manufacturing, cyber attacks, false positives, intrusion forecasting, manufacturing systems
Introduction Companies from the productive sector have always been looking for integration among manufacturing process, information management models and resource sharing (Lan 2009). With globalization and the consequent increasing of competition among companies, technology has became an important ally for business, allowing data integration and distributed environments in a dynamic manner, by the use of a so called Internet Based Manufacturing (Tian et al 2002). There are diverse models which explore the Internet as a way for integrating productive process, like: Computer Integrated Manufacturing (CIM) (Tian et al. 2002), Agile Manufacturing (AM) (Mehrabi et al 2000), Network Manufacturing (NM) (Chen et al. 2001) and Manufacturing Grid (MGrid) (Tao, Hu, Zhou 2008), among others. In this context, the Cloud Manufacturing (CMfg) (Zhang et al. 2010; Luo et al. 2011) is a model which combines the use of emergent computer techniques (cloud computing, virtualization and service oriented technologies), with advanced business models for manufacturing regarding the integration of productive processes (Tao et al. 2011), presenting advantages as effective collaboration and making access and the data processing easier (Xu 2011).
1
In other hand, manufacturing models are becoming closer to the network related technologies, what brings up inherent problems of the computer systems, like cyber attacks and the consequent requirements of security (Pontes et al 2011A). Cyber attacks can be classified as a set of actions intending to compromise the integrity, confidentiality or availability of computer systems (Feitosa et al 2008). Cyber attacks can be caused by users or malicious software, which try either to obtain access, to use systems in an unauthorized way, or to enumerate privileges (Scarfone and Mell 2007). Reference (IC3 2010) published a study in the United States about losses in 2009 concerning cyber attacks: frauds in cyber space caused about $559.7 million of losses in 336,655 organizations. This was a 111,5% increase for the losses and a 22.3% increase for the complaints, as compared to 2008 when 275,284 complaints were received, reporting $264.6 million in total losses. In 2009 the largest reported volumetric Distributed Denial of Service (DDoS) attack exceeded 49 Gbps sustained towards a single target in Europe. Beyond sheer attack size cyber attacks become more sophisticated, with attackers expressly aiming to exhaust resources other than bandwidth, such as firewalls, load-balancers, back-end database infrastructure and associated transaction capacity, cached data serving algorithms, etc (McPherson and Labovitz 2010). In relation to DDoS, it is expected these attacks to become more common against independent media and human rights sites in 2011, as the recent highly publicized DDoS attacks on Wikileaks, and “Operation Payback” attacks by “Anonymous” on sites perceived to oppose Wikileaks (Zuckerman et al. 2010). Nowadays, Intrusion Detection and Prevention Systems (IDPS) are regularly employed for monitoring, detecting and/or blocking cyber attacks (Scarfone and Mell 2007). However, two deficiencies of IDPS can be mentioned: (1) it usually results in a huge amount of data (alerts like False Positives - FP) (Silva and Guelfi 2010); (2) it relies on reactive approaches, as attacks are identified and/or blocked most of the times only after they can inflict serious damage to the computer systems (Pontes and Guelfi 2009). One way for improving the analysis of data is to correlate information between them, looking for similar characteristics that may be related (Silva and Guelfi 2010; Abad et al. 2003). Throughout correlation it is possible to eliminate redundant and false data, to discover attack patterns and understand attack strategies (Ning and Cui 2002; Zhay et al. 2006; Ning et al. 2002; Zhay et al. 2004; Pontes et al., 2009). Nevertheless, event correlation may be challenging as it depends on the reliability of the source of security alerts (Silva and Guelfi 2010). Therefore, the level of precision of detection tools is an important issue for validating correlations. Multi-correlation or integration of alerts with information from different sources, e.g. tools for monitoring or operating system logs, can allow a new classification for alerts, improving results accuracy (Abad et al. 2003; Zhay et al. 2006). References (Abad et al. 2003; Zhay et al. 2006; Zhay et al. 2006) employed multi-correlation; however, neither a detailed analysis of the influence of individual alerts in the rates of FP nor forecasting techniques were applied to the prediction of future attacks. According to (Pontes and Guelfi 2009A; Pontes et al., 2009; Pontes and Guelfi 2009B; Pontes and Zucchi 2010), an early warning system showing a future trend outlook with an increasing number of cyber attacks, exposed by forecasting analysis, may influence decisions on the security devices adoption (e.g. rules in IDPS combined with rules in firewalls) before incidents happen, according to the needs. Forecasting analysis in the information security area can be similar to forecasting methodologies used in other fields: meteorology, for instance, use sensors to capture data about temperature, humidity, etc (Lajara et al. 2007; Lorenz 2005) seismology employs sensors to capture electromagnetic emissions from the rocks(Bleier and Freund 2005); for economics, specifically stock market, data is collected from diverse companies (annual profit, potential customers, assets, etc) to draw trends about shares of companies (Prechter and Frost 2002). For any field formal models can be applied to predict events over the collected data. Notwithstanding, before applying formal models, data regarding different kind of variables should be correlated (Armstrong, 2002). According to (Armstrong 2002), to obtain a more accurate and realistic result about predictions it is suggested: (1) to use diverse forecasting techniques; (2) to analyze information regarding diverse variables and acquired data, from sensors for instance; (3) to employ diverse kind of employed forecasting models. Concerning forecasting in IDPS, (Lai-Cheng 2007; Yin et al. 2004) employed forecasting models, though they used just one formal method for predicting events and they did not make use of any kind of correlation process. In other hand, in our earlier works we proposed the Distributed Intrusion Forecasting System (DIFS) (Pontes and Guelfi 2009; Pontes and Zucchi 2010), which 2
covered the following gaps of today’s forecasting techniques in IDPS: a) the use of few sensors and/or sensors employed locally for capturing data; b) the use of just one forecasting technique; and c) lack of information sharing among sensors to be used for correlation. Notwithstanding, we faced huge amount of alerts which could have negative influence over forecasting results. In this paper, security events for cyber security are actions, processes that have an effect on the system, disregarding the kind of the effect – in other words, actions that could result in positive or negative effects on the system. In other hand, security alerts are types of security events, indicating anomalous activities or cyber attacks (Silva and Guelfi 2010). Therefore, the goal of this paper is to propose a Two Stage System (TSS) which allows: (1) in the first stage it is possible to make multi-correlation of security events using an Event Analysis System (EAS); and (2) to apply forecasting techniques on the data generated by the previous stage (EAS) to predict future incoming cyber attacks. This paper is organized as follows: state of art concerning Cloud Manufacturing, event correlation and forecasting in IDPS are in section 2. Section 3 presents the proposal of this paper and details about the tests and environment created to validate the TSS. Results are analyzed in section 4 and section 5 summarizes conclusions and suggestions for new studies.
Event Correlation and Forecasting in the Cloud Manufacturing This section regards 1) the concept of Cloud Manufacturing (Armbrus et al. 2009; Xu 2001); 2) event correlation for detecting cyber attacks and incidents related to computer systems (Silva and Guelfi 2010); and 3) forecasting methods used to predict events (cyber attacks) on computer systems (Pontes and Guelfi 2009), (Pontes and Zucchi 2010). Cloud Manufacturing There are diverse concepts in the models of CMfg, but the main ones are cloud computing and smart manufacturing processes, according to Armbrus et al. (2009). Two services are essential in Cloud Computing: applications delivered as a service over the Internet and the datacenters which provide hardware (servers, routers and network infrastructure) and software (applications, security and data) required for user interaction. This kind of software is known as Software as a Service (SaaS) or on-demand software. In fact, the cloud computing concept is not new, but just recently it has become commercially useful, offering low costs and compatibility between APIs (Application Programming Interface), data encryption, VLANs (Virtual Local Networks), firewalls, geographic scalable storage, backup services (Armbrus et al. 2009). (Xu 2001) points out that SaaS is just part of the model required for the cloud computing to work. Platform as a Service (a development platform that includes diverse systems and environments) and Infrastructure as a Service (a method of payment in which the customer only pays what he uses) are also part of the application service delivered by a provider through:
Customer Relationship Management (CRM);
Web services, service oriented architecture (SOA);
Quality of Service (QoS), fault tolerance;
load balancing and virtualization management.
Another important concept is the Smart Manufacturing, a set of features based on software developments that improves the manufacturing processes (reducing time for the tasks to be executed), optimizing activities and supporting the task management. New methods and production procedures support comparisons that can be made between current employed production settings and expected production settings as well, in order for sizing the current state of production plants and, consequently, making earlier detection of anomalous conditions from manufacturing plants (Whitel 2003). CMfg is based on service-oriented networks that allows centralized management, distribution and sharing of the human resources and manufacturing skills, mainly if they are geographically dispersed. In a CMfg model, assorted resources and abilities can be monitored, connected and managed through the Internet with support for any network technology (e.g. wireless and different protocols) and any manufacturing processes (Zhang et al. 2010; Tao et al. 2011). 3
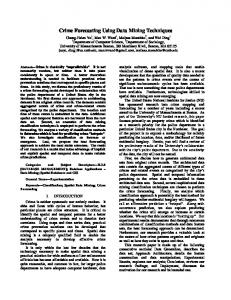
CMfg model can focus on the Business Process Management (BPM) applications such as Customer Relationship Management (CRM) and Enterprise Resource Planning (ERP) functions (Xu 2011). Nevertheless, the main feature of the CMfg model is the ability to integrate different production models. For example the study conducted by (Zhang et al. 2010) uses a method of integration of resources with more complex tasks, called Composition Resource Service (CRS). The flexibility management of the CMfg model is used to solve dynamic changes that affect CRS. There are other models to make integration of manufacturing process and network services, like: Agile Manufacturing (AM), Network Manufacturing (NM), Manufacturing Grid (MGrid), Computer Integrated Manufacturing (CIM). However, in cloud computing environments, CMfg is proposed as it has higher efficiency, low consumption of IT resources (as workstations, servers, software and infrastructure for maintaining servers) and it combines production processes and information technology, enabling virtualization, web semantics and integration of information in the entire life cycle of production. Figure 1 illustrates the architecture of CMfg system (Luo et al. 2011; Tian et al. 2002).
Figure 1 – Architecture of CMfg model (Tao et al. 2011) The architecture of CMfg system illustrated on Figure 1 has some layers (Tao et al. 2011): -
Resource layer: ensures that resources and abilities required by manufacturing processes can be accessed by users as services;
-
Perception layer: ensures sizing of resources and abilities can be connected to network for data generation;
-
Resource Virtualization layer: is related to virtualizing manufacturing resources and abilities, transforming them into cloud services;
-
Cloud Service layer: concerns two different kinds of services - Manufacturing Cloud Service (MCS), which is the result of transforming resources and abilities in accessible service by users; CMfg Core Services which are the main services supporting management and access by operators, providers and consumers in description, registry, publication, evaluation, match and search operations;
-
Application layer: involves development of applications based on specific requirements making integration between manufacturing process and MCfg platform (e. g. computer applications customized to manufacturing process and ERP);
-
Portal layer: provides interfaces to allow interaction between men and machines in access and invoke MCSs in CMfg;
-
Enterprise Cooperation Application layer: accomplishes different types of cooperation application, including in: commerce, business, design and manufacturing in both of services (MCS and CMfg Core Services) included in Cloud Service Layer;
-
Knowledge layer: provides essential knowledge for the other layers;
-
Cloud Security layer: concerns providing different kinds of security processes and methodologies for the CMfg platform; 4
-
Wider Internet layer: concerns providing the base environment to every resources, services, users and operations connected in the CMfg platform.
Although, the inherent problems found in computer systems are present in the CMfg model, as the CMfg model is implemented networks based technologies. (Xu 2011) emphasizes the worries about intellectual properties managed by external entities on remote servers in the cloud, as well as the sharing of data regarding customers, consumers, employees and business know-how. The research developed by (Lan 2009) brings out issues like alerts about security management mechanisms that are required to specify different levels of accessibility permissions for different users, the requirement of data encryption transaction methodologies and possible damages caused by virus, trojans and unauthorized access. Luo et al. (2011) proposes a division of the CMfg model in three view models: function view model, network view model and running view model. The network view model is divided in four parts (Luo et al. 2011), as depicted by Figure 2: -
resources network: it connects all kinds of manufacturing resources, such as software (data and programs) and hardware (machines, computers and logistic processes);
-
sensor network: centralizes, executes and integrates information from various sensors (bar code readers, data collectors, Global Positioning System (GPS) and Radio Frequency Identification (RFID));
-
communication networks: different networks and protocols that operate in the cloud manufacturing;
-
application network: devices that can provide services and interact with the cloud manufacturing.
Figure 2 – Cloud manufacturing network view mode (Luo et al. 2011) The network-view model allows risks from cloud computing systems to be isolated and minimized. However, even though some security aspects are considered by (Tao et al. 2011; Kuo et al 2011), CMfg does not neither approach correlation nor forecasting for security events and cyber attacks.
Correlation Approaches for Security Events (Silva and Guelfi 2010) Correlation techniques for security events can be classified into three categories: (1) rule-based, (2) based on anomaly and (3) based on causes and consequences (Prerequisites and Consequences (PC)) (Abad et al. 2003). The rule-based method requires some prior knowledge about the attack, so the target machine has to pass through a preparation phase called training. The goal of this phase is to make the target machine able to preciseness detect the vulnerabilities in which the target machine was trained for (Abad et al. 2003; Mizoguchi 2000). Gaps of rule-based method are: (1) it is computer intensive; (2) it results in lots of data; (3) the method works only for known vulnerabilities.
5
The method based on anomaly analyzes network data flow, using correlation by statistical methods, using accumulation of gathered information and using observations of the occurred deviations throughout processes of network data flow; in a manner to allow detecting new attacks. For instance, (Manikopoulos and Papavassiliou 2002) demonstrates a system for detecting anomalies which is characterized by monitoring several parameters simultaneously. Reference (Valdes and Skinner 2001) presents a probabilistic correlation proposed for IDPS, based on data fusion and multi-sensors. However, the method which uses anomaly cannot detect anomalous activity hidden in a normal process, if it is performed at very low levels. Besides, as this method analyzes normal processes reporting only wrong deviations, hence the method is not suitable for finding causes of attacks (Ning et al. 2002). The method PC lies on connections between causes (conditions for an attack to be true) and consequences (results of the exploitation of a cause), in order to correlate alerts based on the information gathered. This method is suitable for discovering strategies of attacks. Both causes and consequences are composed of information concerning attributes of alerts (specific features belonging to each alert) and are correlated. Arrangement of attributes is called tuple. According to Figure 3, for the connections to be valid, a preparatory alert must have in its consequences at least one tuple, which repeats in the causes of the resulting alert. In other words, the preparatory alert contributes to the construction of the resulting alert, and therefore it can be correlated. For this connection, illustrated by Figure 3, the timestamp of the preparatory alert has to come before the resulting alert (Silva and Guelfi 2010; Pontes and Guelfi 2009; Ning et al. 2002).
Figure 3 - Connections between alerts - consequence of preparatory alert (SID1) is connected to prerequisites of resulting alert (SID2) (Pontes et al. 2011A). In order to reduce complexity, correlation can be shown in graphs where alerts are represented by nodes and connections are depicted by arrows (representing correlations between alerts). Yet, some gaps in the PC method may be mentioned, such as the difficulty in obtaining causes and consequences of alerts (Pietraszek an Tanner 2005), the impossibility to analyze isolated alerts (alerts that are not correlated) and the fact that missed attacks are hard to correlate. An alternative to minimize the problem is to apply complementary correlation techniques (Morin and Debar 2003), using sensors to work in cooperation, in order to supervise the environment for minimizing missed detections. There are two techniques to map IDPS’ alerts and logs obtained from other sources: descending analysis and ascending analysis (Abad et al. 2003; Silva and Guelfi 2010B). Descending analysis is based on the investigation of occurred attacks, verifying (correlating) whether other logs (e.g. logs from O.S.) have or do not have vestiges of the attacks’ incident. For occurred attack, other traced logs (e.g. Operational System’s logs) can be analyzed based on timestamp. This type of analysis is useful to trace evidences about strategies of events, in order to map attacks to its source. The ascending technique is used to discover attacks by the analysis of several logs. Once an anomaly is detected in one of these logs, other logs are checked based on timestamp. Although ascending technique is computer intensive, this technique allows detecting new attacks. In an earlier work we proposed the EAS (Silva 2010, Silva and Guelfi 2010), intending to improve results of security events correlation and intrusion detection. EAS is able to make multicorrelation for events from Operational Systems (OSs) and from IDPS (log analysis), consequently, EAS is also capable for verifying the influence of isolated alerts in the cyber-security context. The EAS architecture has 4 modules, as shown by Figure 4: (a) converter: the aim of this module is to handle the input data into the system (IDPS signatures, alerts and logs from the OS); (b) updating: it controls data which is going to be used by the system; (c) correlating: it does mappings for the correlation processes, FP identification, and the identification of isolated alerts; (d) calculator: it analyzes and compares FP, based on the results from the correlating module.
6
Figure 4 - EAS’s architecture (Pontes et al. 2011) For the EAS to assess FPs, three steps are defined (FP1, FP2 and FP3): FP1 is done after correlating alerts from the IDPS, in order to identify eventual isolated alerts and FPs related to normal behavior of the system; FP2 identifies residual isolated alerts; FP3 identifies isolated alerts just after multi-correlation, FP3 assess rates between FPs and isolated alerts. Converter module (a) Converter module (a) makes conversion and fields classification, reordering signatures of the IDPS in a data base. In this table, fields are classified as main fields and secondary ones, which can be sub classified as: causes (P), consequences (C) or both (PC). Fields are going to feed the correlating module (c). Main fields contain details regarding alerts, showing source and destination of attacks, as depict by Table 1. In the other field it is listed attributes from signatures concerning specific details of alerts, as CLASSTYPE, MSG, REFERENCE, and other details.
Field Proto Origem porta_o Direção Destino porta_d SID
Table 1 - Alert main fields Description Alert´s protocol Alert´s source IP Alert´s source port Alert´s direction Alert´s destiny IP Alert´s destiny port Alert´s ID
Correlating Module (c) This module creates two tables for correlating tuples and detected alerts. Inside the Correlating Module (c) it is necessary to run the sub modules FP1, FP2 and FP3. In Table 2 (Standard Tuples Table), there are tuples which could be whether causes or consequences of detected alerts. In Table 3 (Correlating Table), the detected alerts (SID) are recorded in rows and some attributes (SERVICE – main service regarding the alert; VULNERAB – main vulnerability of the alert; EXCLUSIVE – exclusive Operating System (OS) of the alert; VIA – way in which vulnerabilities are exploited) are recorded in the fields CLASSTYPE, REFERENCE and MSG.
Tuples exe_usu inv_usu exi_ser exi_hos ace_inf ace_rec ace_ser exi_vul
Table 2 - Standard tuples table Description Tuples user-execution inv_adm user-invasion exe_adm true-service ind_sis true-host ind_red information-access ind_ser feature-access ind_inf service-access ind_rec true-vulnerability dis_inf
Description administrator-invasion administrator-execution system-unavailability network-unavailability service-unavailability information-unavailability feature-unavailability information-availability
Table 3 - Example of correlating table (highlighted link between preparatory alert SID 15930 whit resultant alert SID 1594) 7
Tuples are recorded whether with “P” (cause), or “C” (consequence) or “PC” (both cause and consequence). For correlating different types of alerts, a tuple recorded as “C” or “PC” can be linked to another, which has the same tuple “P” or “PC” (see Table 3), ever since the timestamp of the first alert (preparatory) is before of the second one (resulting). As a result, Correlating Module (c) creates a graph called c1.
Sub Module FP1 Activities of the Sub Module FP1 are: cutting links, adding links, identifying isolated-FP1 and identifying FP-FP1. Cutting links is a filter for the graphs (c1), as many links are whether not real, or are in a wrong position, so they can be discarded from the graphs when no one of the following criteria are satisfied: (a) contents of the MSG field of the preparatory alert have bonds to MSG field from the resulting alert; (b) the source IP (or destination) of alerts points toward a specific address, as destination address (or source) of other alerts; (c) alerts runtime (timestamp) are close to each other. Even though, this is not a definitive feature, as after all alerts may occur with distant timestamps when a preparatory attack is happening; (d) the SERVICE field of the preparatory alert is whether the same or has bonds to the SERVICE field from the resultant alert; (e) the content of the VULNERAB field of the preparatory alert indicates some kind of relation with the VULNERAB field from the resultant alert; (f) the content of the VIA field of the preparatory alert is identical or has some bonds with other field from the resultant alert; (g) inside of the Local Area Network (LAN), alerts come from the same source; (h) field PORTA_O of a preparatory alert is inside of a range which matches to ranges of the PORTA_D field of a resultant alert. Adding links: it is possible to come out links between nodes which were not originally linked. Those links are made manually by the same criteria used for the cutting links. Identifying isolatedFP1: isolated alerts are shown in nodes without arrows and are eliminated from the graph. Identifying alerts FP-FP1: based on deleting sequences of nodes which represent normal behavior for the OS, e.g. ICMP requests. As a result, alerts FP-FP1 are eliminated and a new graph is created (FP1).
Sub Module FP2 It is in charge of identifying isolated-FP2: the same adopted criteria for isolated is used. Possible isolated alerts from the previous module FP1 are deleted and a new graph (FP2) is created.
Sub Module FP3 The sub module FP3 is in charge of mapping, the ascending/descending analysis, validating nodes, validating links, identifying FP-FP3, identifying isolated FP3 and mapping isolated FP1FP2-FP3. Mapping means to correlate the IDPS alerts with the OS logs, by the analyses of timestamps and using a table with IDPS alerts linked to logs from the OS. Ascending/Descending Analysis completes the mapping processes, as it compares services and operations from IDPS signatures with information from detected logs of the OS. Table 4 describes fields which are used in the mapping process for the ascending/descending analysis. Two modes are used in the ascending/descending analysis: node validation and link validation. In the node validation it is checked if the IDPS alerts have events (processes, files, registry operations) with confirmation status in the OS. The adopted criteria to validate alerts are as follows: (1.1) when source and/or destination of connections are the gateway machine; (1.2) when the main service of the alert is present in fields PROCESS_IN, IMAGE_PATH or COMMAND_LI with the same timestamp. (1.3) when the main operation regarding alerts is present in fields OPERATION or DETAIL with same timestamp; (1.4) when secondary services of the alert are one of the fields PROCESS_IN, IMAGE_PATH or COMMAND_LI with same timestamp; (1.5) when a secondary operation of the alert is present in fields OPERATION or DETAIL with same timestamp; (1.6) when the main operation of the alert is present in the fields PROCESS_IN, IMAGE_PATH or COMMAND_LI with same timestamp; (1.7) when the main service of the alert is present in the OPERATION or DETAIL fields, with same timestamp; (1.8) when a secondary operation of the alert is present in the fields PROCESS_IN, IMAGE_PATH or COMMAND_LI with same timestamp; (1.9) when the secondary service of alerts is present in the fields OPERATION or DETAIL with same timestamp; (1.10) when whether the main or secondary
8
service of the alert is present in the fields PROCESS_IN, IMAGE_PATH, COMMAND_LI, DETAIL or PATH, with different timestamp. Table 4 – Description of fields used in the mapping process Field Description Local process_na
Executed process
OS
image_path
Process path
OS
event_class
Event class (file, registry or process)
OS
operation
Event operation (read, write, create, etc.) OS
Path
Event feature or event registry path
OS
Detail
Aditional information from an event
OS
Pid
Process ID
OS
parent_id
Parent process ID
OS
command_li Process command-line
OS
process1
Alert main service
IDPS
process2
Alert secondary service
IDPS
operation1
Alert main operation
IDPS
operation2
Alert secondary operation
IDPS
Criteria 1.1 to 1.9 are classified as descending analysis. But criteria 1.10 is classified as ascending analysis and shows alerts which must be discarded from the graph, as it highlights services which are not part of settings for the gateway machine. Validating links verifies whether the present events in the OS confirm possible links between nodes. Adopted criteria are: when the Process Identifier Number (PIN) of the resultant node is son of the preparatory node; (2.2) in case it appears coincident details listed in the content of the field DETAIL from the preparatory and resultant nodes; (2.3) when contents of the field PATH of the resultant node is equivalent or complementary to the preparatory node. After that a new graph (FP3) is generated. The FP3 graph contains alerts from the IDPS which were already mapped to the logs from the OS, with alerts which do not fit to the criteria 1.10. For identifying FP-FP3, alerts which were not validated in the previous phases (nodes validation and links validation) receive a label as FP-FP3 and are discarded from the graph (FP3). For identifying isolated FP3, by excluding alerts FP-FP3, it is possible to identify and delete new isolated alerts from the graph (FP3). For mapping isolated FP1, FP2, FP3, the next phase concerns the remaining isolated alerts which have last from the phases FP1, FP2, FP3, and which are analyzed just on the node validation mode. As a result, Correlating module (c) sends all data to the Updating module (b), which sends the data to the Calculator module (d) for control and monitoring. With the employment of the EAS it was possible to improve the current results of security events correlation considering the following issues: (1) traceability for causes and consequences within the PC-correlation method which confirm that individual alerts can be grouped in a single attack, since they are part of the same attack strategy; (2) the process of results validation regarding the correlation. The results of correlating phase were evaluated in three steps (FP1, FP2 and FP3) using tables and graphs. The stepwise analysis allowed comparing results. EAS reached an increase of 112.09% in the identification of FP alerts after the multi-correlation (Silva 2010), (Silva and Guelfi 2010). Even though correlation approaches security events and cyber attacks that may occur in CMfg environments, (Silva and Guelfi) does not approach forecasting methodologies for predicting security events and cyber attacks. Forecasting Approach (Pontes and Guelfi 2009) The forecasting approaches in IDS lie mainly on stochastic methods (Ramasubramanian, and Kannan 2004; Alampalayam and Kumar 2004; Chung et al. 2006). With no attention about predictions, references (Ye et al. 2001; Ye et al. 2006, Wong et al. 2006) applied diverse probabilistic techniques (decision tree, Hotelling’s T² test, chi-square multivariate, Markov chain and Exponential Weighted Moving Average (EWMA)) on audit data as a way to analyze three 9
properties of the UIT: frequency, duration, and ordering. Reference (Ye et al. 2001; Ye et al. 2006) has come to the following findings: 1) The sequence of events is necessary for IDS, as a single audit event at a given time is not sufficient; 2) Ordering (transaction (Wong et al. 2006)) provides additional advantage to the frequency property, but it is computationally intensive. Frequency property by itself provides good intrusion detection (Ye et al. 2001; Ye et al. 2006, Wong et al. 2006). References (Ye et al. 2001; Ye et al. 2006, Wong et al. 2006) did not approach correlation for IDPS. Moving averages (simple, weighted, EWMA, or central) with time series data are regularly used to smooth out fluctuations and highlight trends (NIST SEMATECH 2009). EWMA may be applied for auto correlated and uncorrelated data for detecting cyber attacks which manifest themselves through significant changes in the intensity of events occurring (Ye et al. 2001). Both (EWMA for auto correlated and uncorrelated) has presented good efficiency for detecting attacks. EWMA applies weighting factors which decrease, giving much more importance to recent observations while still not discarding older observations entirely. The statistic that is calculated is (Roberts 1959): EWMAt = αYt + (1 – α)EWMAt-1
for t=1, 2, …, n.
(1)
Where: EWMA is the mean of historical data; Yt is the observation at time t; n is the number of observations to be monitored including EWMA; 0