J1.2
VERIFICATION OF SUPERCELL MOTION FORECASTING TECHNIQUES Roger Edwards*, Richard L. Thompson and John A. Hart Storm Prediction Center Norman, OK 73069
1. INTRODUCTION AND BACKGROUND Prognostic techniques for storm motion are crucial to Lagrangian-framework (storm-relative) evaluations of parameters such as helicity and wind velocity, which can be used to assess the potential for supercell formation, and for the risk of supercellular tornadoes. Several storm motion prediction methods have attained widespread operational and research use, the most common being Maddox (1976) variations which apply a 30o rightward and 75 percent of mean wind assumption (hereafter 30R75), a 15o rightward and 85 percent of mean wind assumption (adapted from Johns et al. 1993; hereafter 15R85), and more recently the Bunkers et al. (2000; hereafter Bunkers) algorithm. This examination evaluates the performance of those three techniques using observed storm motions and Rapid Update Cycle 2 (RUC-2) model proximity soundings (Thompson et al. 2002a) for a nationwide database of 452 observed supercells (six cases were omitted from the full 458 supercell data set). Also tested was the assumption that the mean wind through the 0-6 km layer above ground level (AGL) represents storm motion. Simple statistical comparisons of observed supercell motions to algorithm-based storm motions are made for the full storm set, as well as subsets of tornadic and nontornadic supercells, in order to evaluate the utility of these storm motion prediction techniques.
rightward deviance, if any, has been operationally observed to become more pronounced). The observed motion for each supercell was computed using a distance/direction tracking component of Storm Prediction Center (SPC) operational software. Motions were derived from real-time WSR-88D reflectivity displays, following the storm centroids through a series of volume scans lasting > 30 minutes per storm. Computations were made using the entire supercell database along with three subsets based on presence and damage rating of associated tornado(es), as recorded in Storm Data. The subsets were: significant tornadic ( sigtor, F2 or greater damage), weak tornadic (weaktor, F0-F1 damage), and nontornadic (nontor). Across the spectrum of observed and estimated (Bunkers, 30R75, and 15R85) supercell motions, we computed mean supercell speeds, as well as mean u and v wind components. Mean errors were also calculated for the three storm motion estimates across the three supercell subsets, and the entire data set. Of the total supercell set, sigtor storms comprised 56 total (12.4%). There were 151 weaktor supercells (33.4%). Of all supercells, just over half ( 54%) were nontornadic.
2. METHODS Storm motions may vary with time during the life span of a supercell. Here, the “observed” motion used as the test basis was sampled within approximately one hour of the tornadic phase for tornadic storms, and at least an hour after convective initiation for all others (when *
Corresponding author address: Roger Edwards, Storm Prediction Center, Norman, OK. E-mail:
[email protected]
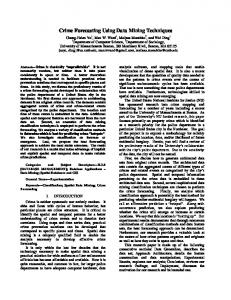
Figure 1. Mean observed storm speed for the following supercell groups: significant tornadic (sigtor), weak tornadic (weaktor), nontornadic (nontor), and all supercells (allsuper).
3. RESULTS AND CONCLUSIONS One hypothesis was that predicted and observed storm motions would decrease across the tornadic spectrum from sigtor to nontor; however, such was not quite the case with the observed motions. Mean observed supercell speeds were greatest for sigtor supercells at ~27 kt, but virtually identical for weaktor and nontor storms at ~23 kt (Fig. 1). However, unlike the mean of the observed storm speeds, each of the storm motion forecast techniques followed the hypothetical trend (e.g., Fig 2). Bunkers most closely approached the observed trend across means for the weaktor and nontor supercell subsets.
Bunkers for each supercell breakdown, and therefore all supercells, was 15R85. For each supercell category and for the supercell database as a whole (Fig. 3), Bunkers was the closest in the mean to observed storm speed and to the mean u and v components (not shown).
Figure 3. Mean storm speed error (forecast minus observed) for the following storm motion algorithms: Bunkers et al. (2000, Bunkers), the 0-6 km mean wind (mean wind), Maddox (1976, 30R75), and an adaptation from Johns et al. (1993, 15R85).
Figure 2a. As in Fig. 1, except for 30R75 storm motion estimate.
Observed v (not shown) was negative only for nontor storms. The only motion predictor showing the southward mean for nontor storms was Bunkers (Fig. 4), whose average motion was farther south from observed mean by 1.1 kt. Bunkers most closely matched observed v for each supercell subset (not shown). Even the 30R75 v component, the most rightward of the
Figure 2b. As in Fig. 1, except for Bunkers storm motion estimate. The fastest storm speed predictor was the mean wind, since the other techniques intrinsically incorporate fractions of the mean wind speed into their algorithms. Of the two Maddox-type variations tested, the one most closely matching
Figure 4. Bunkers v component storm speed errors for the three supercell subsets, and all supercells.
predictors, was slightly positive. All motion algorithms forecast the tendency for decreasing v down the spectrum from sigtor to weaktor to nontor storms, as observed. However, the predictor showing smallest mean error for v across all supercell sets was Bunkers. In fact, Bunkers was the only technique to show a negative mean error in the weaktor and nontor subsets, as well as for all supercells. The sigtor storms had the largest average observed u among the supercell subsets; likewise, all motion predictors (including mean wind) correctly assigned the largest u components to the sigtor storms. Observed u increased by 2 kt from weaktor to nontor storms (not shown). All motion forecast techniques showed this tendency except 30R75, which decreased u along the tornadic spectrum from sigtor to nontor. The largest mean error for u in the nontor set was with 30R75 motions, and the smallest with Bunkers. The smallest mean error for u for sigtor storms was with each of the two Maddox-type motions; Bunkers was the only technique to predict a zonal motion too fast in the mean for sigtor supercells (not shown). However, Bunkers showed the smallest mean errors in v and speed for sigtor storms (Fig.5).
The distribution of supercell speeds for each motion technique, and across the spectrum of supercell sets, is presented in Fig. 6. The 30R75 algorithm was, by far, the poorest predictor of storm speeds across the entire supercell database. Notably, 30R75 was too slow for nearly 75% of tornadic storms, and its even poorer performance for nontornadic storms placed its inner quartiles below zero for ths supercell data set as a whole. For all supercells collectively, the mean wind technique appears best; however its reliability is questionable because of its great variation within the spectrum. The mean wind showed the largest shift between subsets – overforecasting speeds for about 75% of tornadic supercells but showing a slight underforecasting tendency for the much larger nontor subset. The best predictor for sigtor storm speeds was simply taking 15% of the mean wind, as evident in the 15R85 distribution, which is slightly more concentrated around zero error for both the inner quartiles and the 10% to 90% distributions than Bunkers. Both, however, appear well-balanced as supercell speed predictors in sigtor situations. Based on our sample of RUC-2 model proximity soundings, the most reliable and consistent overall supercell motion predictor in the set was Bunkers, corresponding well to the findings of that technique’s developers. Observed nontor supercells tended to show the farthest rightward (southward) deviance, on average, through both the observed and all motion predictors. This was antihypothetical, given long-held operational associations between deviant motion, enlarged hodograph size and tornadic potential.
Figure 5. As in Fig. 3, except for mean u component storm speed errors. Mean absolute errors (MAE) on sigtor speeds for both Bunkers and 15R85 were