Both for demand and supply, the study initially set the indica- tor, which is ..... regional employment service and district employment centers;. ⢠..... The calculations showed that the most advanced services were offered by auxiliary personnel in the field of .... UK. Commission for Employment and Skills, Wath on Dearne, 110 p.
SocioEconomic Challenges, Volume 2, Issue 1, 2018
Forecasting Supply and Demand In the Regional Labor Market: In Search of Optimal Proportions of Financing Vocational Education Institutions In the Region Tetyana Vasilyeva Doctor of Economics, Professor, Director of Oleg Balatskyi Academic and Research Institute of Finance, Economics and Management, Sumy State University, Ukraine Serhiy Lyeonov Doctor of Economics, Professor, Economic Cybernetics Department, Sumy State University, Ukraine Liliana Lopa PhD Student, Sumy State University, Ukraine Abstract The main mission of institutions of vocational education is to provide the regional labor market with the necessary personnel, and this is possible only if the network of educational institutions and the list of specialties for which graduates are prepared will be brought into line with the needs of the local labor market. That is why the basis for reforming the system of financing the vocational education institutions in the region should be based on scientifically based forecasts of demand and supply for the relevant working professions. In many countries of the world, funding of colleges, technical colleges and other vocational education institutions is entrusted to local budgets. That is why before allocating funds for the preparation of skilled workers of a particular profession, one must clearly understand the need for these specialists in the regional market. Therefore, the issues of material and technical and financial support for regional institutions of education are directly related to the monitoring of the needs of the regional labor market, the definition of rare occupations. The article analyzes the existing methods of research and forecasting the labor market, identifies their main advantages and disadvantages. The author’s model is proposed, which is based on the evaluation of supply and demand for the relevant category of labor. Both for demand and supply, the study initially set the indicator, which is the basis for calculations (the calculation base), and then this figure was multiplied by a number of correction factors to take into account factors that affect their change. The mechanism of their calculation and the correlation mechanism for each type of economic activity are proposed. Keywords: demand, supply, labor, labor market outcomes. JEL Classification: J2, J23. © The Authors, 2018. This article is published with open access at Sumy State University. Introduction The development of the economy of any country requires an increase in the effectiveness of the use of human resources. The key task of the modern stage of the development the regional economy in the context of transition to the innovative development is the harmonization of the links between the sphere of education and the labor market. The modern state of the development of the labor market is characterized by structural and dynamical changes that are manifested in the intensification of competition between employers for attracting more qualified workers, raising professional requirements for personnel due to the rapid development of information technologies in various spheres of economic activity, etc. The definition of the demand for the labor market of a country or a certain region in specialists is determined by at least two main factors, namely: 1) the necessity to take into account current and forecast trends ‒ demand on the labor market determines exclusively the demand for certain professions and requirements for the level of nd qualification; 2) educational reforms and administrative and territorial division (financial decentralization), which provide for a change in the authority and responsibility for the training of individual specialists. 69
SocioEconomic Challenges, Volume 2, Issue 1, 2018
For a qualitative breakthrough in solving the problems of the formation of full-fledged forecasts of the labor market, it is necessary to develop conceptual methods and scientifically based forecasting methods. When forming labor market forecasts, it is necessary to focus on the needs of a certain territory (region, city, territorial community) in the graduates of the educational institutions in the context of effective budget use of local communities and take into account the forecasted tendencies of socio-economic development of this territory in order to carry out the building the personnel potential of the territory considering its development strategy. Literature review Existing methods of research and forecasting of the labor market, scientific works of researchers, reports of expert commissions were recommended for the selection of methodology, methods and tools of research. As evidenced by the analysis, each country has a number of academic and government institutions and organizations engaged in the development of forecasts of structural shifts from the economic indicators, including indicators of employment by type of qualifications, occupations, types of economic activity, industries by sex, age, nationality, employment status and the like. The forecasts are given mainly in the medium term and adjusted on average once a year. Many models consider the impact of technological and social changes in economic structure, global economic conditions, changes in consumer preferences, productivity, labor and geographical mobility of the population on future demand for labor and their supply. Most models use quantitative economic and mathematical methods: econometric methods, matrices of interbranch balance, macroeconomic modeling, analysis of structural shifts and others. For the majority of these models the use of large and complex data array is characteristic. In addition to quantitative methods, we use qualitative methods: through the analysis of trends and threats, development scenarios, numerous negotiations, interviews and questioning of graduates and employers: the representatives of industry, private companies, professional and trade associations, trade unions, training experts and representatives of education sector which contributes to the quality and accuracy of forecasts. Regardless of whether the forecasts are concentrated in one institution (for example, the forecast of the US Labor Statistics Agency) or conducted by several institutions and / or organizations (in Germany and in the UK), of course, all models are comprehensive and complementary. The OCCMOD methodology [3], which is used in the UK, is based on the employment model, examines occupational employment by regions and industries. It assumes the existence of a universal methodology for various industries. REPMOD (Meredith, D., 1999) is another technique is also used to predict the labor market in the UK. Its main idea is to assess the demand for qualified personnel because of the need to replace them by industry, region and profession. The attention is paid to the approaches to considering the aging process and the geographic mobility of the population. The “Occupational sorting model” methodology (Fouarge et al., 2014), which is a model of the personnel offer, is nother method with the UK. It allows to develop projections of the qualification structure of certain professions and groups of professions. The Australian MONASH model [17] is a dynamic computable model of general equilibrium designed for forecasting and analysis. It provides a forecast of the labor market and a basis for the coordination of historical data and expert assessments of the future demand for labor. In the framework of this model, approaches to potential sector, scientific and technical progress are particularly noteworthy. The German methodology INterindustry FORecasting GErmany (INFORGE) (Lutz et al., 2003), [3; 4] allows forecasting the demand for specialists by types of employment, professional structure and skill level by extrapolating the main trends by the level of qualification (education) based on the long-term demographic forecast, and also depending on the forecast of economic activity of the population. Most of all, in this model, approaches to the consideration of the shadow sector of the economy when calculating labor market demand, as well as the proposal of its authors to add ‘safety margin’ to unaccounted influence factors, are worthy of attention in this model. The IFO is another methodology of Germany, based on the Cambridge Econometrics models (which include forecasted GDP, employment and interregional trade by sectors at the regional and national levels) and fore70
SocioEconomic Challenges, Volume 2, Issue 1, 2018
cast data from the European regional economic model (EREMED). In this model, the idea of the need to estimate the rate of supply increases, depending on the growth rate of demand, deserves attention. Working Futures methodology (Wilson R. A. et al., 2016) gives a picture of the prospective employment structure by industry, occupation, skill level by sex and employment status, provides for detailed consideration of sectoral as well as professional changes in the employment structure, considers their potential impact on qualification requirements for both micro and macrolevel. The input-output matrix, which is associated with the flow of goods and services between industries and determines the total volume of industrial production, is in the center. This is a multisectoral and multiannual diacritical macroeconomic model based on a parallel assessment of the labor market and energy, environmental and economic issues. The Qualification ssupply model (Kaminskiene L., 2009) is aimed at future arrivals of persons with different skill levels, using the national time series model. Its purpose is to assess the quality of the future supply in the labor market, depending on the emergence of new professions and the necessary level of skills to meet them. A series of forecast study reports “The Future of Work and Qualifications in the UK” (Stoermer E. et al., 2014) provides an analysis of qualitative shifts, likely medium-term and long-term trends and threats in the labor market. The forecast model is based on factual data, literature reviews, interviews of experts (business, science and trade unions), discussions at conferences, seminars. The Russian IBS model [2], (Gurtov, V. A. et al., 2004), (Vasilyeva, Z. A. et al., 2005) is also used for forecasting by demand on staff. Proceeding from the fact that this model does not consider a number of parameters affecting the labor market, namely, an increase in the number of working pensioners, academic mobility, non-linear age and the distribution of workers, special forms of work, its provisions were not taken into account in this study. Methods The supply and demand are the basic categories of research of any market. The indicator which is the basis for calculations (the calculation base) was initially set in the study for each of them, and then this figure was multiplied by several correction factors to consider factors that affect the supply or demand on labor. These coefficients can both increase and decrease the calculated base. The calculation and correction mechanism was individual in each case. Demand for labor To assess the need for specialists in the labor market, the category of unrealized demand for the workforce was adopted in this paper. This is due to the fact that the available vacancies determine the amount and direction of financial flows from local budgets and subventions from the state budget to the development of education in the relevant direction of sprcialists training. The calculation base for estimating the demand for specialists in the labor market was the number of vacancies for the workforce of corresponding profession. During this study it was taken into account the fact that there is an objective discrepancy between real and official data on the number of vacancies in the region that are collected by the regional employment services and are published on a regular basis (due to the fact that not all employees officially are employed, and also based on a wide range of possible sources of labor force search by employers). Therefore, to ensure the reliability of this study, calculated on the basis of official statistical information, the amount of unrealized demand for the specialists multiplied by the correction factor, the magnitude of which is different for each of the studied branches of the economy (for the base the indicator of the level of economic shadowing is calculated and are made public for all sectors). The factors influencing the unrealized demand for professionals that are considered in this study are: 1) The cost of a workforce of appropriate qualifications. The Correlation coefficient ( ktсD ), which characterizes the level of the gap in the amount of the salary of the branches of the relevant industry and the average wage in the region in the t-th calender year (at the end of the year) was determined in the study as follows:
k tсD
100 RZ t 100
(1) 71
SocioEconomic Challenges, Volume 2, Issue 1, 2018
RZ t
SZOt SZGt SZOt
(2)
Where:
RZ t is the gap in the wages of specialists of the relevant industry and the average wage in the region in the t-th calendar year (as of the end of the year);
SZOt
is the average wage in the region in the t-th calendar year (at the end of the year);
SZGt
is the average wage in the relevant industry in the t-th calendar year (at the end of the year).
2) The level of aging of the population in the region (measured as the ratio (number of units) of able-bodied persons of retirement age in the total number of economically active population aged 15-70 years). Based on the fact that the age structure of employed people in the branch is uneven, in predicting unrealized demand for professionals correction factor was introduced that allows to consider that at some point of time the amount of vacancies on separate branches can increase shortly due to the retirement of employees. The correction factor ( k td ), which characterizes the level of population aging in the region in the t-th calendar year (as of the end of the year) is determined by the following formula:
k td 1 wt ,
(3)
Where
wt is the share of pensioners in the structure of the population in the t-th calendar year (as of the end of the year). 3) The level of substitution of labor for capital in the industry (investments in equipment modernization and the introduction of new technologies in production lead to the substitution of hired manual labor, making a large number of low-skilled workers unemployed). The correction factor ( k ts ), which takes into account the level of substitution of labor for capital in the region in the t-th calendar year (as of the end of the year) was determined with the following formula:
kts
max RZLK RZLK t 100 RZLK t max RZLK min RZLK 100
(4)
Where:
RZLK t
is the level of substitution of labor for capital in the region in the t-th calendar year (as of the end of the year);
max RZLK is the maximum possible theoretical value of the level of substitution of labor for capital;
min RZLK is the minimum possible theoretical value of the level of substitution of labor for capital. Considering the level of substitution of labor for capital in each area has its own specifics. When examining unrealized demand for education, adjustments to this parameter should not be carried out, since the introduction of information technologies in the education sector does not lead to a decrease in demand for specialists of this profile (for example, educators, tutors, cultural event organizerы, primary school teachers, etc.). When examining unrealized demand for the healthcare sector, adjustments to this parameter are also not implemented, since, as experts шт medical industry taken part in this study, scientific and technological progress in this area significantly changes the technology of providing medical services, but does not reduce the number of junior medical personnel (care for patients, manipulation, maintenance of medical equipment, etc.), is educated in medical schools.
72
SocioEconomic Challenges, Volume 2, Issue 1, 2018
When examining the unrealized demand for agriculture, adjustments to this parameter should be carried out, since the introduction of modern technologies for automating agricultural production significantly influenced the number of necessary workers. Thanks to automation of milk collection processes, processing of grain crops, packing of finished agricultural products, the need for workers is reduced. This factor is taken into account due to the application of the correction factor, the basis for calculating which is the volume of investment in fixed assets in agriculture. 4) The development potential of the industry (in increasing or falling trend of changes in the main indicators of the industry development determines how the demand for labor will change in the future). The potential of the industry development is suggested to be measured by a generalized indicator (based on the base growth factor)1, which should be calculated as follows: •
for education ‒ by the following formula:
QtZNZ QtDNZ QtPTNZ
ktGE
T
1 QtZNZ QtDNZ QtPTNZ T t 1
(5)
GE t
where k is a general indicator of the development potential of the education sector in the region in the t-th calendar year (as of the end of the year);
QtZNZ is the number of students in general secondary schools in the t-th calendar year (as of the end of the year); QtDNZ is the number of students at educational institutions of pre-school education in the t-th calendar year (as of the end of the year); QtPTNZ is the the number of students in vocational and technical colleges in the t-th calendar year (as of the end of the year);
T is a total number of years of study; T
1 QtZNZ QtDNZ QtPTNZ is a simple arithmetic average of the time series levels (chosen as the base T t 1 for the comparisons). • for the agriculture sector ‒ as the sum of two groups of indicators normalized by the natural method2, characterizing the state of development of crop production and livestock in the region, weighted by the average value of each of the indicators for the period under study. The calculation is proposed to be carried out according to the following formula: 7
k tGSG
4
VR VT i 1
i t
j 1
j
t
7 4 1 VRti VTt j T t 1 i 1 j 1 T
(6)
where ktGSG is a summarized indicator of the development potential of the industry in the region in the t-th calendar year (as of the end of the year);
VRt1 is the normalized value of production volume of main agricultural crops in the region in the t-th calendar year (as of the end of the year); 1 The base growth factor is the indicator of the intensity of change in the levels of the series. It shows how many times the given level of the series is greater than the base level (if this coefficient is greater than one) or what part of the baseline level is the level of the current period over a certain period of time (if this coefficient is less than one. 2 The natural method of data normalization is the ratio of the difference in the indicator in the current period and the minimum possible value of this indicator to the span (that is, the difference between the maximum and minimum possible values of the indicator under study.
73
SocioEconomic Challenges, Volume 2, Issue 1, 2018
VRt2 is the normalized value of production volume of grain and leguminous crops in the region in the t-th calendar year (as of the end of the year); VRt3 is the normalized value of sugar beet production in the region in the t-th calendar year (as of the end of the year);
VRt4 is the normalized value of the volume of sunflower seed production in the region in the t-th calendar year (as of the end of the year); VRt5 is the normalized value of potato cultivation in the region in the t-th calendar year (as of the end of the year); VRt6 is the normalized value of the volume of growing vegetables in the region in the t-th calendar year (as of the end of the year);
VRt7 is the normalized value of the volume of growing fruit and berry crops in the region in the t-th calendar year (as of the end of the year); VTt1 is the normalized value of meat production in the region in the t-th calendar year (as of the end of the year); VTt 2 is the normalized value of milk production in the region in the t-th calendar year (as of the end of the year); VTt 3 is the normalized value of egg production in the region in the t-th calender year (as of the end of the year); VTt 4 is the normalized value of the volume of wool production in the region in the t-th calendar year (as of the end of the year). • for the healthcare sector, the potential of the industry development is proposed to measure by the basic growth rate of the population in the region over the year, which is calculated by the following formula:
ktGM
KN t T
1 KN t T t 1
(7)
Where
ktGM is a summarized indicator of the health development potential in the region in the t-th calendar year (as of the end of the year);
KN t is the population in the region in the t-th calendar year (as of the end of the year); T
1 KN t is a simple average absolute population for the period under consideration. T t 1 Since other factors that could not be included in the list listed above can also affect the unrealized demand, then one more component was added to the calculated based on the available statistical information of the unrealized demand for specialists and staff ‒ the standard deviation of this indicator, determines lower and upper limits of possible values. This gives an opportunity to consider the possible variation in the amount of unrealized demand due to the influence of additional factors. Proceeding from the above, the volume of unrealized demand for specialists and workers in the region in the t-th calendar year (as of the end of the year) ( Dt ) is proposed to be calculated as follows:
Dt Vt K tt k tc k td k ts k tp D 74
(8)
SocioEconomic Challenges, Volume 2, Issue 1, 2018
where Vt is the number of vacancies for specialists in the relevant profession (specialization) in the area in the t-th calendar year (as of the end of the year);
Ktt is a correction factor that considers the objective discrepancy between real and official data on the number of vacancies in the region (the indicator of the level of shadowing the economy, which is published annually for all sectors, is taken as the basis) in the t-th calendar year (at the end of the year);
k tp is a correction factor that takes into account the development potential of the industry in the area in the tth calendar year (as of the end of the year) ((the education sector ( ktGE ), the agriculture sector ( ktGSG ), health ( ktGM ));
D is the average quadratic deviation of the unrealized demand for specialists and workers of the relevant industry in the region for the considered time interval (it makes it possible to determine possible boundaries of fluctuations of this indicator to consider the influence of additional factors). Supply of labor To assess the need for specialists and workers in the labor market of the region, the category of unrealized supply of labor was adopted, since it describes the currently available amount of free labor in the market. The sum of the following three indicators was the calculation base for estimating the supply of specialists and workers in the labor market of the region: ➢
the number of graduates of vocational schools of the relevant specialty in the region;
➢ the number of unemployed professionals in the relevant profession who are registered with the regional employment service and district employment centers; ➢ the volume of created workforce because of training and retrainingthe unemployed people in the region. Personnel retraining can increase or decrease the supply of workers and specialists to higher education in certain professions. So, for example, if the driver of agricultural (forestry) production is retrained to a gypsum worker, the supply of labor is reduced in the labor market in the agriculture branch, and increases in the construction branch). The factors influencing the amount of unrealized supply of specialists and workers in the field that were considered in this study are: 1) the value of the workforce of the relevant qualification (measured as the ratio of the salaries of specialists and workers in the relevant sector (per 1 worker) to the average wage in the region as a whole. The volume of unrealized supply of specialists to higher education and workers usually increases with the wages growth in the industry. To account for this factor, a correction factor ( ktсS ) is used, which is rooted in the following way:
ktсS
100 RZ t 100
(9)
where RZ t is the gap in the amount of wages of specialists and workers in the relevant industry and the average wage in the region in the t-th calendar year (as of the end of the year); 2) the level of economic activity of the population in the region (measured by the basic growth factor, which is calculated as the ratio of the number of able-bodied population aged 15-70 in the current a year to its average for the entire period of study). The correction factor ( k t ), considering the level of economic activity of the population in the t-th calendar year is calculated based on the following formula:
kta
REAN t 2016
1 REAN t T t 2001
(10)
75
SocioEconomic Challenges, Volume 2, Issue 1, 2018
where REAN t is a level of economic activity of the region’s population in the t-th calendar year (as of the end of the year). 3) the level of labor migration (migration growth is measured by the difference between the amount of arrival in the region and the departure from the workforce of relevant qualification). Considering this factor has become particularly relevant in recent years, as many unemployed people and graduates of vocational schools migrate to other regions of the country and abroad in search of high-paying jobs. The level of labor force migration, the correction factor for the volume of unrealized supply of specialists and workers ( ktm ) of the region in the t-th calendar year (as of the end of the year) was calculated as follows:
k tm
MPt minMPt t
minMPt
(11)
t
where
MPt is the minimum possible value of the migration increase for the time interval under investigation. Taking into account the fact that other factors that could not be included in the list of specified above can also pour on the unrealized proposal, then one more component was added to the calculated on the basis of the available statistical information of the unrealized supply of specialists and workers, the average quadratic deviation of this indicator determining the lower and the upper limit of possible values. This fully gives an opportunity to take into account the possible variation in the amount of unrealized supply due to the influence of additional factors. Proceeding from the above, the volume of unrealized supply of specialists to higher education and workers in the region in the t-th calendar year (as of the end of the year) ( S t ) was calculated as follows:
St Gt U t Qt ktc kta ktm S
(12)
where G t is the number of graduates of vocational schools of the relevant profession (specialization) in the t-th calendar year (as of the end of the year);
U t is the volume of unemployed people in the region in the t-th calendar year (as of the end of the year);
Qt is the number of new workforce because of training and retraining of the unemployed people in the region in the t-th calendar year (as of the end of the year);
ktcS is the correction factor characterizing the labor cost of the relevant qualification in the region in the t-th calendar calendar year (as at the end of the year);
ktm is the correction factor, characterizing the level of migration of the region’s labor force in the t-th calendar year (as of the end of the year);
S is the average quadratic deviation of unrealized supply for specialists and workers of the relevant industry in the region over the considered time interval (it makes it possible to determine possible limits of fluctuations in the volume of unrealized supply of specialists and workers in the relevant industry). Labor market outcomes (interrelation of supply and demand for labor) The study made it possible to identify the three most common approaches to analyzing the labor market: 1) structural approach is acquired through a comparison of its main structural components supply and demand; 2) market approach is the interpretation of the labor market outcomes as a market situation trends and tendencies which are described by a large number of various indicators and generally indicate the level of competition in the market;
76
SocioEconomic Challenges, Volume 2, Issue 1, 2018
3) factor approach is the explanation treatment of the labor market as a set of factors and conditions that cause changes in the development of this market. The first approach, the structural one, was adopted as the basic one in this study. According to him, the difference between the volume of unrealized demand and the unrealized supply of specialists to higher education and workers of the relevant industry in the region makes it possible to establish the type of labor market outcomes in the labor market of the corresponding sector (balance, labor deficit, labor surplus).
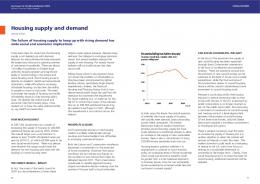
The level of replacement of labor with capital in the region
The potential of the industry development in the field
Labor deficit
= Balance
< Labor surplus
The volume of created labor force in the course of training and retraining of unemployed people in the region The level of economic activity of the population in the region The level of labor migration in the region The cost of appropriate skills in the field
Calculation base
>
The number of unemployed people in the relevant profession in the region
Figure 1. Schematic representation of the approach to assess the main parameters of the labor market in the region (market segment presented by specialists and working professions)
When determining the quantitative ratio between the supply and demand of the labor force, it is important to know whether the share of demand provides 100% of supply, or in another interpretation: how many percentages of the supply account for 100% of the demand for labor. For the immediate calculation of demand for personnel (deficit or surplus) in a certain area, the gap between supply and demand ( INN t ), which characterizes the deficit or surplus of labor in the region in the t-th calendar year (at the end of the year) is estimated by the following formula:
INN t ( S t Dt ) INN (Gt U t Qt ktcD kta ktm ) (Vt ktcS ktd kts ktp ) INN ,
(13)
where
77
s
The cost of a corresponding skill in the field of demographic situation
The number of graduates of vocational-technical educational institutions of relevant profession in the field
Correction factors
Correction factors
The cost of appropriate skill in the field
Labor market outcomes
Unrealized offer
The number of vacancies for specialists in the relevant profession in the field
Unrealized demand
Calculation base
Schematically described above, the logic of assessing the main parameters of the labor market in the region is shown in Figure 1.
SocioEconomic Challenges, Volume 2, Issue 1, 2018
INN is the average quadratic deviation of the gap between the demand and supply of the relevant industry in the region over the considered time interval (allows to establish possible limits of fluctuations in demand for personnel). The main stages of the assessment of the labor market needs of the region in the workforce and specialists are given in Table 1. At the first stage of the study, the analysis of statistical indicators of the dynamics of supply and demand indicators in the labor market was carried out for each branch. These indicators are the number of employed people, the number of unemployed people, the number of graduates of vocational schools, the average wage, the number of economically active population and others. The list of indicators was differentiated depending on the specifics of the field of research and those factors that were most significant for the given industry in the formation of demand and supply. This analysis made it possible to understand the vectors for further development of the industry under study and to identify a number of regional features that are specific for this particular area. At the same time, reliable information for a long period of time was available for each of the investigated factors. To obtain an adequate forecast, the retrospective period of analysis should at least 4 times exceed the prediction period. For example, if you need to build a forecast for 5 years, then you need to have reliable statistics for each indicator for 20 previous years. Repeated reforms of the statistical information system in Ukraine have led to the fact that available or abrupt information (only for certain periods) or the object of statistical recording itself has been transformed. Table 1. Stages, tools and results of assessing the needs of the labor market in the workforce and specialists in higher education Stage 1
2
3
Essence Analysis of current trends in the development of the relevant industry in the region and the current situation in the regional labor market of this sector Selection of the most significant factors of influence on the supply and demand of the workforce of the relevant profession (qualification) in the field Smoothening of trends, that is, leveling atypical deviations in trends (during a crisis, electoral processes, natural disasters, etc.), which can lead to distortion of results
Mathematical tools Statistical indicators, relative indicators of dynamics, graphical method Method of main components (calculations with the help of the software complex Statistica 8) Checking the series of dynamics for abnormalites using the Irvine method and the modified Irwin method
4 Mathematical calculations of the level of demand and supply of the labor force of corresponding profession (qualification) in the field
Additive method
5
6
Estimation of the difference between the volume of unrealized demand and the unrealized supply of specialists to higher education and workers in the relevant industry in the field
Normalization, multiplicative convolution
Investigating the links between the supply and demand of the workforce of the relevant profession (qualification) in the field
Structural modeling (calculations using the software complex Statistica 8)
Result The general trends in the development of the relevant industry in the region, as well as the regional labor market of this branch The large number of factors influencing the supply and demand of the workforce of the relevant profession (qualification), only those whose influence is the most significant in the field A homogeneous array of incoming information is formed, objectively (without distortions) reflects trends and dynamics of changes in those factors of influence on the supply and demand of the labor force of the relevant industry, which are the most significant for the region Constructed mathematical equations describing the dependence of the level of supply and demand on the labor force in the relevant industry in the region from the most important factors of influence on them (these factors were selected in stage 2) 1. The integral indicator “The need for specialists in higher education and the workforce of the relevant industry in the region” is calculated. 2. The type of conjuncture in the labor market of the relevant industry was determined: balance, labor deficit, labor surplus Determining how much the supply of the labor force of the relevant profession (skills) in the region increases with an increase of 1% in the level of demand for this labor force
Therefore, to form an adequate array of incoming information necessary for reliable mathematical calculations of the need for specialties and workers in the relevant field of the branch, the number of indicators for 78
SocioEconomic Challenges, Volume 2, Issue 1, 2018
analysis should be reduced but the credibility of calculations should not be lost. Since the individual indicators that are included in this study are interdependent (multicolinear), therefore their simultaneous recording may lead to the results distortion. To solve this problem, the principal component analysis (PCA) has been recognized by the world expert community, which makes it possible to single out the main components, or generalized characteristics on a large scale of initial characteristics, describe the processes in the labor market of the region within a certain industry with a high degree of reliability. Another important component of the quality assurance of the research is to bring the available array of statistical information to a homogeneous form (that is, when there are no atypical, abnormal observations, unexpected fluctuations, and distortion of trends). The violation of homogeneity of the initial information can become one of the significant problems since abnormality leads to a shift in the estimates and distortion of the results of the analysis. To solve this problem, the existing series of the dynamics of factors affecting supply and demand for the labor market of the relevant industry were tested for homogeneity by the Irvine method (to identify abnormalities in main tendencies of changes in studied indicators, trends) and the modified Irwin method (to detect abnormalities in seasonal and cyclical fluctuations of time series). After that, the critical points of the dynamics series were smoothed and the final array of incoming information formed, which maximally satisfies the requirements of statistical data processing. An important factor in the evaluation of supply and demand for the labor market is the verification of the data array for stationarity (the presence of a trend in time series). Stationary time series assume that the process under investigation is linear, not periodic, that is, it does not depend on a specific time period. When researching the labor market, the requirement of stationarity of the time series is important, since the supply and demand of labor has changed significantly during the crisis periods, depending on the changing political situation in the country, the visa regime, etc. In this study the stationarity of time series was determined on the basis of the method for checking the differences in the mean levels. Critical points were also determined, that is, those values that are not characteristic of the general pattern and can distort further calculations. The quantitative estimation of the level of interrelation between supply and demand for the labor market of the studied industries was carried out using the structural modeling method, which is also called the structural equation modeling (SEM) method. This method uses the ideas underlying regression analysis, but is fundamentally different from it due to complex multidimensionality, that is, the ability to take into account the set of dependent and independent variables in the model. The method of structural modeling was chosen for this study, because it is one of the few methods of analysis, which allows to build and visualize complex systems of links between variables, including those that are not directly observed. Another reason for the use of this particular method is the possibility to work with data that does not correspond to the normal distribution (the so-called multidimensional abnormal data) and to the missing data (this is important when in the annual statistical yearbooks in certain periods, data are not available). Calculations using the method of structural modeling were carried out using the statistical software package Statistica 8, which allows the implementation of functions of data analysis, data management, data search, data visualization using statistical methods. Results Practical calculations based on the proposed methodology were carried out for three types of economic activity education, agriculture and medical care on the example of Sumy region (Ukraine). To calculate the demand for personnel (deficit or surplus) immediately, the calculations of the gap between supply and demand were performed. The results are presented in Table 2. The results of estimating the possible limits of fluctuation of this indicator during 2014-2016 are given in Table 2. Table 2. Results of the assessment of the level of demand (demand-supply) in specialists in the field of education of Sumy region for 2014-2016 Year
Junior specialists in primary education
Junior specialists in preschool education
2014 2015 2016 Mean deviation
-102 -98 -141 24
-87 -95 -131 24
Junior specialists in specialized (special) education -39 -38 -55 9
Other junior specialists in education -349 -295 -337 28
79
SocioEconomic Challenges, Volume 2, Issue 1, 2018
Table 3. Results of the calculation of the upper and lower bounds of demand fluctuations (demand-supply) in specialists in the field of education in Sumy region during 2014-2016
Year
2014 2015 2016
Junior specialists in primary education
Junior specialists in preschool education
Lower bound
Upper bound
-78 -74 -117
-125 -121 -165
Lower bound -63 -72 -108
Upper bound -110 -119 -155
Junior specialists in specialized (special) education Lower Upper bound bound -29 -48 -29 -47 -45 -64
Other junior specialists in education Lower bound -321 -267 -309
Upper bound -378 -324 -366
As can be seen from Table 3, it can be concluded that during 2014-2016 there is an increase in the surplus of specialists in primary education, pre-school education, specialized education, the greatest surplus of other young specialists in the field of education. Potential fluctuations in the need for these specialists due to possible impact of unaccounted factors do not change the situation in the labor market of this sector: the need for junior specialists in preschool education, preschool education and other junior specialists in the field of education is growing or decreasing by an average of 26 people, and fluctuations in the need for junior specialists in the field of specialized (special) education in general is at a minimum level of ± 9 people. Thus, the conjuncture of the labor market in the field of education in Sumy region is labor-surplus, the market is oversaturated by junior specialists with primary education, junior specialists in preschool education, junior specialists in the field of specialized (special) education and other junior specialists in the field of education. The definition of demand for workers in agricultural sector is given in Table 4. Table 4. The results of assessment of the level of demand (demand-supply) in specialists and workers in the agricultural sector in Sumy region during 2008-2016, people
Year
2008 2009 2010 2011 2012 2013 2014 2015 2016
Workers serving agricultural and other mobile installations Lower Upper bound bound -1554 -2216 -790 -1452 -1315 -1977 -802 -1464 -685 -1347 -622 -1284 -953 -1616 -548 -1210 -825 -1487
Drivers of motor transport and motocycles and other maintenance workers Lower Upper bound bound -1029 -1438 -548 -958 -395 -804 -523 -933 -471 -881 -348 -758 -721 -1130 -479 -888 -612 -1022
Mechanics and assemblers of mechanical equipment Lower bound -652 -295 -350 -174 -146 -115 -252 -88 -225
Upper bound -996 -638 -693 -517 -490 -458 -595 -431 -568
Workers engaged in forestry Lower bound -259 -123 -235 -197 -108 -117 -145 -139 -258
Upper bound -383 -247 -359 -321 -232 -241 -269 -263 -382
Table 5. The results of assessment of the level of demand (demand-supply) in specialists and workers in the agricultural sector in Sumy region during 2008-2016, people Food controllers Year
2008
Lower bound -174
Upper bound -256
Mechanics and installers of electrical and electronic equipment Lower Upper bound bound -167 -269
Welders Lower bound -323
Livestock farmers
Upper bound -511
Lower bound -629
Upper bound -1021
2009
-82
-164
-162
-264
-215
-403
-95
-486
2010 2011 2012
-160 -140 -81
-243 -223 -163
-143 -117 -69
-245 -219 -171
-212 -90 -65
-400 -278 -253
-137 -38 -7
-529 -430 -399
2013 2014
-69 -143
-152 -225
-47 -184
-149 -286
-39 -130
-227 -318
-6 -50
-386 -442
2015
-118
-200
-74
-176
-65
-253
-39
-431
2016
-174
-256
-72
-173
-91
-279
-107
-499
80
SocioEconomic Challenges, Volume 2, Issue 1, 2018
Table 6. The results of assessment of the level of demand (demand-supply) in specialists and workers in the agricultural sector in Sumy region during 2008-2016, people Year
Laboratory assistants for chemicalbacteriological analysis
Gardeners and farmers
Employees of services providing protective services
2008 2009 2010 2011
Lower bound -64 -19 -29 -12
Upper bound -99 -55 -65 -48
Lower bound -122 -49 -57 -55
Upper bound -172 -99 -107 -105
Lower bound -11 -6 -10 0
Upper bound -24 -19 -23 -14
2012 2013
-12 -9
-47 -44
-55 -55
-105 -105
0 7
-13 -6
2014
-20
-56
-75
-125
2
-11
2015 2016
-4 -26
-39 -61
-68 -100
-117 -150
-6 -11
-20 -24
The calculations of integral indicator of labor market demand for specialists and workers in Sumy region in the field of agriculture showed the following: ➢ There is a surplus of specialists and workers in pre-higher education in all analyzed professions of the labor market of agricultural sector; ➢ During 2008-2016, there is an annual decrease in the surplus volume of specialists to higher education and workers in Sumy region on average by 5%; ➢ About a third of the total surplus labor in agriculture in Sumy region is represented by workers serving agricultural and other mobile installations. At the same time, during 2008-2016, there is a reduction in the surplus of these specialists (junior specialists) and workers: in 2008 there were 1884 ± 331 people, which is 729 ± 331 less than in 2016; ➢ About 20% of the surplus of specialists (junior specialists) and workers in the field of agriculture whose qualifications are sufficient to work as drivers of auto and motor vehicles and other workers in the maintenance of auto and mototransport machinery, potentially unemployed people or likely to change their profile activities. This situation leads to increased competition among workers, since their supply is much larger than the level of demand on the market; ➢ The smallest gap between demand and supply is observed for gardeners and farmers (at the end of 2016 ‒ 125 ± 25 people), laboratory assistants for chemical and bacteriological analysis (as of the end of 2016 ‒ 43 ± 18 people), as well as security guards at the end of 2016 ‒ 18 ± 7 people). Thus, the conjuncture of the labor market in the agricultural sector in Sumy region is labor surplus, the market is oversaturated by specialists in prehigher education and workers of the agricultural sector. The results of calculations of volume of unrealized supply in the labor market in the health sector are given in Table 7. Table 7. The results of calculations of unrealized supply of specialists to pre-higher education in the field of health in Sumy region during 2014-2016 Year
Specialists in biology and agronomy
2014 2015
-20 -18
Support staff in the field of modern medicine, physiotherapy, pharmacy and veterinary medicin -306 -290
2016
-11
-262
-219
Mean deviaton
-5
-23
-14
Nurses and midwives, assisted by professionals -231 -246
The calculations showed that the most advanced services were offered by auxiliary personnel in the field of modern medicine, physiotherapy, pharmacy and veterinary medicine. Thus, the unrealized supply of specialists to pre-higher education of this profession, although it decreased by 44 people during 2014-2016, however, it remained in 2016, at a fairly high level ‒ 239 people.
81
SocioEconomic Challenges, Volume 2, Issue 1, 2018
A similar trend is typical for nurses and midwives (despite the reduction in the volume of unrealized supply in 2016 for 26 people compared to 2015, the total volume of this indicator in 2016 was 206 people). The findings make it possible to draw the following conclusions: ➢ In 2016 there was a shortage of specialists in higher education, namely: workers in the field of biology and agronomy (4 people), support staff in the field of modern medicine, physiotherapy, pharmacy and veterinary (3 people), as well as nurses and midwives who assist professionals (71 people), since the value of the integral indicator is less than 0. ➢ During 2014-2016 there was a positive tendency to reduce the gap between the unrealized demand and the supply of support personell in modern medicine, physiotherapy, pharmacy and veterinary medicine (for 81 people). At the same time, the surplus of these specialists in the regional labor market in 2016 still was 97 people. ➢ Assuming that other factors not included in this study can influence demand and supply, the potential limits of the need for personnel are as follows: in 2016, the number of specialists in the field of biology and agronomy varies from -10 (shortage) to 2 (surplus) of persons; the number of support personnel in the field of modern medicine, physiotherapy, pharmacy and veterinary medicine varies from -49 (shortage) to +44 persons (surplus) the number of nurses and midwives varies from -111 (shortage) to +30 (surplus). Thus, the conjuncture of the labor market in the health sector in Sumy region, depending on the period of the study, is labor surplus for 2014-2015 and it is labor deficit in 2016. So, for three years under investigation the gap between unrealized demand and unrealized supply within the studied professions gradually decreased. Conclusion The calculations carried out for three types of economic activity education, agriculture and medical care showed that the labor market conditions for these types of economic activity are surplus, the market is oversaturated by junior specialists in the field of education, agriculture and medical care, however, the gap between demand and supply is within the studied professions. In general, the list and scope of educational services by regional educational institutions should clearly correspond to the needs of regional enterprises, that is, to ensure the renewal of the labor market with the necessary specialists. Therefore, topical areas for further research are the development of criteria for optimizing the network of vocational education institutions in the region, the amount of their funding, directions and training levels. In countries with a successful system of professional education, representatives of regional educational institutions, local authorities, local business and industry are actively engaged in dialogue. All parties are interested in the development of vocational education, determining which specialists are needed right now for business, and which will be in demand in a year or two, given the development trends of local business. To use resources more efficiently, mergers of vocational education institutions are used to create large training centers. In Denmark, there were associations of centers for professional development at the Ministry of Labor and traditional vocational colleges subordinated to the Ministry of Education, and they created large educational institutions under the auspices of the Ministry of Education. A similar approach was applied in Estonia. There, the network of vocational education and training institutions was reorganized to create large centers of professional training. In the period from 1994 to 2003, thanks to the merger, the number of state vocational education institutions in Estonia decreased from 77 to 52. In most countries of the European Union, enterprises cooperate with schools through apprenticeship programs and tax incentives, involving necessary specialists to the production. The reform of the system of financing vocational education in the region should be based on forecasting the needs of the regional labor market for the short and medium term in terms of the training of skilled production personnel for a certain range of professions and qualification levels. For countries where vocational education funding is provided from local budgets, these forecasts should form the basis for developing proposals for the formation of a regional training order. In the context of limited local budgets, it is important to provide financial support to those educational institutions that train specialists whose demand in the region is high, and the proposal does not cover it. To correct disparities in regional labor markets, it is important to assist vocational education institutions in attracting investors, participating in international projects, which 82
SocioEconomic Challenges, Volume 2, Issue 1, 2018
will attract not only budgetary but also extrabudgetary funds for the development of vocational education. In addition, forecasts of labor supply and demand in regional labor markets can form the basis for the formation of adult education programs, retraining of the unemployed people and people who may lose their jobs as a result of the excess working population in the relevant segment of the labor market, the upgrading of skills of workers and the like. This article was performed under the guidance of Dr. Prof. Tetyana Vasilyeva within the framework of the project “Modeling and forecasting of socio-economic-political road map of reforms in Ukraine for transition to the model of sustainable growth (№ of the state registration: 0118U003569)”. References 1. Bokov, O. V., Viter, V. I. (2012). Monitorynh sotsial’nykh standartiv ta iikh vplyv na rehional’nyi riven’ zhyttia naselennia Ukraiiny [Monitoring of social standards and their influence on the regional level of life of the population of Ukraine]. Ukrayina: aspekty pratsi [Ukraine: aspects of labor], 8, 28-34. 2. Effektivnyye metody prognozirovaniya kadrovykh potrebnostey rynka truda dlya formirovaniya regional’nogo zakaza na podgotovku kadrov: sb. dokl. [Effective methods for forecasting the labor market needs for the formation of a regional training order: book of reports]. Moscow: Federal’nyy institut razvitiya obrazovaniya [Federal Institute for the Development of Education], 117 p. 3. European Centre for the Development of Vocational Training: Skills for Europe’s future: anticipating occupational skill needs, 2009. [Electronic resource]: CEDEFOP publications. Retrieved from: http://www.cedefop.europa.eu/en/publications-and-resources/ publications/5194. 4. European Centre for the Development of Vocational Training: Skills supply and demand for Europe: medium-term forecast up to 2020, 2010 [Electronic resourse]: CEDEFOP publications. Retrieved from: http://www.cedefop.europa.eu/en/publications-and-resources/ publications/3052. 5. Fouarge, D., Kriechel, B., Dohmen, T. (2014). Occupational Sorting of School Graduates: The Role of Economic Preferences. IZA Discussion Paper # 8355. Available at: http://ftp.iza.org/dp8355.pdf. 6. Gurtov, V. A., Pitukhin, E. A. (2004). Matematicheskaya model’ prognozirovaniya sprosa i predlozheniya na rynke truda v rossiyskikh regionakh [Mathematical model for forecasting demand and supply on the labor market in Russian regions]. M.: Obozreniye prikladnoy i promyshlennoy matematiki [Survey of Applied and Industrial Mathematics], 11(3), 539-546. 7. Kaminskiene, L. (2009). Social Partnership in Vocational Education and Training in Lithuania: Challenges and Perspectives. In International Handbook of Education for the Changing World of Work: Bridging Academic and vocational Learning. New York: Springer, p. 619-635. 8. Khank D. E., Uichern D.U. and Rajts, A. Jr. (2003). Bizness-prognozirovanie [Business Forecasting], Izdatelskiy dom “Vilyams”, Moscow, Russia, 656 p. 9. Kravtsov, S. O. (2016). Profesiyi internet-prostoru: chym vony ye i khto zaymaye vidpovidni posady [Internet space professions: what are they and who holds corresponding positions]. Internet. Osvita. Nauka [Internet. Education. Science], October 11-14, 233-235. 10. Lutz C., Distelkamp, M. Meyer, B. Wolter, M. (2003). Forecasting the Interindustry Development of the German Economy: The Model INFORGE. GWS Discussion paper 2003/2, Osnabruck, 24 p. 11. MDM-E3: UK Multisectoral Dynamic Model – E3. Retrieved from: http://www.camecon.com/MacroSectoral/MacroSectoraluk/ModellingCapability/MDME3UKMultisectoralDynamicModel.aspx. 12. Meredith, G. (1999). REPMOD: a smaller sibling for MULTIMOD. IMF International Paper. Available at: https://www.imf.org/external/pubs/ft/wp/1999/wp9908.pdf. 13. OECD Skills Strategy: Better Skills, Better Jobs, Better Lives: A Strategic Approach to Skills Policies, 2012 [Electronic resource]: OECD documents. Retrieved from: http://skills.oecd.org/documents/oecdskillsstrategy.html. 14. Peregudova, T. V., Bystrov, A. G. (2013). Stimulating Employees’ Motivation to perceptions of innovations. European Researcher, 53(6-2), 1739-1745. 15. Stoermer E. et al. (2014). The Future of Work: Jobs and Skills in 2030. UK Commission for Employment and Skills, Wath on Dearne, 30 p. 16. Sumtsov, V. H., Peregudova, T. V. (2012). Osoblyvosti lyuds’koho rozvytku v Ukrayini [Features of Human Development in Ukraine]. Chasopys ekonomichnykh reform [Journal of Economic Reforms], 3(7), 131-136. 17. The MONASH Model [Electronic resource]. Retrieved from: http://www.copsmodels.com/monmod.htm. 83
SocioEconomic Challenges, Volume 2, Issue 1, 2018
18. United Nations Economic Comission for Europe. Gender Statistics. Retrieved from: www.unece.org. 19. Vasilyeva, Z. A., Filimonenko, I. V., Raznova, N. V. et al. (2005). Metodicheskiye aspekty prognozirovaniya kadrovoy potrebnosti regional’noy ekonomiki: monografiya [Methodical aspects of forecasting the personnel requirements of the regional economy: monograph]. Krasnoyarsk: Kras. CPI KSTU, 296 p. 20. Wilson, R. A. et al. (2016). Working Futures 2014-2024: Evidence report on sources and methods. UK Commission for Employment and Skills, Wath on Dearne, 110 p.
84