____________________________________________________ FORECASTING TIME SERIES DATA USING HYBRID GREY RELATIONAL ARTIFICIAL NEURAL NETWORK AND AUTO REGRESSIVE INTEGRATED MOVING AVERAGE MODEL Roselina Sallehuddin, Siti Mariyam Hj. Shamsuddin, Siti Zaiton Mohd. Hashim* and Ajith Abraham+
Abstract: In business, industry and government agencies, anticipating future behavior that involves many critical variables for nation wealth creation is vitally important, thus the necessity to make precise decision by the policy makers is really essential. Consequently, an accurate and reliable forecast system is needed to compose such predictions. Accordingly, the aim of this research is to develop a new hybrid model by combining a linear and nonlinear model for forecasting time series data. The proposed model (GRANN_ARIMA) integrates nonlinear Grey Relational Artificial Neural Network (GRANN) and linear ARIMA model, combining new features such as multivariate time series data as well as grey relational analysis to select the appropriate inputs and hybridization succession. To validate the performance of the proposed model, small and large scale data sets are used. The forecasting performance was compared with several models, and these include: individual models (ARIMA, Multiple Regression, Grey Relational Artificial Neural Network), several hybrid models (MARMA, MR_ANN, ARIMA_ANN), and Artificial Neural Network (ANN) trained using Levenberg Marquardt algorithm. The experiments have shown that the proposed model has outperformed other models with 99.5% forecasting accuracy for small-scale data and 99.84% for large-scale data. The empirical results obtained have proved that the GRANN_ARIMA model can provide a better alternative for time series forecasting due to its promising performance and capability in handling time series data for both small and large scale data.
Key words: Hybrid model, GRANN_ARIMA, multivariate time series, linear model, nonlinear model Received : Revised and accepted:
1.
Introduction
Predicting the future is important for the organization to plan or adopt the necessary policies. Forecasting can assist them to make a better development and decision-making for the country. There are various forecasting techniques available in the academic literature. However, the selection of these techniques normally depends on the availability of data, the quality of available models and some predefined assumptions. According to Makridakis et al. [33], each method is different in terms of accuracy, scope, time horizon and cost. To facilitate an adequate level of forecasting accuracy, the developer has to be responsive to the characteristics of different methods, and determine if a particular method is appropriate *
Roselina Sallehuddin, Siti Mariyam Hj. Shamsuddin, Siti Zaiton Mohd. Hashim, Faculty of Computer Science and Information System, University Technology Malaysia, 81310,Skudai, Johor Email: roselina, mariyam,
[email protected] + Ajith Abraham, Centre for Quantifiable Quality of Service, Norwegian University of Science and Technology,Norway Email:
[email protected]
1
for the undertaken situation before embarking its usage in real application. As a result, the choice of forecasting model is one of the important factors that will influence the forecasting accuracy. Forecasting methods can be broadly divided into two categories: Statistical and Artificial Intelligence (AI) based techniques. Box-Jenkins or Auto Regressive Integrated Moving Average (ARIMA), Multiple Regressions and Exponential Smoothing are the examples of statistical methods, whilst AI paradigms include fuzzy inference systems, genetic algorithm, neural networks, machine learning etc. [55]. Statistical methods are usually associated with linear data, while neural networks are usually associated with nonlinear data. Statistical methods have been used successfully in time series forecasting for several decades. As well being simple and easy to interpret, statistical methods also have several limitations. One of the major limitations of statistical methods is it is merely depicted as a linear model, also known as model driven approach. Thus, they have to fit the data with the available data, and a prior knowledge about the relationships between inputs and outputs before modeling is highly desired. Due to the limitations of statistical methods, nonlinear statistical time series models have been proposed, with the aim to improve the forecasting performance of nonlinear systems. These include bilinear model, threshold autoregressive model (TAR), smoothing transition autoregressive model (STAR), autoregressive conditional heteroscedastic model (ARCH), and generalized autoregressive conditional heteroscedastic model (GARCH). These models are known as second generation of time series models. However, limited success or gain has been found during the last two decades using nonlinear models since most of them are developed specifically for particular problems without broad-spectrum applicability for other situations. In addition, the formulations of these models are more complex and difficult to develop compared to linear models [21, 22]. Hence, a different approach has been proposed and engaged successfully in time series forecasting. Artificial neural network (ANN) has been applied in solving numerous time series forecasting problems such as stock, electricity prices, breast cancer, rainfall-runoff [1,15,18,23,41,45] and others. One of the main reasons that ANN performs better than statistical method is due to its influential feature in handling nonlinear time series data. In addition, ANN has also been shown to be effective in modeling and forecasting nonlinear time series with or without noise [55]. ANN also does not require any knowledge nor prior information about systems of interest [31]. Hippert et al. [19] and Zhang [57] have claimed that forecasting is a major application area of ANN. Zhang et al. [56] has compiled the results achieved by previous researchers. Even though most of published researches indicate the superiority of the ANN model in comparison to simpler linear model, but quite a few studies give disparity comments on ANN performance. Denton [16] and Gorr et al. [20] showed that ANN perform about the same as the linear model. Several other researchers [7,8,24,46] also reported the pessimistic findings about ANN in forecasting daily electric load for one step ahead forecast. In their study, they showed that ANN was not as effective as the linear time series model in forecasting performance even if the data is nonlinear. However, Kang [27] had shown that ANN always performs well compared to ARIMA, and even better when the forecasting horizon is increased. Some researchers [6,11,33,55] have reported that there is no such single forecasting method that gives an appropriate result in all situations. The reason for this is due to the characteristic of the model itself, in which the statistical model is usually a linear model, and ANN is nonlinear model. Each of them will perform well in linear and nonlinear data respectively. Therefore, it is hard for us to determine whether the time series problems under study are linear or nonlinear, particularly when we are dealing with real world time series data. With the intention to improve the forecasting accuracy, the combination of forecasting approaches has been proposed by many researchers [4,5,9,36]. From their studies, they indicate that the integrated forecasting techniques outperform the individual forecasts. The remainder of this paper is organized as follows. In section 2, further discussion on hybrid models is presented. Section 3 describes the methodology that will be implemented throughout this study. Then the proposed hybrid model for forecasting time series is discuss in detailed in section 4. Meanwhile, section 5 and 6 will describe the results of experiment to test the usefulness of the proposed hybrid model (GRANN_ARIMA). Finally, the conclusion that describes the contribution of this paper are summarized and several future research are listed in section 7.
2
2. Literature Review on Hybrid Models. Hybrid models have been introduced to overcome the deficiency of using individual model such as statistical methods (ARIMA, Multiple Regression and etc) and AI methods. Hybrid models merge different methods to improve the prediction accuracy. Hybrid models also can be referred as combined models or ensemble models and often used synonymously. Hybrid methods can be implemented in three different ways; linear models, nonlinear models and both linear and nonlinear model. In linear hybridization, two or more linear models are combined together using the same data set or different data set to gain ultimate forecasting value. Shamsuddin and Arshad [42] had used multivariate autoregressive moving average (MARMA) model to predict natural rubber prices for Malaysian Domestic market. Shamsuddin and Arshad’s work differs from Shamsuddin [43] in terms of techniques, which is implemented using different model based on different set of data. Authors combined auto regressive moving average (ARMA) and econometric model (multiple regression), where ARMA model is used to explain the residual yield from multiple regression model. The findings show that the forecasting errors produced by MARMA model is reduced by 4.5 per cent compared to the individual econometric models. This result indicates that the hybrid model has the potential to improve forecasting accuracy. Hybrid forecasting have also been implemented using nonlinear model, for instance hybridizing ANN with genetic algorithm (GA), fuzzy logic (FL) and rough sets (RS) [17, 25, 52, 58]. Authors found that by hybridizing ANN with these methods could improve the forecasting accuracy. Hou et al. [25] combined ANN and Rough set to predict air conditioning load. They used both univariate and multivariate time series data. Authors findings illustrate that the empirical results are better compared to the result given by ANN model alone. The result also indicates that if more relevant data are used in the study, the forecasting accuracy could be better. In this hybridization, GA, RS or FL are embedded in ANN as preprocessing tools to improve the ANN forecasting performance by extracting important and significant features in time series data. However, most of the hybridization methods, which have been proposed in the previous literature [9, 17, 43] have major drawbacks. Most of them are designed to combine similar methods; linear model with linear model, and nonlinear model with nonlinear model. In reality, time series data typically contain both linear and nonlinear patterns. Therefore, neither linear nor nonlinear model can be sufficient in modeling time series data since linear model cannot deal with nonlinear relationship. Additionally, nonlinear model also cannot handle both linear and nonlinear pattern equally well. To overcome this drawback, several studies have suggested combining linear model and nonlinear model. Previous studies have showed that combining different relevant methods could improve the forecasting accuracy. The merging of this structure can help the researchers in modeling complex autocorrelation structures in time series data more efficiently. Furthermore, by using different models or models that contradict with each other significantly; lower generalization variance or error could be generated [54]. Five studies have suggested in using the hybrid models, i.e., combining the ARIMA model and ANN. Zhang [54] used this combination and implemented on three data sets; Wolfs sunspot data, Canadian lynx data and British pound/US dollar change. They used a backpropagation learning algorithm to model the residual yield from ARIMA model. Pai and Lim [37] used a hybrid model to forecast daily stock by using support vector machine and ARIMA model. Lu et al. [28] used the hybrid model to forecast daily load data and Tseng and Tzeng [49] combined seasonal auto regressive integrated moving average (SARIMA) and backpropagation model to forecast seasonal time series data. Their results showed that the hybrid model produced better forecasting result compared to SARIMA model or ANN model alone. Jain and Kumar [26] found that more accurate results could be obtained by hybridizing ARIMA model and ANN in forecasting hydrologic time series. However, several researchers have argued that predictive performance improves when using hybrid models [2, 46, 47]. For example, Taskaya and Casey [47] showed that individual model outperformed five of nine data sets used. These inconsistent results indicate the need for further research on how to obtain a good forecasting result from hybrid linear and nonlinear model. It is observed that there are three weaknesses in the previous studies such as type of data used, redundancy factors and implementation of hybridization sequence. First, most of the studies used univariate time series data. Most of them are solely based on one historical data such as previous sales and previous income. However, Hou et al. [25] showed that
3
considering more significant input can improve the forecasting accuracy. Furthermore, Makridakis et al. [32, 33] illustrated that the accuracy of time series methods can be improved by incorporating multivariate information that will affect the future behavior of the series so that the prediction can be improved. Second, in most of the works utilizing ANN for prediction didn’t look at the possibility of input redundancy. For an ordinary user, ANN appears like a black box processor that does not have any capability to recognize insignificant inputs. Improper selection and redundancy of inputs can lead to instability that will affect the accuracy of prediction [30]. Several methods have been introduced to eliminate the redundancy inputs such as grey relational analysis [53]. Markov blanket model, decision trees [59], genetic programming [60] and adaptive genetic algorithm [10]. Third, the hybrid sequence in conventional hybrid is normally started with a linear model and followed by nonlinear model to model the residual. This is due to the ANN’s capability to deal with linear data that tend to be usually over fitting. But, Heravi et al. [24] had showed that linear ARIMA model outperformed ANN in forecasting nonlinear stock data. This result indicated that over fitting problem essentially occurred in both linear and nonlinear model. Nevertheless the issue is to choose the one that will suffer from over fitting problem acutely. Hence, in this study, a new hybrid approach for combining nonlinear model and linear model is proposed to overcome the drawbacks of previous studies by including more additional features; these include multivariate time series, feature selection in removing and selecting significant input data and altering the sequence of combination execution. In this study, grey relational analysis (GRA) is integrated with ANN (GRANN) to remove redundancy inputs. Grey relational analysis is employed due to its adaptability in dealing with small or large data sets [53].
3. Research Methodology We address four research questions as listed below based on the various issues mentioned above. In practice, multiple regression (MR) is usually used in modeling multivariate time series data due to its simplicity [12, 35, 50]. In this study, we attempt to use grey relational neural network (GRANN) instead of MR. Thus, the issues that need to be addressed are: o o o o
Could GRANN model outperform multi regression model in handling multivariate time series analysis? Would forecasting accuracy increase when a hybrid model is used instead of individual model in forecasting multivariate time series data? Would the sequence changes of hybridization implementation affect the forecasting accuracy? Would the proposed hybrid model GRANN_ARIMA give the best forecasting accuracy compared to others?
To address the above research questions, two experiments are conducted. The first experiment compares the performance between multiple regression model (MR) and grey relational neural network model (GRANN) in handling multivariate time series analysis, and the second experiment examines the accuracy of the combination between linear and nonlinear time series forecasting models in predicting multivariate time series analysis. Although several studies have shown that the combinations of linear and nonlinear model could improve the accuracy, but most of the studies employed univariate time series data [28, 37, 51]. Therefore, in this study, the experiments are conducted to see whether the same result will be formed whenever multivariate time series data are employed. Furthermore, to investigate the effect of changing hybrid sequence, two types of hybrid model (Hybrid I and Hybrid II) are developed. Hybrid I consists of MR and ANN using conventional hybrid sequence, and Hybrid II integrates GRANN and ARIMA with altered hybrid sequence. Hybrid I is used as comparative model in order to evaluate the performance of the proposed hybrid model. As benchmark, a conventional hybrid method as proposed in previous study (ARIMA_ANN) for handling univariate time series data is also developed. To find out
4
whether GRANN_ARIMA is the best model for forecasting multivariate time series data, several comparisons are conducted as stated below: Comparison between GRANN_ARIMA with individual models and hybrid model Comparison between GRANN_ARIMA and traditional ARIMA and MARMA model (each of them represent the standard benchmark for univariate individual model and hybrid multivariate model respectively ) Comparison between GRANN_ANN with ANN trained by second order error using LevenbergMarquardt (LVM) approach.
o o
o
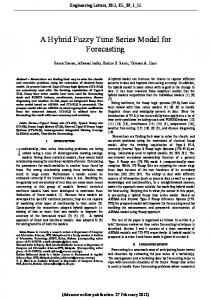
3.1 A Framework of the Proposed Hybrid Methods Fig. 1 and 2 illustrate the framework of the conventional hybrid model [28, 51, 54]; Hybrid I and the proposed Hybrid II. The conventional hybrid model and Hybrid I use the same sequence of hybridization in which a linear model is applied primarily to find the linear relationship in the data. Subsequently, ANN is utilized to model the residual derived from the linear model. In this case, we assume that the linear components have been fully identified by the linear model. Consequently, the residual left in the data presents the nonlinear component. To confirm that the assumption is true, McLeod and Li test are used to verify the nonlinearity of residual data, before the modeling process using ANN is carried out by Hybrid I. Time Series data
Time series data
Approach
Linear
Nonlinear Hybrid I
1 ARIMA Forecasting
2 ANN Forecasting
Hybrid II
1
2 Non linear
Linear
MR Forecasting
McLeod & Li test
1
2 Non Linear
GRA
Linear
McLeod & Li test
Integrated forecasting using univariate Data ANN forecasting
ANN Forecasting
Integrated forecasting using multivariate data Fig. 1 A Conventional Hybrid Model
Fig. 2 A Proposed Hybrid Model
5
ARIMA Forecasting
Meanwhile, proposed Hybrid II model and conventional hybrid model are reversed from each other in terms of the model used and the sequence of hybridization. In Hybrid II, GRANN is initially applied, and followed by linear model, ARIMA. In this model, GRA is used to select the significant inputs before the forecasting is implemented using ANN. McLeod and Li test is conducted to verify the linearity of the residual data; both of these steps are not included in conventional methods. Tab. I summarizes the similarities and differences of each model. Hybrid I is a hybrid model using conventional approach with multivariate time series data. Meanwhile Hybrid II (GRANN_ARIMA) is the proposed approach for forecasting multivariate time series data. Grey Relational analysis is used as feature selection tools to extract the significant factors that have effect on China crop yield and daily KLSE close price. Type of Hybrid Conventional Hybrid I Hybrid II (Proposed model)
Data Univariate Multivariate Multivariate
Model ARIMA, ANN MR, ANN GRANN, ARIMA
Sequence of hybridization Linear, Nonlinear Linear, Nonlinear Nonlinear, Linear
Feature Selection none Goodness Fit test Grey Relational Analysis
Tab. I Similarities and differences between Conventional Model and Proposed Hybrid Model
3.2 Experimental Data Setup To assist the analysis for benchmarking of the proposed model, two different datasets are used. The first sample contains 13 observations and represents a small scale data. These data are obtained from [53] and they had specified annual China gross grain crop yields with their affecting factors. Zhang and He [53] has combined two methods; neural network and rough set to predict the national gross grain crop yield from 1990 to 2003. Tab. II shows yearly data for gross grain crop yields and its affecting factors in China during 1990 till 2003. There are ten factors that affect the production of gross grain crop in China, and these include total power of agricultural, (a) , electricity consumed in rural areas, (b) , irrigation area, (c) , consumption of chemical fertilizer, (e) , areas affected by natural disaster, ( f ) , budgetary expenditure for agriculture, (g ) ,
sown area of grain crops, (h) , consumption of pesticide, (l ) , consumption of agricultural film, (m) , and agriculture laborers, (n) . The total production of grain crop yield is denoted by (d ) . Year 1990 1991 1992 1993 1994 1995 1996 1997 1998 2000 2001 2002 2003
a 28707.7 29388.6 30308.4 31816.6 33802.5 36118.1 38546.9 42015.6 45207.7 48996.1 52573.6 55172.1 57929.9
b 844.5 963.2 1106.9 1244.8 1473.9 1655.7 1812.7 1980.1 2042.1 2173.4 2421.3 2610.8 2993.4
c 47403.1 47822.1 48590.1 48727.9 48759.1 49281.2 50381.4 51238.5 52295.6 53158.4 53820.3 54249.4 54354.8
e 2590.3 2805.1 2930.2 3151.9 3317.9 3593.7 3827.9 3980.7 4083.7 4124.3 4146.4 4253.8 4339.4
f 17819 27814 25859 23133 31383 22267 21233 30309 25181 26731 34374 31743 27319
g 9.98 10.26 10.05 9.49 9.2 8.43 8.82 8.3 10.69 8.23 7.75 7.71 7.17
h 113466 112314 110560 110509 108544 110060 112548 112912 113787 113161 108463 106080 103891
l 73.3 76.1 79.5 84.5 97.9 108.7 114.1 119.5 123.2 132.2 128 127.5 131.2
m 481982 642145 780611 707321 887064 915487 1056151 1161532 1206867 1258674 1335446 1449286 1539484
n 33336.4 34186.3 34037.2 33258.2 32690.3 32334.5 32260.4 32434.9 32626.4 32911.3 32797.5 32451 31990.6
d 44624 43529 44265.8 45648.8 44510.1 46661.8 50453.5 49417.1 51229.5 50838.6 46217.5 45263.7 45705.8
Tab. II Grain crop yield and its affecting factors
KLSE data contains 200 observations of daily Kuala Lumpur Stock Exchange (KLSE) close price from 4th January 2005 till 21st October 2005, and it represents large scale data. Tab. III illustrates fraction of the stock market data set that was be used in this research. They are daily close price for KLSE
6
(Close _ KLSE ) , consumer Index (CI ) , construction index (CoI ) , gold index (GI ) , finance index (FI ) , product index (PI ), Mesdaq index (MI ) , mining index (MinI ) , plantation index (PlI ) , property index (Pr oI ) (ProI), syarian index (SI ) , technology index (TI ) , trading/ service index (TSI ) , composite index (CptI ) and industrial index (II ) . Date
CI
CoI
GI
FI
PI
MI
MinI
PlI
ProI
SI
TI
TSI
CptI
II
Close_klse
4-Jan-05
231.61
169.94
213.01
7460.1699
84.1
121.94
361.24
2415.1001
710.18
132.72
42.07
131.04
902.49
1946
5-Jan-05
232.22
169.78
214.07
7511.6602
84.16
122.06
365.64
2400.5
711.62
133.5
41.79
132.19
907.96
1949.29
902.49 907.96
6-Jan-05
232.78
169.66
214.76
7544.4902
84.32
122.35
352.42
2402.3101
714.54
133.88
41.84
132.7
910.42
1960.54
910.42 916.28
7-Jan-05
234.42
170.47
216.46
7630.5098
85.25
123.65
352.42
2416.8899
721.89
134.66
42.08
133.52
916.28
1974.95
10-Jan-05
235.9
171.61
217.17
7650.6201
85.48
124.13
361.24
2420.1399
725.84
135.13
42.32
133.87
919.02
1980.6801
919.02
11-Jan-05
237.2
173.49
219.79
7817.7002
86.19
125.78
359.03
2427.01
734.76
136.36
42.34
135.38
930.63
1997.16
930.63
12-Jan-05
237.75
172.93
220.19
7846.1899
86.13
125.52
361.24
2418.9099
736.34
136.56
41.84
135.77
933.33
2017.97
933.33
13-Jan-05
237.74
172.96
220.49
7823.4199
85.91
124.43
361.24
2424.23
736.25
136.71
41.76
136.51
934.1
2021.42
934.1
14-Jan-05
238.04
177.51
220.43
7941.6001
85.66
126.68
378.86
2404
735.01
136.03
41.64
135.19
935.53
2030.74
929.74
17-Jan-05
237.45
176.54
220.31
7844.52
85.8
125.65
352.42
2420.9199
733.58
136.29
41.76
135.83
932.26
2023.1899
932.26
18-Jan-05
238.3
176.14
220.99
7884.2202
86.24
125.35
370.05
2407.1799
733.87
136.7
41.76
136.4
937.56
2040.34
937.56
19-Jan-05
238.04
177.51
220.43
7941.6001
85.66
126.68
378.86
2404
735.01
136.03
41.64
135.19
935.53
2030.74
935.53
20-Jan-05
237.43
177.13
219.62
7919.7402
85
125.82
387.67
2400.26
734.97
135.32
41.64
134.53
929.72
2012.4399
929.72
24-Jan-05
236.86
176.26
218.32
7820.79
85.51
125.43
387.67
2410.21
732.82
134.79
41.46
133.4
923.33
2016.41
923.33
25-Jan-05
236.45
175.65
217.4
7839.4199
85.36
126.84
385.46
2406.1299
730.81
134.09
41.32
132.09
919.75
2000.63
919.75
26-Jan-05
236.11
176.44
217.86
7823.8999
85.12
125.87
381.06
2397.1299
731.46
134.68
41.25
133.12
923.37
1999.89
923.37
Tab. III Fraction of daily KLSE close price with 14 affecting factors
Essentially, each data set is divided into two parts: in-of-sample and out-of-sample data. In-of-sample data refers to the training data set and is used exclusively for model development. While out-of-sample refers to the test data and is used for evaluation of the unseen data. In other words, test data is used for an independent measure of how the model might be expected to perform on untrained data. However, in ANN, training data usually are divided further into training and validation set, where validation set is used to monitor network performance during training with the intention that early stopping criteria will be met if the network attempts to over fit the training data.
3.2.1
Grey Relational Analysis
Grey relational analysis (GRA) is an analysis method, that has been introduced in Grey System by Deng Julong [13, 14]. GRA is used to evaluate the degree of correlation for different data sequences. The degree (x) ( y) of correlation between a data sequence and the reference sequence is expressed by a scalar within bound of 0 and 1. If the degree of correlation is near to 1, it indicates the high correlation between x and y . There are 3 main steps in GRA. The first step is data pre-processing. Data pre-processing is normally required due to the range and unit of one data sequence might differ from others. Therefore, data must be normalized, scaled and polarized initially into a comparable sequence before proceeding to other steps. There are few equations for data preprocessing using grey relational analysis. In this study, Equation (1) is employed (Tosun[61]): x* (k ) =
xi0 (k ) − min xi0 (k ) max xi0 (k ) − min xi0 (k )
where, i = 1,...m;
k = 1,...n.
7
,
(1)
m is number of experimental data items, n is the number of parameters,
x i0 (k ) is the original sequences, xi* ( k ) is the sequences after data preprocessing, O
min xi0 (k ) and max xi0 (k ) is the smallest and the largest value of x i (k ) .
The range of data is adjusted so as to fall within [0,1] range. The second step is to locate the grey relational coefficient by using Equation (2), (Tosun[61]):
ξ i (k ) = where,
∆ min + ζ∆ max , ∆ 0,i (k ) + ζ∆ max
(2)
ξ i (k ) = grey relational coefficient at any data point (k ) , ∆ 0i =
deviation sequences of the reference sequence and comparability sequence, ∆ 0, j = x 0* (k ) − x i* (k ) , ∆ min = min min x 0* (k ) − x *j (k ) , ∀j∈i∀k
∆ max = max max x 0* (k ) − x *j (k ) , ∀j∈i∀k
x 0* x i*
(k ) = (k ) =
the reference sequence, and the comparative sequence.
ζ is known as identification coefficient with ζ ∈ [0,1], and normally ζ =0.5 is used. Finally, to obtain the grey relational grade, the average value of grey relational coefficient is computed and it is defined as (Tosun[61]):
γi =
1 n ∑ ξ (k ) n k =1 i
,
(3)
where n is the number of the objective function or the reference sequence, The grey relational grade comparability sequence.
3.2.2
γi
x 0*
(k ) .
represents the level of correlation between the reference sequence and the
Application of Grey Relational Analysis
Tab. IV and V illustrate the affecting factors that yield by applying GRA, which have the greatest influence for annual grain crop yield and daily close price for KLSE. Based on the calculated value of grey relational grade, only six factors; a, b, c, e, h and l are selected as the inputs to ANN to predict the grain crop yield. This result is alike to the previous study by Zhang and He [53]. While, for KLSE daily close price, out of 14 affecting factors being observed, only four factors were identified as the most influential factors; SI , TSI , CmpI and II . Therefore, these four factors are used as inputs to ANN to predict the next day close price for KLSE.
8
Year 1990 1991 1992 1993 1994 1995 1996 1997 1998 2000 2001 2002 2003
a
b
c
1.0000 0.9767 0.9452 0.8936 0.8257 0.7464 0.6633 0.5446 0.4354 0.3057 0.1833 0.0944 0.0000
1.0000 0.9448 0.8779 0.8137 0.7071 0.6225 0.5494 0.4715 0.4427 0.3816 0.2662 0.1780 0.0000
e 1.0000 0.9397 0.8293 0.8094 0.8049 0.7298 0.5716 0.4483 0.2962 0.1721 0.0769 0.0152 0.0000
h 1.0000 0.8772 0.8057 0.6789 0.5840 0.4263 0.2924 0.2051 0.1462 0.1230 0.1103 0.0489 0.0000
l 0.0324 0.1488 0.3261 0.3312 0.5298 0.3766 0.1252 0.0884 0.0000 0.0633 0.5380 0.7788 1.0000
d 1.0000 0.9525 0.8947 0.8098 0.5823 0.3990 0.3073 0.2156 0.1528 0.0000 0.0713 0.0798 0.0170
0.8578 1.0000 0.9043 0.7247 0.8726 0.5932 0.1008 0.2354 0.0000 0.0508 0.6509 0.7747 0.7173
Tab. IV Affecting factors for grain crop yield selected by GRA Date SI 4-Jan-05 5-Jan-05 6-Jan-05 7-Jan-05 10-Jan-05 11-Jan-05 12-Jan-05 13-Jan-05 14-Jan-05 17-Jan-05 18-Jan-05 19-Jan-05 20-Jan-05 24-Jan-05 25-Jan-05 26-Jan-05
TSI
CmpI
II
Close_klse
0.3298
0.5428
0.5454
0.7306
0.5454
0.2653
0.4615
0.4858
0.7114
0.4858
0.2339
0.4254
0.4591
0.6456
0.4591
0.1694
0.3675
0.3953
0.5614
0.3953
0.1306
0.3428
0.3654
0.5279
0.3654
0.0289
0.2360
0.2391
0.4316
0.2391
0.0124
0.2085
0.2097
0.3100
0.2097
0.0000
0.1562
0.2013
0.2898
0.2013
0.0562
0.2495
0.1857
0.2354
0.2487
0.0347
0.2042
0.2213
0.2795
0.2213
0.0008
0.1640
0.1636
0.1793
0.1636
0.0562
0.2495
0.1857
0.2354
0.1857
0.1149
0.2961
0.2490
0.3423
0.2490
0.1587
0.3760
0.3185
0.3191
0.3185
0.2165
0.4686
0.3575
0.4113
0.3575
0.1678
0.3958
0.3181
0.4157
0.3181
Tab. V Affecting factors for KLSE close price selected by GRA
On the other hand, in multiple regression analysis, goodness fit test is used to recognize the proper inputs. The significant inputs are identified based on t-values and p-values. If t-values are less than 1 and p-values are above some accepted level, such as 0.05, then this variable is excluded from the list.
3.2.3
Nonlinearity test: McLeod and Li Test
Nonlinearity test is implemented to examine the degree of linearity of time series data in our study. The McLeod and Li Test [34] is based on the autocorrelations of the squared residuals produced by ARIMA model using n observations as shown below: q
Q = n(n + 2)∑ i =1
r 2 (i ) , n −i
(4)
where,
r (i ) an autocorrelation of the squared residual, and n is the sample size.
9
The null hypothesis of linearity, the above statistic is asymptotically distributed by number of autocorrelations (readers may consult [34] for details).
3.2.4
χ q2 ,
where q is the
Performance Measurement
To evaluate the performance of the proposed hybrid model; GRANN-ARIMA, four statistical tests are carried out. These tests are Root Mean Square Error (RMSE), Mean Square Error (MSE), Mean Absolute Percentage Error (MAPE) and Mean Absolute Deviation (MAD). Following are mathematical formulas for each test: 1 n (observed t − predicted t )2 . ∑ n t =1
RMSE =
MSE =
1 n
n
∑ (observed ∑ t =1
n
MAD =
(6)
t =1 n
MAPE =
− predicted t )2
t
(5)
∑
observed t − predicted t observed t
X
100 n
observed t − predicted t n
t =1
(7) (8)
where n is the number of forecasting periods, observed t is the actual time series values and predicted t is the forecasting time series values. GRANN-ARIMA is the best alternative model for forecasting multivariate time series data if it gives the lowest values for RMSE, MSE, MAD and MAPE compared to other models. The RMSE, MSE, MAD and MAPE are calculated based on the out-of-sample data.
4. Proposed Hybrid Method Most of the real world problems consist of linear and nonlinear patterns. Even though, there are a lot of methods that can be applied to solve time series forecasting problems, but none of them can handle both patterns simultaneously. To tackle these two patterns uniformly well, hybridizing the linear and nonlinear model is proposed to improve the forecasting accuracy.
4.1 Conventional Hybrid Method for Univariate Time Series Data In the literature, several works related to hybrid nonlinear and linear models (ARIMA model as linear model and ANN as nonlinear model) to forecast univariate time series data could be found [28, 44, 49, 51, 54]. Authors applied ARIMA model initially to the data and followed by ANN for data residual. This hybrid model, (Yt ) , may be illustrated as: Yt = Lt + N t = ARIMA + ANN
(9)
where,
Lt and N t are linear and nonlinear component of the hybrid model Yt that using univariate time series data. Here, we used subscript time series respectively.
t
and
tm
to represent univariate time series and multivariate
10
4.2. Hybrid Model for Multivariate Time Series Data Using Conventional Approach In this hybridization, Multiple linear regression (MR) is used to represent the linear model, Ltm and ANN represents nonlinear model, N tm in handling multivariate time series data. The proposed Hybrid I model
(Y ) is given as, 1 tm
1 Ytm = Ltm + N tm
= MR + ANN
(10)
1 Let Lˆ tm is the forecast value of MR model at time t , and e tm represent the residual at time t as obtained from MR model, then:
1 e1tm = Ytm − Lˆ tm
(11)
1 These residual, e tm represent the nonlinear component of multivariate time series data. Therefore, ANN 1 are used to model e tm and can be represented as follows:
e 1 tm = f (ε tm −1 , ε tm − 2 ,..., ε tm − n , w ) + ∆ tm
(12)
where f is a nonlinear function determined by ANN structures along with connection weights, and ∆ tm is the random error. Hence, the hybridized forecast given by Hybrid I model, )1 Ytm = Lˆ tm + Nˆ tm
(13)
where Nˆ tm is the forecast value of Equation (12). Consequently, Hybrid I model can be determined by two steps. First MR model is used to analyze the linear part of the multivariate time series problem. After that, ANN model is build to model the residuals produce by linear model, MR.
4.3 Proposed Hybrid II Model In proposed method, ARIMA is used as linear model, Ltm and GRANN is used as nonlinear model, Both models are hybridized as shown by Equation (14);
N tm .
Y II tm = N tm + Ltm = GRANN + ARIMA
(14)
II where Ytm denoted the Hybrid II model that composed of nonlinear GRANN model and linear ARIMA ) II model. Assume that N tm is the forecast value of GRANN model at time t, and let etm represent the residuals at time t as obtained from GRANN model, then
) II II etm = Ytm − N tm
(15)
11
The residuals now represent the linear part of the data, which enables us to employ ARIMA to model the residual and can be represented as below: II etm = f (etm −1, etm − 2,..., etm −n ) + δ tm
(16)
where f is a linear function modeled by ARIMA model, and δ tm is the random error. II Therefore, the hybridized forecast obtained from Hybrid II, ( Yˆ ) model can be written as tm
II Yˆtm = Nˆ tm + Lˆ tm
where
(17)
Lˆ tm is the forecast values obtained from Equation (16) above.
Similar to Hybrid I model, Hybrid II model can be determined through two steps. But both hybrid models are differs in terms of hybridization execution where in Hybrid II model, nonlinear model is implemented first than followed by linear model.
5. Experimental Results Discussions for the results of this study are divided into two parts; Part 1 and Part 2. Part 1 discusses the result that is produced by Experiment I, and Part 2 discusses the result from Experiment II.
5.1 Results from Experiment I As we mentioned earlier, the aim of this experiment is to investigate the capability of GRANN model in analyzing multivariate time series in searching the relationships between the independent and dependent variables. Before modeling process is done using ANN, grey relational analysis is employed to obtain the significant affecting factors that affect the production of crop yield in China and the KLSE close price. Tab. VI depicts the structure and learning parameter used in developing GRANN and the error produced in training and testing phase for both data sample. For example, based on the calculated value of grey relational grade, only six factors; a, b, c, e, h, and l are selected as the inputs to grey relational artificial neural network (GRANN) to predict the grain crop yield. Thus, a three layer feedforward neural network with a single output unit, 12 hidden units and 6 input units are used in this study with the learning rate ( α ) and momentum ( β ) are (0.5, 0.9) respectively. The network structures and learning parameters are determined by trial and error. In this study, we only consider the situation of one-step-ahead forecasting. Therefore, only one output node is employed. The RMSE for the best GRANN model are 232 for the training phase and 417 for the testing phase.
ANN structure Number of input nodes (affecting factors determined by GRA) Number of hidden nodes Number of output nodes Learning parameter Learning rate(α ) Momentum (β)
Crop Yield
KLSE close price
Six nodes (a, b, c, e, h, l )
Four nodes (CptI , TSI , SI , II )
Twelve nodes One node
Nine nodes One node
0.5 0.9
0.5 0.9
Tab. VI Grey relational artificial neural network (GRANN) structure.
12
Ten independent variables are used to build multi regressions model for grain crop yield. Several models are built and evaluated based on statistical goodness fit. However, the final model only used 4 independent variables; a, c, h and n . The equation for grain crop yield is given as:
Crop yieldt =
f (a t , c t , ht , nt ) (18)
= −2.45a t + 2.83c t + 0.44ht − 0.61nt − 92298 where, a t is a total power of agricultural at period t , c t is an irrigation area at period t , ht is a sown area of grain crops at period t , and nt is an agriculture labors at period t .
For KLSE close price, 14 variables are used initially; but only three variables are used finally; finance index (FI ) , trading/service index (TSI ) and composite index (CptI ) . The equation for KLSE close price is shown below: Close KLSEt = 2.20402 − 0.05FI t − 0.03TSI t + 1.05CptI t
(19)
where FI t is the value of finance index at period t , TSI t is the value of trading/ service index at period t , and CptI t is the value of composite index at period t . 2
Various statistical tests can be used to validate the models. In this study, R , adjusted 2
R 2 , standard
2
error, S e , F-test and p-value are used to validate the model. R and adjusted R are the square of the correlation between the observed values of the response variable and the fitted values from the regression equation. Therefore, they are used to indicate the robustness of the model in explaining the actual consumption of the data. Both model are tolerable since
R 2 and adjusted R 2 have high values with small
standard error, S e (Refer to Tab. VII). In the interim, F-test and p-values are used to determine the importance of the model. From Tab. VII, the F-test is considered significant since p-value is approaching to zero. Therefore, Equation (18) and (19) is considered reasonable enough for predicting grain crop yield.
R2 Crop Yield Close_KLSE
0.9760 0.9998
adjusted 0.9590 0.9996
R2
Se
F-values
P-values
584.8000 42257.0000
60.1200 254400.0000
0.00006 0.00001
Tab. VII Statistical test for Grain crop and KLSE close price
Comparing input parameter used by GRANN and MR in forecasting crop yield, it is found that three variables selected by both models are equal, thus, indicating the importance of these variables {a, c, and h}. The result shows that the total power of agricultural (a) , irrigation area (c) and sown area of grain crops (h) are the most affecting factors to grain crop yield in China since they are preferred by both MLR and GRANN. While, composite index (CptI ) and trading/service index (TSI ) are the most influential factors that affect the movement of KLSE close price.
13
5.2 Comparison between GRANN Model and MR Model In order to examine the performance of GRANN in forecasting multivariate time series, the result from multiple regression(MR) model and GRANN model are compared. RMSE, MSE, MAD and MAPE are used to observe the forecasting performance between GRANN and MR models. Tab. VIII gives the performance measure of GRANN models and MR models, and the prediction outputs of each model are shown in Fig. 3(a) and (b). Tab. VIII shows the predicted error values of crop grain yield for next two years (2002 and 2003) given by GRANN model and MR. The application of GRANN model gives the smallest error (RMSE, MAPE, MSE, MAD) compared to MR model. Crop yield MR 3207537.00 1790.96 1321.50 2.89
Error MSE RMSE MAD MAPE
KLSE close price MR 2245.37 12.66 12.67 1.37
GRANN 174165.00 417.33 369.45 0.81
GRANN 540.89 6.22 6.17 0.67
Tab. VIII Forecasting values of GRANN versus MR
Fig. 3(a) shows an increasing production of grain crop in 2003. Output from GRANN model shows that there is a slight increment (0.1%) for grain crop yield in 2003. However, MR model predicts the production of grain crop is going to be decreased about 4.8% in 2003. The actual values shows about 0.9% increment in 2003 for crop grain yield. Hence, we can conclude that GRANN forecasting result is more reliable than MR
46000 45500 45000
104 t
44500 44000 43500 43000 42500 42000 41500 2002
Year act ual
ANN
2003 MR
Fig. 3a Forecasting values for each model (Crop yield)
Tab. VIII depicts the forecasting error generated by GRANN and MR in forecasting KLSE daily close price for next 14 days. The values of RMSE, MAPE, MSE, MAD given by GRANN is smaller than MR. The forecasting values given by GRANN is closer to the actual value as illustrated in Fig. 3(b). This indicates that the forecasting results yield from GRANN are more accurate compared to MR. From the study, we found that GRANN performs better than MR, because ANN provides superior methodology than multivariate analytical [3, 38, 40]. This is conformed with the results of the previous study that ANN is suitable for multivariate data analysis [39]. This result also strengthened our justification of implementing ANN as multivariate model in our study.
14
Close price
935 930 925 920 915 910 905
00 5
00 5 10 /1
9/ 2
7/ 2 10 /1
10 /1
5/ 2
00 5
00 5 3/ 2
00 5 10 /1
1/ 2
/2 00 5
10 /1
10 /9
/2 00 5
10 /7
/2 00 5
10 /5
10 /3
/2 00 5
900 895
Date actual
MR
GRANN
Fig. 3b Forecasting values for each model (KLSE close price)
5.3 Results of Experiment II The second experiment is conducted with two main objectives. The first objective is to compare the performance of individual and proposed hybrid model in forecasting time series. In order to achieve this objective, the proposed hybrid model that consists of nonlinear and linear model is developed. [42] proposed hybrid linear model known as MARMA to predict natural rubber price. In their study, they applied MR and ARMA method to model the residual. However, in our study, we developed two hybrid models; Hybrid I and Hybrid II. Both methods pooled linear and nonlinear model using multivariate time series data. In Hybrid I, MR is used as multivariate tool in conjunction with ANN to model the residual; in Hybrid II, GRANN is employed as multivariate tool in cooperation with ARIMA to model the residual. MR and GRANN model are used as a yardstick to measure the performance of the proposed hybrid model respectively. The second objective is to investigate the stream of implementation that can affect the performance of the proposed model in forecasting multivariate time series data. Previous studies by [28, 44, 49, 51, 54] have employed linear model originally to the data, and followed by nonlinear model (ANN) to predict the residual. In this study, the sequence is changing, i.e., nonlinear model primarily, and followed by linear model for residual. Time series forecasting can be obtained by integrating the values from linear and nonlinear model.
5.3.1
Experimental Results for Hybrid I Model (MR_ANN)
Results obtained from this test verify that the data are nonlinear and ANN is suitable to model the residual. Tab. IX shows the predicted residual value from ANN model. The network structure for crop yield is 2-42; 2 inputs unit, 4 hidden units and 2 output units respectively. The 5-11-4 is the network structure used for KLSE close price. The learning and momentum rates are set between [0.5, 0.9]. The predicted value from MR model (from Experiment I) is integrated with predicted value from ANN model to get the ultimate forecasting value for China total grain crop yield in year 2002 and 2003, and 14 days ahead for KLSE close price. Tab. IX shows that the RMSE, MSE, MAPE and MAD for Hybrid I model which combine MR and ANN model have the lowest value compare to the MR model alone.
15
Hybrid I Error RMSE MSE MAD MAPE
Crop Yield MR 1790.00 3207537.00 1322.00 2.89
KLSE close price MR 12.66 2245.37 12.67 1.37
MR_ANN 1290.00 1664384.00 1279.00 2.81
MR_ANN 12.28 2112.34 12.27 1.33
Tab. IX Results for Hybrid I Model
Based on RMSE, the prediction accuracy in Hybrid I model increases about 28% and 30% for crop yield and KLSE close price. As a result the combination of 2 different models that have dissimilar characteristics (linear and nonlinear) can improve the forecasting accuracy in multivariate time series analysis.
5.3.2
Result from Proposed Hybrid II
In this experiment, we alter the sequence order of implementation proposed by previous researchers, in which a nonlinear model is employed initially and followed by linear model for the residual. However, in this study, GRANN is used as nonlinear model and ARIMA as linear model. McLeod and Li test is employed to check the nonlinearity degree of the data. The results from this test verify that the residuals data are linear; hence, ARIMA is suitable to model the residual. ARIMA (1,0,1) is used to model the residual and the predicted residual for 2 years ahead and ARIMA(0,1,3) is used to model the residual daily KLSE close price (Tab. X). The predicted value from GRANN model (from Experiment I) is integrated with predicted value from ARIMA model to get the final forecasting value for both samples. Tab. X shows the result for the proposed Hybrid II models which gives smaller prediction error (GRANN_ARIMA). This result indicates that the forecasting ability of the multivariate time series data is improved even further if GRANN_ARIMA model is adopted. The forecasting accuracy of GRANN_ARIMA in both samples is increased for about 33% and 73% compared to the prediction given by GRANN model.
Hybrid II Error RMSE MSE MAD MAPE
Crop Yield GRANN 417.33 174165.20 369.45 0.81
GRANN_ARIMA 278.19 154777.00 212.49 0.46
KLSE Close Price GRANN GRANN_ARIMA 6.22 1.67 540.89 39.33 6.17 1.52 0.67 0.16
Tab. X Results for Proposed Hybrid II
The results of these experiments have proven that the performance of the proposed model is better compare to individual model in analyzing and forecasting multivariate time series data, thus conform to the previous results obtained from Hybrid I .
6.0 A Comparison of Hybrid I, Hybrid II and Conventional Hybrid models Experimental results yield from this study reveals that both the blend methods of Hybrid I and Hybrid II can improve the forecasting accuracy. Nonetheless, the arising issue is to choose which one is better, Hybrid I or Hybrid II. Consequently, a comparison of forecasting performance for both hybrid models (Hybrid I and Hybrid II) is given in this section to examine the effect of forecasting performance by varying the order of implementation on multivariate time series data. As depicted in Tab. XI, RMSE, MSE, MAPE and MAD given by both Hybrid II model is lower than Hybrid I with the forecasting accuracy increases 78% and 86% in each sample data respectively. These results show that the best method for combining model is Hybrid II. At the same time, this result indicates
16
that altering the sequence of hybridization will affect the accuracy. For illustration, error given by the proposed approach, GRANN_ARIMA is better compared to MR_ANN with conventional hybridization approach.
Error
Crop Yield Hybrid I (MR_ANN)
Hybrid II (GRANN_ARIMA)
KLSE close price Hybrid I Hybrid II (MR_ANN) (GRANN_ARIMA)
RMSE MSE MAPE MAD
1290.00 1664384.00 2.81 1279.00
278.19 154777.00 0.47 212.49
12.28 2112.34 1.33 12.27
1.67 39.33 0.16 1.52
Conventional Hybrid (ARIMA_ANN) 10.12 1434.52 0.92 8.48
Tab. XI Comparison performance of Hybrid I , Hybrid II and conventional hybrid model
To further evaluate the performance of GRANN_ARIMA model, a comparison with conventional hybrid model (ARIMA_ANN) that proposed by previous studies are carried out. ARIMA_ANN model cannot be developed for crop yield data since the sample size is too small and insufficient for developing ARIMA model. From the experiment, we found that the forecasting performance improves better if Hybrid II is used instead of using conventional hybrid. This shows that the type of data being used will also influence the forecasting performance. The more relevant data being considered in the experiment, the better the performance of the forecasting model; GRANN_ARIMA used multivariate time series instead of univariate time series used in ARIMA_ANN. Fig. 4(a) and 4(b) summarize the results of examining the affect of altering the sequence of hybridization. It is clear that the GRANN_ARIMA performs better than the other two hybrid models. As shown in Fig. 4(a) and 4(b) the forecasting value from hybrid GRANN_ARIMA is more accurate compared to MR_ANN and ARIMA_ANN since the values are approaching to the actual value. The value 2 2 of R , adjusted R in MR and the value of Ljung-box test in ARIMA are high since these values are based on in-sample data. Therefore, there is no guaranteed that the model can also give a high performance for out sample data. 46500
Crop Yield
46000 45500 45000 44500 44000 2002
2003 Year
Actual
MR_ANN
GRANN_ARIMA
Fig. 4(a) Comparison of Hybrid I and Hybrid II (Crop yield)
Tab. XI showed that the RMSE, MAD, MAPE and MSE that are calculated based on out of sample data for MR_ANN or ARIMA_ANN is worse compare GRANN_ARIMA in both samples data used. The difference performance between in sample and out sample indicates that over fitting exists. For example, over fitting occurs when determining the appropriate parameters to be included in MR model. Goodness fit test, which used to check the adequacy of the MR model, has probably excluded the significant factors that should be considered.
17
According to [54], we need to apply linear model first to avoid over fitting in artificial neural network. However, the result from this study shows that over fitting also occurred in linear model. This result supports the findings given by [24]. Therefore, we conclude that over fitting can also occur in linear model. Based on the MR and ARIMA performance, the probability of over fitting arises in linear model is higher compared to nonlinear model. This result supports our claims to change the sequence of hybridization for better forecasting.
Close_KLSE(RM)
945 935 925 915 905
20 05 10 /1 1/ 20 05 10 /1 3/2 00 5 10 /1 5/2 00 5 10 /1 7/ 20 05 10 /1 9/ 20 05
10 /9 /
20 05
10 /7 /
20 05
10 /5 /
10 /3 /
20 05
895
Date Actual
MR_ANN
GRANN_ARIMA
ARIMA_ANN
Fig. 4(b) Comparison of Hybrid I and Hybrid II (KLSE Close Price)
To obtain more accurate forecasting result, Hybrid II methods using GRANN_ ARIMA model is suggested because it can work well in both sample data that represent small scale and large scale data. This result may be explained by the fact that : i) ANN is capable to deal equally well with linear and nonlinear data; (ii) ANN is accepted as universal approximator; (iii) Furthermore, past studies have shown that over fitting problem in ANN can be avoided by using cross validation and optimal learning parameters [29].
6.1 Comparison of GRANN_ARIMA (Hybrid II) model with benchmark model From the previous experiment, we found that GRANN_ARIMA is the best model for forecasting multivariate time series data. To further validate our findings, assessment performance with benchmark model for univariate and multivariate model are conducted. In this study, MARMA and ARIMA model are selected because they are linear statistical model. Furthermore, ARIMA or known as Box-Jenkins model has dominated time series forecasting for more than half a century. Additionally, ARIMA modeling has been used used in univariate framework as a sophisticated benchmark for evaluating alternative proposal [1, 48, 54]. MARMA is used in this study because it is has been used as statistical modeling techniques for hybrid model in previous study [42, 43]. Tab. XII shows the performance of each model. We found that accuracy of GRANN_ARIMA is always better than MARMA and ARIMA model. This result is not surprising because ARIMA is a linear model and MARMA model is a combination of two linear models. Due to this reason, it cannot handle nonlinear data as well as nonlinear model. Error
Crop Yield KLSE close price GRANN_ARIMA MARMA ARIMA GRANN_ARIMA MARMA RMSE 278.19 1742.51 na 1.67 12.68 MSE 154777.00 3036334.00 na 39.33 2252.32 MAPE 0.47 2.53 na 0.16 1.37 MAD 212.49 1158.12 na 1.52 12.67 ** na : not applicable: model cannot be developed Tab. XII Comparison of GRANN_ARIMA with MARMA and ARIMA
18
ARIMA 6.33 560.45 0.44 4.07
Tab. XII depicts that the comparison with individual linear ARIMA cannot be implemented for crop yield data. Due to small sample data set being used and the non stationary time series data, ARIMA model cannot be developed. Theoretically, the minimum of data that need to apply ARIMA model is about 40 to 50 periods of data. This model needs more data for tracking the pattern or component in time series data prior to the modeling process. Before model estimation can be done, time series data must be in a stationary form. Otherwise, the differencing process need to be implemented and it will reduce the size of the data. In this study, the data is an annual data with approximately 11 periods, and non stationary. These data need to be transformed into a stationary form. From the result, it shows that the propose GRANN_ARIMA model can also perform well in non stationary and small size of time series data.
6.2 Comparison of GRANN_ARIMA model with ANN using second order error (Lavemberg Marquet) Tab. XIII demonstrates the result given by GRANN_ARIMA model and ANN model using second order error; Lavemberg Marquet. In this study, ANN model using Lavemberg Marque (LVM) is developed using the default parameters given by MATLAB. Tab. XIII shows the results of the experiments. For the first data set (crop yield - small scale data), the performance of LVM is slightly better than GRANN_ARIMA with 5% growth. On the other hand, GRANN_ARIMA performs much better than LVM in second data set (KLSE close price which represent large scale data) with more than 80% growth.
Error RMSE MSE MAD MAPE
Crop Yield GRANN_ARIMA 278.19 154777.009 212.499 0.47
LVM 260.79 125791.91 210.65 0.46
KLSE close price GRANN_ARIMA 1.67 39.33 1.52 0.16
LVM 8.51 1014.45 6.27 0.68
Tab. XIII Comparison of GRANN_ARIMA with Lavenberg Marquet (LVM)
6.3 Summary of the Experimental Result In this section, a summary of the experimental result that has been conducted in this study is presented. Tab. XIV(a) and XIV(b) depict the errors generated by the individual model and proposed Hybrid I, Hybrid II model, Conventional hybrid model, Benchmark model and ANN with second order error. ARIMA and MARMA are used as a yardstick model which represent traditional statistical individual and hybrid model accordingly. RMSE, MSE, MAD, and MAPE are used to quantify the difference between actual output and predicted output given by each model. It is shown from Tab. XIV(a) that the proposed hybrid models always give better result compared to individual model regardless of the sequence of the proposed hybrid model. For instance, an error produced by individual model is greater than error produced by the proposed hybrid model (MR and MR _ANN; GRANN and GRANN_ARIMA) except for ANN trained with second order error (LVM). As shown in the Tab. XIV(a), the difference of RMSE, MSE, MAPE and MAD produced from the proposed Hybrid II model that comprises of GRANN and ARIMA and LVM are small, where the difference of accuracy percentage is 0.02; almost approaching to zero. As a consequence, we can conclude that both of them are comparable
19
Model
Individual
Model
Conventional Hybrid
Hybrid I
Hybrid II
Benchmark
Model
MR
GRANN
ARIMA_ANN
MR_ANN
GRANN_ ARIMA 278.19 77389.00 0.47 212.49 99.5%
MARMA
ARIMA
Second order error LVM
1742.51 3036334.00 2.53 1158.12 97.2%
-na -na -na -na -na
260.79 125791.91 0.46 210.65 99.52%
RMSE 1790.96 417.33 -na 1290.11 MSE 3207537.00 174165.00 -na 1664384.00 MAPE 2.89 0.81 -na 2.81 MAD 1321.50 369.45 -na 1278.98 Accuracy 97% 99 % -na 97.3% .** na : not applicable; model cannot be developed
Tab. XIV(a) Statistical test and accuracy percentage for individual model and hybrid model (Crop Yield)
Fig. 5(a) shows that proposed Hybrid II (GRANN_ARIMA), LVM and GRANN model are able to give prediction values that are closed to actual value compared to Hybrid I, MARMA and MR model. Moreover, they can also predict the behavior of the data better than MR, MARMA and Hybrid I model. They manage to predict the increment pattern in the grain crop in 2003. However, Hybrid I, MARMA and MR model failed to predict this pattern. Fig. 5(a) shows an increasing production of grain crop in 2003. Output from GRANN, GRANN_ARIMA and LVM model show that there are increment about 0.1%, 0.2% and 0.04% respectively for grain crop yield in 2003. The actual values shows about 0.9% increment in 2003 for crop grain yield. Hence, we can say that the prediction given by our proposed hybrid model, GRANN_ARIMA, is more significant and reliable since it manages to forecast the augmentation more proper compared to LVM and GRANN than GRANN and LVM.
Crop yield(tonn)
47500 46500 45500 44500 43500 42500 2002
2003
Year Actual
GRANN
MR
LVM
GRANN_ARIMA
MARMA
MR_ANN
Fig. 5(a) Comparison of Forecasting Values Yield from Each Model (Crop yield)
In view of that, GRANN_ARIMA is ranked the first followed by LVM and GRANN. Hybrid model that used hybrid I approach is ranked the fourth, and followed by MARMA, and finally followed by MR model. Based on the results obtained from the experiment, we conclude that the best predictor for Grain Crop yield for China is the proposed Hybrid II model that consists of GRANN and ARIMA model Tab. XIV(b) show the statistical test results and accuracy percentage obtained from each individual and hybrid model used in modeling forecasting model to predict daily close price for KLSE. From the table, it shows that RMSE, MSE, MAPE, MAD for Hybrid II model that represent GRANN_ARIMA is the lowest compared to the individual model, or benchmark model or Hybrid I model, conventional model and LVM.
20
Individual
Model
Conventional Hybrid
Hybrid I
Hybrid II
Benchmark
Model
Error
MR
GRANN
ARIMA_ANN
MR_ANN
MARMA
ARIMA
RMSE MSE MAPE MAD Accuracy
12.66 2245.37 1.37 12.67 98.60
6.22 540.89 0.67 6.17 99.33
10.12 1434.52 0.92 8.48 99.08
12.28 2112.34 1.329 12.27 98.67
GRANN_ ARIMA 1.67 39.33 0.16 1.52 99.84
Second order error LVM
12.68 2252.32 1.37 12.67 98.62
6.33 560.45 0.44 4.07 99.56
8.51 1014.45 0.68 6.27 99.32
Tab. XIV(b) Statistical test and accuracy percentage for individual model and hybrid model(KLSE close price)
Unlike LVM, the forecasting accuracy percentage of GRANN_ARIMA is increased for about 0.5%. The results from this study also depicted that forecasting performance yield from individual model (ARIMA) outperformed the conventional hybrid (ARIMA_ANN), and it conforms with the previous study. This discrepancy may be due to insufficient data information, over fitting problems in linear model and redundancy information while modeling conventional hybrid model, and ARIMA_ANN. The outcome from this study also revealed that these discrepancies can be solved by using our proposed hybrid model, GRANN_ARIMA. Fig. 5(b) summarizes the results given in Tab. XIV(b). It is clear that the GRANN_ARIMA performs better than the other models. As shown in Fig. 5(b) the forecasting value from hybrid GRANN_ARIMA is more accurate due to its behavior in approaching nearer to actual value.
Close_KLSE(RM)
940 930 920 910 900
00 5
00 5
00 5
00 5
10 /1 9/ 2
10 /1 7/ 2
10 /1 5/ 2
00 5
10 /1 3/ 2
10 /1 1/ 2
20 05 10 /9 /
10 /7 /
20 05
20 05 10 /5 /
10 /3 /
20 05
890
Date actual MARIMA
MR GRANN_ARIMA
GRANN LVM
ARIMA(2,1,1)
MR_ANN
ARIMA_ANN
Fig. 5(b) Comparison of Forecasting Values Yield from Each Model (KLSE close price)
From the result, we wind up that there are three factors that will influence the accuracy of hybrid model. The first factor is the type of model used in combination. As shown in Fig. 5(a) and 5(b), the performance of hybrid model that consists of two dissimilar models which have different characteristics (linear and nonlinear models) gives better results compared to the hybrid model that combine both linear models. The second factor is the sequence of the implementation for hybridization. From Tab. XIV(b) and Fig. 5(b), it shows that by altering the conventional sequence of hybridization, the forecasting error is decreasing and at the same time the forecasting accuracy is increasing. The third factor is the type of data
21
being used; the forecasting performance is increasing when multivariate data is used in modeling time series data.
7. Conclusion In this study, GRANN_ARIMA is proposed as a new approach for hybridizing linear and nonlinear model. Unlike conventional hybrid model, the proposed model has few integrated features such as engaged with multivariate time series data, GRA as feature selection to remove irrelevant input data and altering the sequence of hybridization. To verify the effectiveness of proposed hybrid model, several comparisons have been conducted. The outcomes from the experiment revealed that: o
o
o o o o
GRANN can perform better than multiple regression in handling multivariate time series data due to ANN effectiveness in modeling and forecasting nonlinear time series with or without noise [9, 39, 50]. Therefore, ANN is used as multivariate modeler in our proposed model. Forecasting accuracy of proposed hybrid model, GRANN_ARIMA is better compared to the individual model such as GRANN, ARIMA, MR and second order error, LVM. This result supports the outcome from the previous studies because hybridizing two dissimilar models will reduce the forecasting error [53, 54]. Altering the sequence of hybrid model will improve the forecasting accuracy. Hybrid model with changing sequence of hybridization (Hybrid II) is outperformed Hybrid I and conventional hybrid. Forecasting value of GRANN_ARIMA is more accurate compared to hybrid linear MARIMA model since it can handle equally well both linear and nonlinear patterns in time series data. The forecasting error produce by GRANN_ARIMA is the smallest compared to other models that are tested in this study. GRANN_ARIMA also performs well in both small scale data and large scale data.
In conclusion, the proposed approach for hybridizing linear and nonlinear model, GRANN_ARIMA can be used as an alternative tool for forecasting time series data for better forecasting accuracy. Prior studies concealed that ANN learning algorithm was time consuming and tended to trap into local minima solution. Therefore, more studies will be conducted on a new concept of ANN learning algorithm, i.e., a biologically inspired algorithm to speed up the learning time and the accuracy of our proposed hybrid model. In this study, the type of time series data is limited to complex time series; however it can be extended to the simple and seasonal time series data. Meanwhile, compared with individual models, the modeling process of hybrid model is slightly difficult and time consuming. However, due to rapid improvement of computer technologies, this limitation does not seem to be significant.
References [1]. Abraham, A., Nath, B .: A Neourofuzzy Approach For Modeling Electricity Demand In Victoria. Applied Soft Computing Journal, 1, 2001, pp 127-138 [2]. Amstrong,J.S. .: Long Range Forecasting: From Crystal Ball To Computer(2nd Ed.), Wiley,New York, 2001. [3]. Ali, J. And Al-Mahmeed, M .: Neural Networks: Predicting Kuwaiti KD Currency Exchange Rates Versus US Dollar”, Arab Journal Of Administrative Sciences, Vol.6, Pp.17-35: In: C.P.Rao, Jafar Ali, Neural Network Model For Database Marketing In The New Global Economy, Marketing Intelligence & Planning 20/1, 2002, pp 35-43. [4] Bates, J.M., & Granger, C. W. J .: The Combination Of Forecasts. Operational Research Quarterly, 20, 1969, pp 451-468. [5] Bessaler, D.A., Brandt, J.A .: Forecasting Livestocks Prices With Individual And Composite Methods, Applied Economics 13, 1981, pp 513-522. [6] Box,GEP, Jenkins G .: Some Practical Aspects Of Forecasting In Organization, Journal. Forecasting I,(1982), pp 3-21
22
[7] Brace, M.C., Schmidt. J., Hadlin. M .: Comparison Of The Forecasting Accuracy Of Neural Networks With Other Established Techniques. In: Proceedings Of The First Forum On Application Of Neural Network To Power Systems, Seattle, WA., 1991, pp.31-35. [8] Caire, P., Hatabian, G., Muller, C .: Progress In Forecasting By Neural Networks, In: Proceedings Of The International Joint Conference On Neural Networks 2, 1992, pp.540-545. [9] Chi., F-L. .: Forecasting Tourism; A Combined Approach, Tourism Management, Vol.19, No.6, 1998, pp.515-520. [10].Chaivivatrakul.S & Somhom. S .:Vegetable Product Forecasting System By Adaptive Genetic Algorithm, TENCON 2004. 2004 IEEE Region 10 Conference, Volume B, 21-24 Nov. 2004, pp 211 214 Vol. 2. [11] Chatfield,C. .: Time Series Forecasting. Bocaraton,FL:Chapman&Hall/CRC, 2001. [12] Chu, C.W., Zhang, G.P. .: A Comparative Study Of Linear And Nonlinear Models For Aggregates Retail Sales Forecasting. International Journal Of Production Economics 86(3), 2003, pp 217-231 [13]Deng,J.L .: Control Problems Of Grey Systems, Systems And Control Letters, Vol.5, 1982, pp.288-294 [14]Deng, J.L. .: Introduction To Grey System Theory, The Journal Of Grey System, Vol.1. 1989, pp,1-24. [15]Delen..D,.Waller.G,Kadam.A. .: Predicting Breast Cancer Survivability: A Comparison Of Three Data Mining Methods, Artificial Intelligence In Medicine, 2005, 34, pp 113-127. [16]Denton, J.W. .: How Good Are Neural Networks For Causal Forecasting? The Journal Of Business Forecasting 14(2), Summer, 1995, pp 17-20. [17]Dorganis. P, Alexandidi.A., Patrinos.P, Sarinevers.H. .: Time Series Sales Forecasting For Short ShelfLife Food Products Based On Artificial Neural Networks And Evolutionary Computing, Journal Of Food Engineering 75, 2006, pp 196-204. [18]Ganeta,R., Romeo,L.M.,Gill.A. .: Forecasting Of Electricity Prices With Neural Networks. Energy Conversion And Management 47, 2006, pp 1770-1778. [19]Hippert,H.S., Pedreira,C.E.,&Souza,R.C. .: Neural Networks for short-term load forecasting: A review and evaluation. IEEE Transactions on Power Systems,16(1) 2001, pp 44-45. [20].Gorr, W.L., Nagin, D., Szcypula, J. .: Comparative Study Of Artificial Neural Network And Statistical Models For Predicting Student Grade Point Averages, International Journal Of Forecasting 10, 1994, pp 17-34. [21].Granger, C.W.J., (1993). Strategies For Modeling Nonlinear Time Series Relationships. The Economic Record 69(206), 233-238: In G.Zhang et.al Forecasting With Artificial Neural Networks: The State Of Art, International Journal Of Forecasting 14, 1998, pp 35-62. [22].Granger, C.W.J., Terasvirta, T, (1993). Modeling Nonlinear Economic Relationships, Oxford University Press, Oxford: In G.Zhang et.al Forecasting With Artificial Neural Networks: The State Of Art, International Journal Of Forecasting 14, 1998, pp 35-62. [23].Hamid,S.A, And Iqbal Z. .: Using Neural Networks For Forecasting Volatility Of S&P 500 Index Futures Prices, Journal Of Business Research, Volume 57, Issue 10, October 2004, pp 1116-1123 [24].Heravi, S., Osborn, D.R., & Birchenhallc.R. .: Linear Versus Neural Network Forecasting For European Industrial Production Series. International Journal Of Forecasting, 20, 2004, pp 435-446. [25].Hou,Z., Lian,Z., Yao.Y,.Yuan,X., (2006), Cooling-Load Prediction By The Combination Of Rough Set Theory And Artificial Neural Network Based On Data Fusion Technique, Applied Energy 83, 2006, pp. 1033-1046. [26]. Jain.,A, Kumar.,A.M. .: Hybrid Neural Network Models For Hydrologic Time Series Forecasting, Applied Soft Computing, Volume 7, Issue 2, March 2007, pp. 585-592 [27].Kang, S. .: An Investigation Of The Used Of Feedforward Neural Networks For Forecasting. Phd Thesis. Kent State University, 1991. [28].Lu.J-C, Niu. D-X, Jia, Z-L. .: A Study Of Short Term Load Forecasting Based On ARIMA-ANN, Proceedings Of The Third International Conference On Machine Learning And Cybernetics, Shanghai, August, 2004, pp. 26-29. [29].Lachtermacher, G., Fuller, J.D. .: Backpropagation In Time Series Forecasting, Journal Of Forecasting 14, 1995, pp. 381-393. [30].Li.Y, Li.A, Li. R, Wei.L. and.Qin S. .: Study On Characteristics Of Biomass Pyrolysis Gas In View Of Grey Relation Analysis And BP Neural Network, Acta Energies Solaris Sinica, Vol.24, No.6, Dec, 2003, pp. 776-780. [31].Ma, L., And Khorasani, K. .: New Training Strategies For Constructive Neural Networks With Application To Regression Problem, Neural Network, 17, 2004, pp. 589-609.
23
[32].Makridakis,S. And S.C.Wheelwright. .: Forecasting Methods For Management (5th Edition) New York: John Wiley And Sons, 1989. [33].Makridakis.S, Anderson.A, Carbone. R., Fildes.R, Hibdon. M., Lewandowski R., Newton.,J.,. Parzen,E.,Winkler,R. .: The Accuracy Of Extrapolation (Time Series) Methods: Results Of A Forecasting Competition, J.Forecasting 1, 1982, pp. 111-153. [34] Mcleod, A.I., And Li, W.K. .: Diagnostic Checking ARMA Time Series Model Using Squared Residual Autocorrelations Journal Of Time Series Analysis, 4, 269-273: In S.Heravi et al, Linear Versus Neural Network Forecasts For European Industrial Production Series, International Journal Of Forecasting 20, 2004, pp. 435-446. [35].Mentzer, J.T., Bienstock, C.C. .: Sales Forecasting Management. Sage Publications, Thousand Oaks, CA, 1998. [36].Newbold, P., Granger, C.W.J. .: Experience With Forecasting Univariate Time Series And Combination Of Forecast, Journal Of The Royal Statistical Society Series A 137, 1974, pp. 131-149. [37].Pai. P.F, Lim C-S. .: A Hybrid ARIMA And Support Vector Machines Model In Stock Price Forecasting, Omega 33, 2005, pp. 497-505. [38].Parzen E., Winkler R. .: The Accuracy Of Extrapolation (Time Series) Methods: Results Of A Forecasting Competition, J.Forecasting 1, 1982, pp. 111-153 [39].Prerez.S.M, Ortega,M.H, Gonzalez,M.L,.Boger.Z. .: Comparative Study Of Artificial Neural Network And Multivariate Methods To Classify Spanish DO Rose Wines, Talanta 62, 2004, pp. 983-990. [40]. Rao, C.P Ali.,J. .: Neural Network Model For Database Marketing In The New Global Economy, Marketing Intelligence & Planning 20/1,2002, pp. 35-43. [41].R. Ganeta,R., Romeo,L.M.,Gill.A. .: Forecasting Of Electricity Prices With Neural Networks. Energy Conversion And Management 47, 2006, pp.1770-1778. [42]Shamsuddin, M.N. .: A Short Note On Forecasting Natural Rubber Prices Using A MARMA. The Malaysian Journal Of Agricultural Economic, Vol.9, 1992, pp. 59-68. [43]Shamsuddin, M.N., And F.M. Arshad. .: Composite Model For Short Term Forecasting For Natural Rubber Prices. Pertanika, Vol.12, No.2, 1990, pp. 283-288. [44]Shouyang. W, Lean. W. Y., Lai. K. K. .: Crude Oil Price Forecasting With Tei @Imethodology,Journal Of Systems Science And Complexity, Vol. 18, No. 2, April 2005. [45]Srinivasulu. S, Jain. A. .: A Comparative Analysis Of Training Methods For ANN Rainfall-Runoff Models, Applied Soft Computing 6, 2006, pp. 295-306. [46]Taskaya-Termizel,T. Ahmad, K. .: Are ARIMA Neural Network Hybrids Better Than Single Model? Proceeding Of International Joint Conference On NNs (IJCN 2005), July 31-August 4, 2005, Montreal, Canada [47]Taskaya-Termizel,T And Casey, M.C. .: A Comparative Study Of Autoregressive Neural Network Hybrids,Neural Networks, Volume 18, Issues 5-6, July-August 2005, pp. 781-789 [48]Taylor, J.W. .: Short Term Electricity Demand Forecasting Using Double Seasonal Exponential Smoothing. Journal Of The Operational Research Society, 54, 2003, pp. 799-805 [49]Tseng. F-M, Y. H-C. Tzeng., G-H. .: Combining Neural Network Model With Seasonal Time Series ARIMA Model, Technological Forecasting And Social Change, 69, 2002, pp. 71-87 [50]Uysal, M.And Roubi, M. .: Artificial Neural Network Versus Multiple Regression In Tourism Demand Analysis, Journal Of Travel Research, Vol.38, November, 1999, pp111-118. [51] Voort, V.D.,.Dougherty M.,.Watson M. .: Combining Kohonen Maps With ARIMA Time Series Models To Forecast Traffic Flow, Transp. Resc. Circ. (Emerge Techno) 4C(5)(1996) 307-308, Volume 8, 18-21 Aug. 2005 pp. 4764 - 4769. [52]Yang.H.Y, Ye.H, Wang. G, Khan.J.Hu.T. .: Fuzzy Neural Very Short Term Load Forecasting Based On Chaotic Dynamics Reconstruction, Chaos, Solitons And Fractals 29, 2006, pp. 462-469. [53].Zhang.Y &.He.Y. .: Study Of Prediction Model On Grey Relational BP Neural Network Based On Rough Set Proceedings Of The Fourth International Conference On Machine Learning And Cybernetics, Guangzhou, 18-21 August 2005. [54]Zhang G.P. .: Time Series Forecasting Using A Hybrid ARIMA And Neural Network Model, Neurocomputing 50, 2003, pp. 159-175. [55]Zhang.G.P, Patuwo.B.E, Hu..M.Y.. .: A Simulation Study Of Artificial Neural Networks For Nonlinear Time-Series Forecasting, Computers & Operations Research 28 ,2001, pp. 381-396. [56]Zhang. G.P, Patuwo. B.E., Hu.M.Y. .: Forecasting With Artificial Neural Networks:: The State Of The Art, International Journal Of Forecasting, Volume 14, Issue 1, 1 March 1998, pp. 35-62.
24
[57]Zhang. G.P, Neural Networks In Bussiness Forecasting, IRM, Press, 2004. [58]Abraham A. .: Intelligent Systems: Architectures and Perspectives, Recent Advances in Intelligent Paradigms and Applications, Abraham A., Jain L. and Kacprzyk J. (Eds.), Studies in Fuzziness and Soft Computing, Springer Verlag Germany, ISBN 3790815381, Chapter 1, pp. 1-35, 2002. [59]Chebrolu S, Abraham A. and Thomas J. .: Feature Deduction and Ensemble Design of Intrusion Detection Systems, Computers and Security, Elsevier Science, Volume 24/4, 2005, pp. 295-307.. [60] Abraham A, Grosan C. and Martin-Vide C., Evolutionary Design of Intrusion Detection Programs, International Journal of Network Security, Vol.4, No.3, 2007, pp. 328-339. [61] Tosun N. .: Determination of optimum parameters for multi-performance characteristics in drilling by using grey relational analysis, Int. J. Adv. Manuf. Technol ,2005, DOI 10.1007/s00170-004-2386-y
25
26