Hindawi Publishing Corporation Journal of Applied Mathematics Volume 2013, Article ID 625028, 6 pages http://dx.doi.org/10.1155/2013/625028
Research Article Forecasting New Product Diffusion Using Grey Time-Delayed Verhulst Model Yuhong Wang, Shulin Yang, Wuyong Qian, and Xiaozhong Li School of Business, Jiangnan University, Wuxi 214122, China Correspondence should be addressed to Yuhong Wang;
[email protected] Received 25 August 2013; Revised 24 November 2013; Accepted 25 November 2013 Academic Editor: Jong Hae Kim Copyright © 2013 Yuhong Wang et al. This is an open access article distributed under the Creative Commons Attribution License, which permits unrestricted use, distribution, and reproduction in any medium, provided the original work is properly cited. Taking account of the time-delayed phenomenon in diffusion of new products, we propose the time-delayed Verhulst model and then establish a grey time-delayed Verhulst model using the method of grey differential equations. The related parameter packets of this novel model are obtained under the rule of ordinary least squares (OLS). The results show that the traditional grey Verhulst model is a special example of grey time-delayed Verhulst model which can reflect the time-delayed information effectively. A practical example of market diffusion shows that the modeling accuracy is remarkably improved by using the grey time-delayed Verhulst model presented in this paper.
1. Introduction When a new type of products enters the related market, managers want to know the sales and consumer acceptance rate of the new product in the market. And this information is very important for them to make marketing plans, production plans, and even the developing strategies of the company. We first introduce two types of classical models for market diffusion, analyze the pros and cons, and then propose the problem which will be solved in this paper. Assume that 𝑁(𝑡) is the cumulative number using a new product. According to the Malthus theory, we know that the incremental purchase number is proportional to 𝑁(𝑡). Thus, we have the following model: 𝑑𝑁 (𝑡) (1) = 𝑟𝑁 (𝑡) , 𝑑𝑡 where 𝑟 is the growth rate of purchasing. If 𝑟 > 0, 𝑁(𝑡) obeys the law of exponential growth. However, the market demand for new products is limited. The growth rate of purchasing any product will not be an exponential trend when it reaches a certain penetration rate. Considering the restriction of market demand for new products, Malthus model must be improved. Assume that 𝐾 is the total number of potential consumers; the purchase growth rate increases with the decrease
of 𝑁(𝑡). When 𝑁(𝑡) → 𝐾, the purchase growth rate tends to be 0. Thus, we have the following improved model: 𝑁 (𝑡) 𝑑𝑁 (𝑡) ) 𝑁 (𝑡) . = 𝑟 (1 − 𝑑𝑡 𝐾
(2)
Let 𝑎 = −𝑟 and 𝑏 = −𝑟/𝐾, and (2) could be written as 𝑑𝑁 (𝑡) + 𝑎𝑁 (𝑡) = 𝑏(𝑁 (𝑡))2 . 𝑑𝑡
(3)
Equation (3) is the Verhulst model proposed by German mathematician Verhulst in 1937. Raw data are required to be an approximate S-shape for establishing traditional Verhulst model, or ineffective. Professor Deng greyed the traditional Verhulst model based on the concepts and principles of grey differential equation and obtained the following grey Verhulst model [1]: 2
𝑥(0) (𝑘) + 𝑎𝑧(1) (𝑘) = 𝑏(𝑧(1) (𝑘)) .
(4)
The grey Verhulst model, which is a first-order onevariable grey differential equation and also a time series model. The original data vary with time, as do their randomness characteristics. It is one of the basic models of Grey system forecasting and control. Rather than relying on its original data distribution, the grey model is based on
2 the accumulated generating operator (AGO) which describes the data series by grey exponential law. Thus, this model can be solved by constructing a grey differential equation. The simulated values are then derived from the inverse accumulated generating operator (IAGO), as well as forecasted values. This model has the capability of forecasting well without a large number of data samples. Also, this modeling procedure is simple to be used and has the advantage of making short-term forecasting with a small data set. Because grey Verhulst model relies on first-order accumulated generating operator (1-AGO) on the original data, the traditional Verhulst model is extended for forecasting data with an approximate monopeak trend. It can be concluded that the grey Verhulst model excels the traditional Verhulst model in the range of applications. Thus, it has been widely used recently [2–7]. The improvement has been made on grey Verhulst model regarding the selection of initial conditions and parameter estimations [8, 9]. The nonlinear grey Bernoulli model (NGBM(1,1)) is an extended model of grey Verhulst model and the GM(1,1) model, which was successfully used in simulating and forecasting values of annual unemployment rates of 10 selected countries [10] and foreign exchange rates of Taiwan’s major trading partners [11]. The power exponent 𝑛 in this model can effectively reflect the nonlinearity of real systems and flexibly determine the form of the model. Namely, when 𝑛 = 2, NGBM(1,1) devolves to grey Verhulst model. Thus, if the power exponent 𝑛 is confirmed with an appropriate method, the forecast will be more precise than those delivered by grey Verhulst model. This indicates that the NGBM(1,1) model has remarkably improved the simulation and forecasting accuracy of the grey Verhulst model. The NGBM(1,1) model has been widely employed in the simulation and forecasting of data series having nonlinear variations. Zhou et al. [12] selected the proper value of 𝑛 by utilizing a particle swarm optimization (PSO) algorithm and used the model for forecasting the power load of the Hubei electric powers network. A genetic algorithm based NGBM(1,1) is used to forecast the output of Taiwan’s integrated circuit industry [13]. CO2 emissions, energy consumption, and economic growth forecasts by an optimized NGBM(1,1) are demonstrably more precise than those by ARIMA [14]. These improvements have shown better results in both simulation and forecasting. From the above review of the literatures we could find the wide range of fields of grey Verhulst model. In (2) we have the question whether the purchase growth rate 𝑑𝑁(𝑡)/𝑑𝑡 has any relationship with 𝑁(𝑡) at other times besides 𝑡 or not. As we know the following factors may cause delays: on the one hand, information dissemination of new products takes time; on the other hand, the process for consumers decision-making to buy new products after receiving related information takes time, too. Therefore, we need to expand grey Verhulst model to a new model which can reflect time-delayed information.
2. The Grey Time-Delayed Verhulst Model 2.1. Time-Delayed Verhulst Model. First, we make a discussion about improvement of the equation for diffusion of new
Journal of Applied Mathematics products. The equations group below could be presented if we consider impacts on purchasing amount relative to purchasing growth rate about delayed 𝜏0 against time 𝑡: 𝑑𝑁 (𝑡) 𝑁 (𝑡) = 𝑟 (1 − ) 𝑁 (𝑡) , 𝑑𝑡 𝐾 𝑑𝑁 (𝑡) 𝑁 (𝑡) = 𝑟 (1 − ) 𝑁 (𝑡 − 1) , 𝑑𝑡 𝐾
(5)
.. . 𝑑𝑁 (𝑡) 𝑁 (𝑡) = 𝑟 (1 − ) 𝑁 (𝑡 − 𝜏0 ) . 𝑑𝑡 𝐾 The following equation could be obtained if all (𝜏0 + 1) equations are added up in group (5): 𝜏
𝑑𝑁 (𝑡) 𝑁 (𝑡) 0 𝑟 (1 − ) ∑ 𝑁 (𝑡 − 𝜏) , = 𝑑𝑡 1 + 𝜏0 𝐾 𝜏=0
(6)
where, if we let 𝑟 = 𝑟/(1 + 𝜏0 ), the following equation is founded: 𝜏
𝑑𝑁 (𝑡) 𝑁 (𝑡) 0 = 𝑟 (1 − ) ∑ 𝑁 (𝑡 − 𝜏) . 𝑑𝑡 𝐾 𝜏=0
(7)
Then a continuous equation regarding time 𝑡 could be founded which corresponds to the above discrete equation according to the definition of integration in mathematics. Assume that the purchasing growth rate of a new product has a relationship with the cumulative purchasing amount at the time interval [𝑡 − 𝜏0 , 𝑡]. Thus, (7) can be improved below: 𝜏0 𝑑𝑁 (𝑡) 𝑁 (𝑡) ) ∫ 𝑁 (𝑡 − 𝜏) 𝑑𝜏, = 𝑟 (1 − 𝑑𝑡 𝐾 0
(8)
where 𝜏 is the time-delayed variable, 0 ≤ 𝜏 ≤ 𝜏0 . It is difficult for us to solve the above complicated differential equation by classical theory. The method of grey differential equations [15, 16] is a feasible choice to find the approximate solution in this situation. 2.2. Grey Time-Delayed Verhulst Model. According to concepts and principles of grey differential equation [1] and the method of greying differential equations [15], we can establish a grey time-delayed Verhulst model. Let 𝑔𝜔 be a mapping, 𝑆(𝑔𝑖 ), 𝑖 = 1, 2, . . ., a set of grey items in the model, 𝑔𝑖 the grey mapping, 𝑆(𝜔𝑖 ), 𝑖 = 1, 2, . . ., a set of white items in the model, and 𝜔𝑖 the white mapping. We call 𝑔𝜔 the greying mapping of the model, only if (1) 𝑔𝜔 : 𝑆(𝜔𝑖 ) → 𝑆(𝑔𝑖 ); (2) 𝑔1 : 𝑑𝑥/𝑑𝑡 (white derivative) → 𝑥(0) (𝑘) (grey derivative); 𝑔2 : 𝑥 (background value) → 𝑧(1) (𝑘) (grey background set); (3) (𝑔1 , 𝑔2 ) is the basic mapping of the white differential equation.
Journal of Applied Mathematics
3
If we let 𝑁(𝑡) = 𝑥 in (8), time-delayed Verhulst model can be expressed in the following: 𝜏0 𝑑𝑥 𝑥 = 𝑟 (1 − ) ∫ 𝑥 (𝑡 − 𝜏) 𝑑𝜏. 𝑑𝑡 𝐾 0
(9)
𝑥(0) (𝑘 + 1) = 𝑥(1) (𝑘 + 1) − 𝑥(1) (𝑘) > 0.
(10)
So, the system approaches extinction. When resolving practical problems, we often face processes with sigmoid sequences of raw data. In this case, we can take the sequences of the original data as 𝑥(1) and the 1-IAGO sequence as 𝑥(0) to establish a Verhulst model to simulate 𝑥(1) directly.
Greying (9), we have 𝑥(0) (𝑘) = 𝑟 (1 −
𝜏
0 𝑧(1) (𝑘) ) ( ∑ 𝑧(1) (𝑘 − 𝜏)) , 𝐾 𝜏=0
where 𝑘 = 1, 2, . . . , 𝑛. Removing the brackets, we have 𝜏0
(11) Let 𝑎 = −𝑟 and 𝑏 = −𝑟 /𝐾, and (11) can be expressed as follows: 𝑥
𝜏0
(1)
(𝑘) + 𝑎 ∑ 𝑧
𝜏0
(1)
(𝑘 − 𝜏) = 𝑏 ∑ 𝑧
𝜏=0
(1)
(𝑘) 𝑧
(𝑘 − 𝜏) .
(12)
𝜏=0
We call (12) the grey time-delayed Verhulst model. According to the definition of background of grey model, we have 2 ≤ 𝑘 ≤ 𝑛, 2 ≤ 𝑘−𝜏 ≤ 𝑛, and 𝜏 ≥ 0; thus,0 ≤ 𝜏 ≤ 𝑛−2. From the expression of the above model, we can see that the time-delayed items are included in grey time-delayed Verhulst model. When the time-delayed parameter 𝜏0 = 0, (12) degenerates to traditional grey Verhulst model below: 2
𝑥(0) (𝑘) + 𝑎𝑧(1) (𝑘) = 𝑏(𝑧(1) (𝑘)) .
Theorem 1. Let 𝑥(0) (𝑘) be the market diffusion sequence of a new product: 𝑥(1) (𝑘) = 𝐴𝐺𝑂𝑥(0) (𝑘) , 𝑧(1) (𝑘) = 𝑀𝐸𝐴𝑁𝑥(1) (𝑘) = 0.5 (𝑥(1) (𝑘) + 𝑥(1) (𝑘 − 1)) . (18) Grey time-delayed Verhulst model of 𝑥(0) (𝑘) is 𝑥
(0)
𝜏0
(1)
(𝑘) + 𝑎 ∑ 𝑧
(14)
𝜏=0
So the primacy parameter package 𝑃𝐼𝐵 of grey time-delayed Verhulst model is 𝑃𝐼𝐵 = (𝑎, 𝑏) ,
=
𝑎𝑥(1) (0) . 𝑏𝑥(1) (0) + 𝑎 − 𝑏𝑥(1) (0) 𝑒𝑎𝑡
(20)
𝐹𝐻 − 𝐶𝐸 . 𝐹𝐺 − 𝐶2 The secondly parameter package 𝑃𝐼𝐼𝐵 of grey time-delayed Verhulst model is 𝑏=
(15)
𝑛−𝜏0
𝜏0
𝜏0
𝑘=𝜏0 +2
𝜏=0
𝜏=0
𝐶 = ∑ ( ∑ 𝑧(1) (𝑘 − 𝜏)) ( ∑ 𝑧(1) (𝑘) 𝑧(1) (𝑘 − 𝜏)) , 𝑛−𝜏0
𝜏0
𝑘=𝜏0 +2
𝜏=0
𝑛−𝜏0
𝜏0
𝐸 = ∑ ( ∑ 𝑧(1) (𝑘 − 𝜏)) 𝑥(0) (𝑘) ,
(1)
𝑎𝑥 (0) . 𝑏𝑥(1) (0) + (𝑎 − 𝑏𝑥(1) (0)) 𝑒𝑎𝑘
(21)
where
Thus, we have the following time response sequence: 𝑥̂(1) (𝑘 + 1) =
𝐺𝐸 − 𝐶𝐻 , 𝐹𝐺 − 𝐶2
𝑎=
𝑃𝐼𝐼𝐵 = (𝐶, 𝐸, 𝐹, 𝐺, 𝐻) ,
1 𝑒𝑎𝑡 [(1/𝑥(1) (0)) − (𝑏/𝑎) (1 − 𝑒−𝑎𝑡 )]
(19)
𝜏=0
and the solution of (14) is given by 𝑥(1) (𝑡) =
𝜏0
(𝑘 − 𝜏) = 𝑏 ∑ 𝑧(1) (𝑘) 𝑧(1) (𝑘 − 𝜏) .
(13)
The whitenization equation of the grey Verhulst model is 2 𝑑𝑥(1) + 𝑎𝑥(1) (𝑡) = 𝑏(𝑥(1) (𝑡)) , 𝑑𝑡
(17)
2.3. Parameters Identification of Grey Time-Delayed Verhulst Model
𝜏
𝑟 0 𝑥(0) (𝑘) − 𝑟 ∑ 𝑧(1) (𝑘 − 𝜏) = − ∑ 𝑧(1) (𝑘) 𝑧(1) (𝑘 − 𝜏) . 𝐾 𝜏=0 𝜏=0
(0)
then 𝑥(1) (𝑡) → (𝑎/𝑏). That is, when 𝑡 is sufficiently large, for any 𝑘 > 𝑡, 𝑥(1) (𝑘 + 1) and 𝑥(1) (𝑘) will be sufficiently close. At this time,
(16)
The Verhulst model is mainly used to describe and to study processes with saturated states (or say sigmoid processes). For example, this model is often used in the prediction of human populations, biological growth, reproduction, economic life span of consumable products, and so forth. From the solution of the Verhulst equation, it can be seen that when 𝑡 → ∞, if 𝑎 > 0, then 𝑥(1) (𝑡) → ∞; if 𝑎 < 0,
2
𝐹 = ∑ ( ∑ 𝑧(1) (𝑘) 𝑧(1) (𝑘 − 𝜏)) , 𝑘=𝜏0 +2 𝜏=0 𝑛−𝜏0
𝜏0
2
𝐺 = ∑ ( ∑ 𝑧(1) (𝑘 − 𝜏)) , 𝑘=𝜏0 +2 𝜏=0 𝑛−𝜏0
𝜏0
𝑘=𝜏0 +2
𝜏=0
𝐻 = ∑ ( ∑ 𝑧(1) (𝑘) 𝑧(1) (𝑘 − 𝜏)) 𝑥(0) (𝑘) .
(22)
4
Journal of Applied Mathematics 𝜏0
Proof. Let 𝑘 = 2, 3, . . . , 𝑛 in grey time-delayed Verhulst model. For 2 ≤ 𝑘 − 𝜏 ≤ 𝑛, 0 ≤ 𝜏 ≤ 𝜏0 , thus, 𝜏0 + 2 ≤ 𝑘 ≤ 𝑛 − 𝜏0 . We have
𝑥(0) (𝑛 − 𝜏0 ) + 𝑎 ∑ 𝑧(1) (𝑛 − 𝜏0 − 𝜏) 𝜏=0
𝜏0
= 𝑏 ∑ 𝑧(1) (𝑛 − 𝜏0 ) 𝑧(1) (𝑛 − 𝜏0 − 𝜏) . 𝜏=0
𝜏0
(23)
𝑥(0) (𝜏0 + 2) + 𝑎 ∑ 𝑧(1) (𝜏0 − 𝜏 + 2) 𝜏=0
So
𝜏0
𝑦𝑁 = 𝐵𝑃𝐼𝐵 ,
= 𝑏 ∑ 𝑧(1) (𝜏0 + 2) 𝑧(1) (𝜏0 − 𝜏 + 2) , 𝜏=0
(24)
where
𝜏0
𝑥(0) (𝜏0 + 3) + 𝑎 ∑ 𝑧(1) (𝜏0 − 𝜏 + 3)
𝜏0
𝜏0
(1) (1) (1) [− ∑ 𝑧 (𝜏0 − 𝜏 + 2) ∑ 𝑧 (𝜏0 + 2) 𝑧 (𝜏0 − 𝜏 + 2)]
𝜏=0
[ 𝜏=0 ] 𝜏=0 𝜏0 [ 𝜏0 ] [ ] (1) (1) (1) [− ∑ 𝑧 (𝜏0 − 𝜏 + 3) ∑ 𝑧 (𝜏0 + 3) 𝑧 (𝜏0 − 𝜏 + 3)] [ ], 𝐵 = [ 𝜏=0 𝜏=0 ] .. .. [ ] [ ] . . [ 𝜏0 ] 𝜏0 [ ] − ∑ 𝑧(1) (𝑛 − 𝜏0 − 𝜏) ∑ 𝑧(1) (𝑛 − 𝜏0 ) 𝑧(1) (𝑛 − 𝜏0 − 𝜏) [ 𝜏=0 ] 𝜏=0
𝜏0
= 𝑏 ∑ 𝑧(1) (𝜏0 + 3) 𝑧(1) (𝜏0 − 𝜏 + 3) , 𝜏=0
.. . 𝜏0
𝑥(0) (𝜏0 + 2) ] [ (0) [𝑥 (𝜏0 + 3)] ], [ 𝑦𝑁 = [ .. ] ] [ . (0) [𝑥 (𝑛 − 𝜏0 )]
𝑥(0) (𝑘) + 𝑎 ∑ 𝑧(1) (𝑘 − 𝜏) 𝜏=0 𝜏0
= 𝑏 ∑ 𝑧(1) (𝑘) 𝑧(1) (𝑘 − 𝜏) , 𝜏=0
.. .
𝑎 𝑃𝐼𝐵 = [ ] . 𝑏 (25)
Under the rule of OLS, we have
−1
𝑃𝐼𝐵 = (𝐵𝑇 𝐵) 𝐵𝑇 𝑦𝑁 (𝐵𝑇 𝐵) =
−1
1 𝑛−𝜏 ∑𝑘=𝜏0 +2 0
𝜏0 (∑𝜏=0
𝑧(1)
2
(𝑘 − 𝜏)) ⋅ 𝑛−𝜏0
𝜏0
𝑛−𝜏 ∑𝑘=𝜏0 +2 0
𝜏0 (∑𝜏=0
𝑧(1)
(𝑘) 𝑧(1)
2
[ ∑ ( ∑ 𝑧(1) (𝑘 − 𝜏)) [ 𝑘=𝜏0 +2 𝜏=0 [ × [ 𝑛−𝜏 𝜏0 𝜏0 [ 0 [ ∑ ( ∑ 𝑧(1) (𝑘 − 𝜏)) ( ∑ 𝑧(1) (𝑘) 𝑧(1) (𝑘 − 𝜏)) 𝜏=0 [𝑘=𝜏0 +2 𝜏=0 =
2
𝑛−𝜏
𝜏
2
𝜏
0 0 𝑧(1) (𝑘 − 𝜏)) (∑𝜏=0 𝑧(1) (𝑘) 𝑧(1) (𝑘 − 𝜏))) (𝑘 − 𝜏)) − (∑𝑘=𝜏00 +2 (∑𝜏=0
𝑛−𝜏0
𝜏0
𝜏0
∑ ( ∑ 𝑧(1) (𝑘 − 𝜏)) ( ∑ 𝑧(1) (𝑘) 𝑧(1) (𝑘 − 𝜏))] ] 𝜏=0 𝑘=𝜏0 +2 𝜏=0 ] ] 2 𝑛−𝜏0 𝜏0 ] ] ∑ ( ∑ 𝑧(1) (𝑘) 𝑧(1) (𝑘 − 𝜏)) 𝑘=𝜏0 +2 𝜏=0
]
1 𝐺 −𝐶 [ ], 𝐹𝐺 − 𝐶2 −𝐶 𝐹 𝑛−𝜏0
[ [ 𝑇 𝐵 𝑦𝑁 = [ [ [
𝜏0
∑ ( ∑ 𝑧(1) (𝑘 − 𝜏)) 𝑥(0) (𝑘)
𝑘=𝜏0 +2 𝜏=0 𝑛−𝜏0 𝜏0 (1)
∑ (∑𝑧
[𝑘=𝜏0 +2
𝜏=0
] ] ] = [𝐸] . ] 𝐻 ]
(𝑘) 𝑧(1) (𝑘 − 𝜏)) 𝑥(0) (𝑘)
] (26)
Journal of Applied Mathematics
5
Thus,
Table 1: China’s blog scale in the past year (ten thousand persons).
𝐺𝐸 − 𝐶𝐻 [ 𝐹𝐺 − 𝐶2 [ =[ [ 𝐹𝐻 − 𝐶𝐸 [ 𝐹𝐺 − 𝐶2
1 𝐺 −𝐶 𝐸 [ ][ ] 𝐻 𝐹𝐺 − 𝐶2 −𝐶 𝐹
Year Blog scale
(27)
] 𝑎 ] ] = [𝑏] . ] ]
3. An Example of Market Diffusion In August, 2002, the opening of “blog-China” (http://www .blogchina.com/) marks that blog is rising in China. As time goes by, people have more in-depth understanding about blog. More and more people began to use it. Year 2005 is the “the first year of blog popularity”; in this year, the number of blog users reached 900 million. In 2006, the blog is driving on the fast lane and develops steadily; at the end of this year, the number of Chinese blogs (referring to an effective blog space) is more than 20 million. In this section, the advantage of the grey time-delayed Verhulst model over the traditional one is demonstrated by the actual example of China’s blog diffusion in [17]. The total number of China’s valid blog space from 2002 to 2007 is in Table 1. Next we will establish the grey model using the first-order restored sequence in Table 1. From Table 1, we can get the following sequences: 𝑥(0) = (8, 22, 120, 750, 1180, 2120) , 𝑥(1) = (8, 30, 150, 900, 2080, 4200) ,
(28)
where 𝑥(0) is the one order restored sequence from the sequence 𝑥(1) in Table 1. Let 𝜏0 = 1. According to Theorem 1, we have (29)
The grey time-delayed Verhulst model is 𝑥(0) (𝑘) − 0.8342501 (𝑧(1) (𝑘) + 𝑧(1) (𝑘 − 1)) 2
= −0.00012138 ((𝑧(1) (𝑘)) + 𝑧(1) (𝑘) 𝑧(1) (𝑘 − 1)) .
(30)
Let 𝜏0 = 2. According to Theorem 1, we have 𝑃𝐼𝐵 = (𝑎, 𝑏)𝑇 = (−0.8176016, −0.000130634)𝑇 .
(31)
The grey time-delayed Verhulst model is 𝑥(0) (𝑘) − 0.8176016 (𝑧(1) (𝑘) + 𝑧(1) (𝑘 − 1) + 𝑧(1) (𝑘 − 2)) = −0.000130634 (1)
× ((𝑧
2
(1)
(𝑘)) + 𝑧
(1)
(𝑘) 𝑧
2003 30
2004 150
(𝑘 − 1)
+𝑧(1) (𝑘) 𝑧(1) (𝑘 − 2) ) . (32)
2005 900
2006 2080
2007 4200
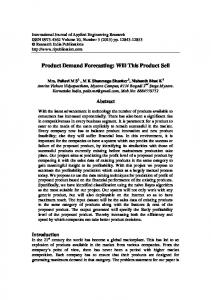
2500 2000 1500 1000 500 0 2003
2004
2005
Actual value Traditional model
2006
2007
Improved model 1 Improved model 2
Figure 1: Curves of actual data, traditional grey Verhulst model, and grey time-delayed models (𝜏0 = 1 and 𝜏0 = 2, resp.).
If we use the traditional grey Verhulst model directly, we could get the estimated parameters and time response function, respectively: 𝑃𝐼𝐵 = (𝑎, 𝑏)𝑇 = (−0.897746, −0.000221)𝑇 , −1
𝑥(1) (𝑘) = [0.000246 + 0.124754𝑒−0.897746(𝑘−1) ] , 𝑥(0) (𝑘) = 𝑥(1) (𝑘) − 𝑥(1) (𝑘 − 1) ,
𝑧(1) = (−, 19, 90, 525, 1490, 3140) ,
𝑃𝐼𝐵 = (𝑎, 𝑏)𝑇 = (−0.8342501, −0.00012138)𝑇 .
2002 8
Data source: iResearch consultation company: “Survey report of China’s blog market”: 2005–2007.
The numbers of blog
−1
𝑃𝐼𝐵 = (𝐵𝑇 𝐵) 𝐵𝑇 𝑦𝑁 =
(33)
𝑘 = 2, 3, . . . , 6.
Take 𝑒(𝑘)% as the relative absolute error, 𝑒avg % as the average relative absolute error, and 𝑝avg % as the average precision. The modeling results of China’s valid blog space and comparing curves are shown in Table 2 and Figure 1, respectively. It can be seen from Table 2 and Figure 1 that if we directly apply traditional grey Verhulst model to forecast the number of Chinese blog, the modeling error is big and the forecasted values are much smaller than the actual values. The main reason for the phenomenon is that the traditional model ignores the time-delayed information in diffusion of new products. Because grey time-delayed Verhulst model takes account of the time-delayed information in modeling, then it could obtain a much higher accuracy. The average relative absolute error is 18.66% and 16.25% and the average precision is 81.34% and 83.75%, respectively. The modeling results are very close when we consider different delayed time 𝜏0 . Thus, the modeling result of grey time-delayed Verhulst model is better than that of the traditional one.
4. Conclusions As the information dissemination of new products and the decision-making process of consumers take necessary time, we should add the time-delayed factors to the grey forecasting model to achieve a satisfactory accuracy. This paper expands the traditional grey Verhulst model to a novel form containing time-delayed information. Comparatively, grey
6
Journal of Applied Mathematics Table 2: Comparison of the modeling results.
Year
2003 2004 2005 2006 2007
Actual values
22 120 750 1180 2120 𝑒avg % 𝑝avg %
Traditional grey Verhulst model 𝑥̂(0) (𝑘) 19.57 47.71 115.12 271.34 607.03 — —
𝑒(𝑘) % −11.02 −60.24 −84.67 −77.01 −71.37 60.82 39.18
time-delayed Verhulst model prevails in the availability of acquiring higher modeling accuracy. However, information of delayed time must reduce the amount of useful data which could be used for estimating parameters in the improved grey time-delayed Verhulst model. At the same time, the amount of data being predicted is also reduced if we take other timedelayed information such as 𝜏0 = 2. We are aware of this phenomenon and will make a deeper research about the improved model in the future work.
Acknowledgments This paper is partially supported by the Humanities and Social Science Foundation of Ministry Of Education of China (12YJCZH207); National Natural Science Foundation of China (71301061); National Project for Education Science Planning (EFA110351); Key Project for Jiangsu Province Social Science Foundation (12DDA011); Social Science Research Project for Universities of Jiangsu Province (2011SJD630009); Humanities and Social Science Young Foundation in Jiangnan University (2010WQN004); the Key Project of National Social Science Foundation (12AZD111); Jiangsu College of Humanities and Social Sciences outside Campus Research Base: Chinese Development of Strategic Research Base for Internet of Things; Project for Innovative Research Base of Jiangsu honest government.
References [1] J. Deng, The Basis of Grey Theory, HUST Press, China, 2002. [2] F.-M. Tseng, H.-C. Yu, and G.-H. Tzeng, “Applied hybrid grey model to forecast seasonal time series,” Technological Forecasting and Social Change, vol. 67, no. 2-3, pp. 291–302, 2001. [3] C. Cao and X. Gu, “The application of grey dynamic Verhulst metabolism model in the prediction of products’ prices and demands,” Information and Control, vol. 34, no. 8, pp. 398–402, 2005. [4] J. H. Wang, “The application of the grey Verhulst model for business valuation,” The Journal of Grey System, vol. 19, no. 2, pp. 159–166, 2007. [5] Y. Song and D. Nie, “Verhulst mode for predicting foundation settlement,” Rock and Soil Mechanics, vol. 24, no. 1, pp. 13–126, 2003.
Grey time-delayed Verhulst model (𝜏0 = 1) (improved model 1) 𝑥̂(0) (𝑘) 𝑒(𝑘) % — — 89.74 −25.21 473.87 −36.82 1316.59 11.58 2097.95 −1.04 — 18.66 — 81.34
grey time-delayed Verhulst model (𝜏0 = 2) (improved model 2) 𝑒(𝑘) % 𝑒(𝑘) % — — — — 474.88 −36.68 1311.33 11.13 2100.21 −0.93 — 16.25 — 83.75
[6] Y. Liu, “An isochronous grey Verhulst GM(1, 1) model for certain high building subsidence course,” The Chinese Journal of Geological Hazard and Control, vol. 17, no. 4, pp. 61–63, 2007. [7] E. Kayacan, B. Ulutas, and O. Kaynak, “Grey system theorybased models in time series prediction,” Expert Systems with Applications, vol. 37, no. 2, pp. 1784–1789, 2010. [8] Y. Dang, S. Liu, and K. Chen, “The GM models that x(n) be taken as initial value,” Kybernetes, vol. 33, no. 2, pp. 247–254, 2004. [9] W.-Z. He and A.-D. Wu, “Estimation of Verhulst model parameter based on linear programming,” System Engineering Theory and Practice, vol. 26, no. 8, pp. 141–144, 2006. [10] C.-I. Chen, “Application of the novel nonlinear grey Bernoulli model for forecasting unemployment rate,” Chaos, Solitons and Fractals, vol. 37, no. 1, pp. 278–287, 2008. [11] C.-I. Chen, H. L. Chen, and S.-P. Chen, “Forecasting of foreign exchange rates of Taiwan’s major trading partners by novel nonlinear Grey Bernoulli model NGBM(1, 1),” Communications in Nonlinear Science and Numerical Simulation, vol. 13, no. 6, pp. 1194–1204, 2008. [12] J. Zhou, R. Fang, Y. Li, Y. Zhang, and B. Peng, “Parameter optimization of nonlinear grey Bernoulli model using particle swarm optimization,” Applied Mathematics and Computation, vol. 207, no. 2, pp. 292–299, 2009. [13] L.-C. Hsu, “A genetic algorithm based nonlinear grey Bernoulli model for output forecasting in integrated circuit industry,” Expert Systems with Applications, vol. 37, no. 6, pp. 4318–4323, 2010. [14] H.-T. Pao, H.-C. Fu, and C.-L. Tseng, “Forecasting of CO2 emissions, energy consumption and economic growth in China using an improved grey model,” Energy, vol. 40, no. 1, pp. 400– 409, 2012. [15] J. Deng, Introduction to Grey Mathematical Resource Science, HUST Press, China, 2007. [16] Y. Wang, J. Tong, and E. A. Pohl, “A grey systems model for estimating component reliability from masked system life data,” The Journal of Grey System, vol. 25, no. 1, pp. 96–109, 2013. [17] Z.-X. Wang, Y.-G. Dang, and L.-L. Pei, “On greying bass model and its application,” The Journal of Grey System, vol. 23, no. 1, pp. 7–14, 2011.
Advances in
Operations Research Hindawi Publishing Corporation http://www.hindawi.com
Volume 2014
Advances in
Decision Sciences Hindawi Publishing Corporation http://www.hindawi.com
Volume 2014
Journal of
Applied Mathematics
Algebra
Hindawi Publishing Corporation http://www.hindawi.com
Hindawi Publishing Corporation http://www.hindawi.com
Volume 2014
Journal of
Probability and Statistics Volume 2014
The Scientific World Journal Hindawi Publishing Corporation http://www.hindawi.com
Hindawi Publishing Corporation http://www.hindawi.com
Volume 2014
International Journal of
Differential Equations Hindawi Publishing Corporation http://www.hindawi.com
Volume 2014
Volume 2014
Submit your manuscripts at http://www.hindawi.com International Journal of
Advances in
Combinatorics Hindawi Publishing Corporation http://www.hindawi.com
Mathematical Physics Hindawi Publishing Corporation http://www.hindawi.com
Volume 2014
Journal of
Complex Analysis Hindawi Publishing Corporation http://www.hindawi.com
Volume 2014
International Journal of Mathematics and Mathematical Sciences
Mathematical Problems in Engineering
Journal of
Mathematics Hindawi Publishing Corporation http://www.hindawi.com
Volume 2014
Hindawi Publishing Corporation http://www.hindawi.com
Volume 2014
Volume 2014
Hindawi Publishing Corporation http://www.hindawi.com
Volume 2014
Discrete Mathematics
Journal of
Volume 2014
Hindawi Publishing Corporation http://www.hindawi.com
Discrete Dynamics in Nature and Society
Journal of
Function Spaces Hindawi Publishing Corporation http://www.hindawi.com
Abstract and Applied Analysis
Volume 2014
Hindawi Publishing Corporation http://www.hindawi.com
Volume 2014
Hindawi Publishing Corporation http://www.hindawi.com
Volume 2014
International Journal of
Journal of
Stochastic Analysis
Optimization
Hindawi Publishing Corporation http://www.hindawi.com
Hindawi Publishing Corporation http://www.hindawi.com
Volume 2014
Volume 2014


![FREE [PDF] New Product Forecasting: An Applied ... - Google Sites](https://m.moam.info/img/260x300/free-pdf-new-product-forecasting-an-applied-google_6477e14c097c474c228c8472.jpg)


