regime as a consequence of the advancing then retreating evolution of the collisional system. ... evolved first as an advancing collisional wedge and then as.
EAGE
Basin Research (2013) 25, 260–284, doi: 10.1111/bre.12002
Foredeep palaeobathymetry and subsidence trends during advancing then retreating subduction: the Northern Apennine case (Oligocene-Miocene, Italy) A. Di Giulio,* N. Mancin,* L. Martelli† and F. Sani‡ *Dipartimento di Scienze della Terra e dell’Ambiente, Universita` di Pavia, Italy †Regione Emilia-Romagna – Servizio Geologico, Sismico e dei Suoli, Bologna, Italy ‡Dipartimento di Scienze della Terra, Universita` di Firenze, Italy
ABSTRACT The Northern Apennines provide an example of long-term deep-water sedimentation in an underfilled pro-foreland basin first linked to an advancing orogenic wedge and then to a retreating subduction zone during slab rollback. New palaeobathymetric and geohistory analyses of turbidite systems that accumulated in the foredeep during the Oligocene-Miocene are used to unravel the basin subsidence history during this geodynamic change, and to investigate how it interplayed with sediment supply and basin tectonics in controlling foredeep filling. The results show an estimated ca. 2 km decrease in palaeowater depth at ca. 17 Ma. Moreover, a change in basin subsidence is documented during Langhian time, with an average decompacted subsidence rate, during individual depocentre life, that increased from 90) in association with deep-sea benthic foraminifera (O. umbonatus, Lenticulina spp., Uvigerina auberiana) indicative of lower
(a)
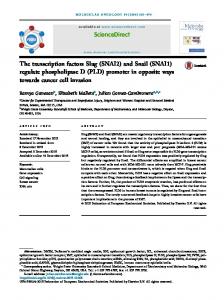
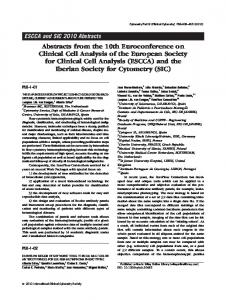
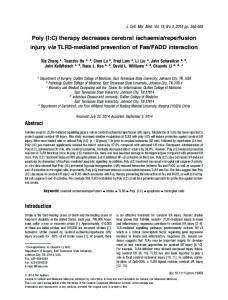
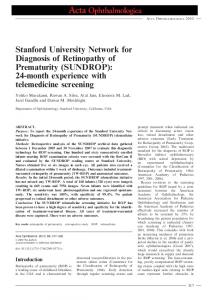
Fig. 9. Geohistory curves calculated for the Macigno-Falterona and Cervarola turbidite complexes (a) and for the Marnoso Arenacea turbidite complex (b). The calculated average subsidence (decompacted and backstripped in dashed and bold line respectively) is reported; the global sea-level curve used as a reference is also shown (uppermost grey line). On the right, the histogram of the average depositional rate of different stages and systems are reported according to decompacted stratigraphic thickness and bio-chronostratigraphic data. Note that the depositional rate of the sandy activation stage of the Falterona system is poorly constrained due to low biochronostratigraphic resolution, caused by poorly preserved micropalaeontological associations (see the text for details).
274
© 2012 The Authors Basin Research © 2012 Blackwell Publishing Ltd, European Association of Geoscientists & Engineers and International Association of Sedimentologists
Foredeep palaeobathymetry and subsidence trends
INTERNAL MARNOSO ARENACEA TURBIDITE COMPLEX
(b)
Depth (m)
Geohistory curve
Depth (m)
Geohistory curve
Ligurides
Ligurides MAIb TS
MAIa TS MAIa TS
SE Mugello Central Romagna Area
NW Mugello W Romagna Area
Age (Ma) Average sedimentation rate
Age (Ma) Depth (m)
Geohistory curve
Ligurides MAIb TS
MAIa TS
Age (Ma)
Eastern Romagna Area Age (Ma)
Age (Ma)
Symbols average bathymetry average decompacted subsidence
EXTERNAL MARNOSO ARENACEA TURBIDITE SYSTEM Depth (m)
Geohistory curve
average backstripped subsidence Abandonment stage Backstepping stage Activation stage Average sedimentation rate
MAE TS
Eastern Romagna Area
Age (Ma)
Age (Ma)
Fig. 9. (Continued). © 2012 The Authors Basin Research © 2012 Blackwell Publishing Ltd, European Association of Geoscientists & Engineers and International Association of Sedimentologists
275
A. Di Giulio et al. –1000
4000
Uplift
2500
FAL TS AQR TS
2000 TCG TS
Subsidence
1500 STA TS
1000
MAIb TS MAE TS
CDP TS
500 MAIa TS
–500 0 500
STA CDP
1500 MAIa
2000 0.3
2500
MAIb
0
2000 3000 Thickness (m)
1
4000
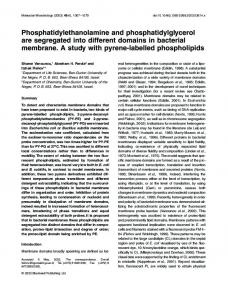
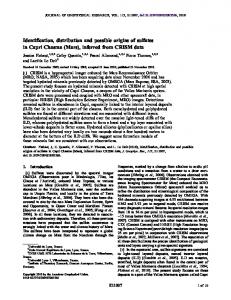
Fig. 10. Plot comparing palaeowater depth decrease registered within each turbidite system between the lower sandy stage and the upper muddy stage vs. the total measured (left) and decompacted (right) sediment thickness; measured and decompacted thicknesses are used as end members for the real value at the moment of system abandonment. Diagonal line corresponds to points where sediment thickness compensates the recorded decrease in palaeowater depth. The Falterona system and all systems of the Cervarola complex are compatible with a depth decrease entirely due to deposition, with the exception of the Torrente Carigiola system, for which a certain amount of syndepositional uplift must be assumed. In contrast, substantial subsidence during deposition must be assumed for the whole Marnoso Arenacea complex (see text for details).
bathyal palaeobathymetry (deeper than 1000 m). Stress and shallow-water displaced species are rare to absent. Towards the top, the upper portion of the Vicchio marl (Rimbocchi-M.te Silvestre and Forteto-Vicchio sections, Fig. 6) contains foraminiferal assemblages mostly characterized by abundant planktonic species (P% from 70 to 95) and upper bathyal benthic indexes (C. pseudoungerianus, G. girardanus, Heterolepa bellincionii, Pullenia bulloides and Siphonina raeticulata). The supposed palaeobathymetry is therefore upper bathyal (200– 600 m). This decrease in palaeodepth within the Vicchio marl was not previously recorded in the literature (Delle Rose et al., 1994); however, the same authors underlined that the sedimentary gap between the Vicchio and Monte Silvestre Formations matched the important sea-level fall of the Burdigalian/Langhian boundary and concluded that eustasy and tectonics probably acted together to produce this erosional unconformity. In the overlying wedge-top Monte Silvestre succession (Rimbocchi-M.te Silvestre sec.; Fig. 6), another important faunal change occurred. Planktonic species increase in abundance (P% > 95) and benthic faraminifera become characterized by lower bathyal indexes (Lenticulina spp., O. umbonatus, Sigmoilopsis spp. and Throchammina spp.) Also in this case, the stress species (Praeglobobulimina, Brizalina, Chilostomella genera) are rare to absent. The proposed palaeobathymetry, from 1000 to 2000 m depth, is consistent with the data reported in Delle Rose et al. (1994) who hypothesized a lower
2
4
3
5
6
7
8
10
9
Time since onset of turbidite deposition (My)
Magnitude of backstripped subsidence (m)
1000
–1500
(b) –1000 –500 TCG
0
CDP
0.05 mm/yr
500
STA
0.1 mm/
MAIa
1000
yr
MAIb
1500 2000 0
1
2
3
4
5
6
7
8
10
9
Time since onset of turbidite deposition (My)
Magnitude of backstripped subsidence (m)
0
mm /yr
3000
0
276
TCG
1000
–1500
(c) –1000 –500 TCG
0
STA
CDP
500 MAIa
1000 MAIb
1500
Messinian salinity crisis
3000
Magnitude of decompacted subsidence (m)
ba
3500 Bathym. AM-ACD (m)
(a)
e
c lan
2000 30
25
20
15
5
10
Begin age of turbidite deposition in each system (My) FALTS
AQRTS
CERVAROLATC
MAITC
MAETS
Fig. 11. Relative subsidence trends of Oligocene-Miocene depocentres of the Northern Apennines. (a) Subsidence curves without correction for sediment loading (decompacted subsidence). (b) Subsidence curves corrected for sediment loading (backstripped subsidence). In both (a) and (b), all curves are aligned to the beginning of turbidite deposition in each depocentre; reference lines representing 0.3 (in a), 0.05 and 0.1 mm y 1 (in b) are reported. (c) Subsidence curves corrected for sediment loading (backstripped subsidence) in their true chronostratigraphic frame. See Table S2 for abbreviations.
bathyal environment, well above the lysocline, for these turbidite sediments. Cervarola turbidite complex Foraminiferal assemblages belonging to the Cervarola complex are less abundant, poorly diversified and discontinuously distributed, with thick portions of succession
© 2012 The Authors Basin Research © 2012 Blackwell Publishing Ltd, European Association of Geoscientists & Engineers and International Association of Sedimentologists
Foredeep palaeobathymetry and subsidence trends In the overlaying Stagno and Castiglione dei Pepoli systems, similar decreasing palaeobathymetric trends are recognized, even if foraminiferal associations result strongly dominated by planktonic species, sometime with percentages >95% preventing a major detail. The lower bathyal depth range (1000–2000 m) proposed for the muddy-sandy stage of the Stagno system is tentatively deduced considering the upper depth limit-distribution of the deeper species Oridorsalis umbonatus, but a shallower bathymetry cannot be totally excluded. Finally, in the upper part of the muddy-sandy stage of the Castiglione dei Pepoli system, benthic foraminifera are characterized by abundant Cibicidoides together with rare Gyroidinoides and O. umbonatus. This association is interpreted as indicative of an upper-middle bathyal water depth. The great abundance of planktonic species in absence of benthic indexes recorded in the activation stage of the Castiglione dei Pepoli system prevents any detailed palaeobathymetric reconstruction. Note, however, that the dominance of calcareous planktonic foraminifera is indicative of a depositional environment well above the CCD, and therefore shallower with respect to the activation stages of the Torrente Carigiola and Stagno systems having a supposed palaeodepositional depth below 2500 m.
barren in the foraminiferal content, such as the sandy stages of both the Torrente Carigiola and Stagno systems (Fig. 6). Moreover, in some stratigraphic intervals (for example the uppermost part of the Torrente Carigiola activation stage) the stress species Praeglobobulimina spp. resulted frequent to common, preventing a precise palaeobathymetric characterization. From the oldest to the youngest system, palaeobathymetric results can be summarized as follows. Samples from the upper muddy stage of the Acquerino system (lower Burdigalian S. Quirico sec.; Fig. 6) contain foraminiferal assemblages characterized by quite abundant planktonic species (P% = 40%) and mostly upper bathyal benthic indexes (common Cibicidoides spp., particularly C. pseudoungerianus, frequent G. girardanus, S. bulloides and Vulvulina spp); rare Oridorsalis umbonatus also occurs. Based on this data, the supposed palaeobathymetry falls in the upper bathyal water-depth range (200–600 m). New palaeobathymetric data were not collected for the underlying Acquerino stages. However, bathymetries below 2500 m and between 1000 and 2000 m, respectively, similar to those reconstructed for the sandy and muddy-sandy stages of the Falterona system, can be reasonably assumed on the basis of facies analysis and stratigraphic position. The lower sandy stage of the Torrente Carigiola system, are barren in foraminifera, probably as a consequence of a depositional surface below the CCD (depth >2500–3000 m). Towards the top, in the upper muddysandy and muddy stages, foraminiferal assembles gradually re-appear probably recording a progressive decrease in the depth range, from an initial lower bathyal bathymetry (1000–2000 m) to an upper-middle bathyal palaeodepth (200–1000 m). Both planktonic and benthic species, in fact, increase in abundance and frequent upper-middle bathyal indexes (mainly Cibicidoides and Gyroidinoides genera) occur.
Marnoso Arenacea turbidite complex The stratigraphic substratum of the internal Marnoso Arenacea complex, provided by the marly facies of the upper Burdigalian Schlier Formation, contains particularly abundant and quite well-diversified foraminiferal assemblages with a high P% (>95%; Rio ValdimonteMonastero di M.te Casale and S.Godenzo sections; Fig. 7). Benthic species are still characterized by deepwater indexes (i.e. Cibicides wuellestorfi, Lenticulina spp., Melonis spp. and O. umbonatus) and subordinately by
Neritic
0 –200
Bathyal
Paleobathymetry (m) –600
s.l 2
1
5
3 2
6 6
5
1
2
3
7
4
3
–2000
Abyssal
8 8
–1000 1
8
7
7
4
–3000
Migrating foredeep system –4000 30
25
Activation stage
20
15
10
Backstepping stage
Age (Ma)
5 Abandonment stage
Depocenter bathymetry 1-FAL TS 5-CDP TS
2-AQR TS 6-MAIa TS
3-TCG TS 7-MAIb TS
4-STA TS 8-MAE TS
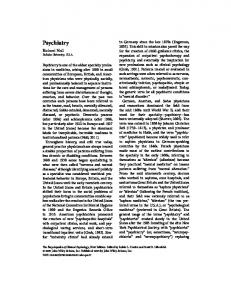
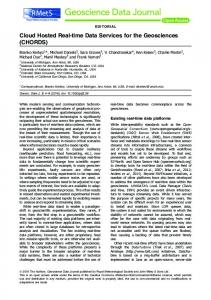
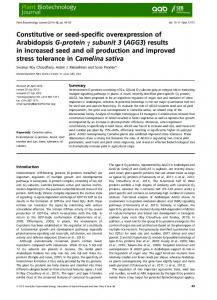
Fig. 12. Plot of palaeowater depth vs. time for Oligocene-Miocene Northern Apennine turbidite systems and stages. A shallowing trend results within individual depocentres and for the lower sandy stages of different depocentres through time, transforming the Northern Apennine foreland basin from a strongly underfilled juvenile state towards a filled state that was not fully reached during the Miocene. © 2012 The Authors Basin Research © 2012 Blackwell Publishing Ltd, European Association of Geoscientists & Engineers and International Association of Sedimentologists
277
A. Di Giulio et al. shallow-water species (Siphonina raeticulata, Sphaeroidina bulloides), probably displaced from shallower depths. The deeper species, in fact, have an upper depth limit-distribution around 1000 m, and therefore the hypothesized palaeowater depth ranges from 1000 to 2000 m. Upwards, in the Langhian sandy stage of the first turbidite system, most of shallower benthic indexes (i.e. S. raeticulata, G. girardanus, C. pseudoungerianus) first occur and/or increase in abundance. At the same time, lower bathyal to abyssal taxa decrease and/or disappear, while planktonic species further increased in abundance (P% = ca. 95%). This is interpreted as a gradual decrease in water depth that probably reached an uppermiddle bathyal palaeobathymetry (from 200 to 1000 m). In the overlying upper Langhian portion of the sandy stage (Scalacci sec., Fig. 7), benthic foraminiferal assemblages are quite diverse, probably in response to deeper water depths (below 1000 m). Fossil associations, in fact, are characterized by lower bathyal indexes (Lenticulina spp., O. umbonatus and Cibicidoides spp.), even if with low abundances, whereas planktonic species strongly dominate the assemblages (P% > 95). Note that in the central Romagna area (Madonna dei Tre Fiumi and Sambuca sections; Fig. 7), foraminiferal assemblages from the same stratigraphic intervals are exclusively composed of planktonics (P% > 98), while benthic taxa are sporadically distributed, generically indicating a deep-sea environment, but preventing any detailed palaeobathymetric reconstruction. The sand-rich stage of the second turbidite system (Madonna dei tre Fiumi and Sambuca sections; Fig. 7) is characterized by foraminiferal assemblages indicative of probably deeper bathymetries; the middle-lower bathyal indexes Lenticulina spp. and C. wuellestorfi first appear, even in low abundance. Shallower indexes, such as C. pseudoungerianus and H. bellincionii also occur, but we interpreted their presence as due to a displacement from more surface environments. Therefore, the proposed bathymetry ranges from 1000 to 2000 m. The overlying muddysandy and muddy stages of the second system (Verghereto and Montecoronaro sections; Fig. 7), contain foraminiferal assemblages with high P% (usually >90%) and benthic species characterized by rare middle-lower bathyal indexes (A. pompilioides, Lenticulina spp. and O. umbonatus). In these turbidite sediments, the occurrence of some displaced shallower species (i.e. C. pseudoungerianus and S. raeticulata) is also recorded. According to the upper depth limit-distribution of the deeper indexes, the proposed palaeobathymetry is below 1000 m (middle-lower bathyal palaeodepths). On the contrary, benthic assemblages from the pelitic facies of the upper muddy stage are quite different: numerous upper bathyal benthic indexes (C. pseudoungerianus, Hyperaminna spp., S. raeticulata) become frequent to common, indicating a probable decreasing depth towards an upper bathyal palaeobathymetry (200– 600 m). The turbiditic sediments belonging to the lower sandy stage of the external Marnoso Arenacea system (Santerno
278
sec.; Fig. 8) contain foraminiferal associations characterized by abundant, diversified, and quite well-preserved species, with a high P% (ca. 70–80%). As benthic taxa are mostly composed of upper-middle bathyal indexes (i.e. Cibicides pseudoungerianus, Gyroidinoides neosoldanii, Lenticulina spp., Heterolepa floridana) and subordinately by rare deeper species such as O. umbonatus, the palaeowater depth probably varied from 600 to 1000 m. Upwards, in the Tortonian part of the activation stage, most of the shallower benthic indexes (i.e. H. floridana, C. pseudoungerianus) strongly increase in abundance, whereas lower bathyal species (O. umbonatus) disappear. This is interpreted as the result of the gradual decrease in water depth that probably reached an upper bathyal palaeobathymetry (200–600 m). This shallowing trend continues upsection, in the muddy-sandy stage, as testified by the first occurrence of lower neritic-upper bathyal indexes (from 100 to 600 m), such as Planulina ariminensis and abundant to common H. floridana and C. pseudoungerianus.
Geohistory The obtained geohistory curves allowed us to define the decompacted depositional rate of each turbidite system and, within it, of each stage. As a general rule, the decompacted depositional rate considerably decreases (by a factor around 3 as an average) going from the lower sandy stage to the mud-rich overlaying stages within each system, even if, case by case, the depositional rates of sandy stages and mud-rich stages vary considerably (Fig 9a, b). Only the Falterona system apparently contradicts this rule (Fig. 9a), but this is probably due to the poor biostratigraphic constraints for the lowermost sandy turbidite stage. The present and decompacted thicknesses of each turbidite system provide the end members necessary to evaluate if the turbidite deposition alone can explain the decreasing water depth recorded by fossil foraminiferal associations in all studied turbidite systems (Fig. 10). In this respect, turbidite thickness is sufficient to justify water depth decreases in both the Falterona and Cervarola complexes, with the exception of the Torrente Carigiola system where some syndepositional uplift seems necessary to account for the observed decrease in bathymetry. On the contrary, turbidite thickness greatly exceeds the shallowing recorded in the turbidite systems forming the internal and external Marnoso Arenacea complex, thus suggesting some syndepositional subsidence in the migrating depocentre since Langhian time. The result is better constrained by the decompacted and backstripped subsidence trends provided by the geohistory curves (Fig. 11). Although they show quite complex subsidence trends, some common features can be identified among all studied depocentres. Since late Oligocene to Burdigalian (i.e. in the Falterona, Acquerino and T. Carigiola-Stagno-Castiglione dei Pepoli depocentres), the Northern Apennine foredeep depocentres experienced low, average decompacted subsidence