A software ecosystem (SECO) is defined as a set of actors functioning ... among them [10]. Software ... their book [12] about the practices of software companies.
Formalizing Software Ecosystem Modeling Vasilis Boucharas, Slinger Jansen, Sjaak Brinkkemper Utrecht University Department of Information & Computing Sciences Padualaan 14 3584CH Utrecht, The Netherlands
{v.boucharas, s.jansen, s.brinkkemper}@cs.uu.nl ABSTRACT
are relevant to software engineering and economics of software ecosystems as well, and only recently have some of these questions been answered [9, 14, 2, 13, 16, 5, 11]. Researchers are currently developing modeling and strategic planning methods for boardroom discussions regarding software products, services, and their frequently overlapping surrounding software ecosystems. Some of these methods have been validated in practice by studying their usefulness and adaption by both professionals and students [4]. Concurrently, similar methods have been developed to model software ecosystems where, for instance, specific cases of service suppliers to software vendors are modeled [2]. These [2, 4] modeling methods are generally informal due to their versatile nature. However, adequate stakeholders communication requires one formal standard for software ecosystems that models both the ecosystem and the environment in which software products and services operate. Other industries have already developed modeling methods for specific cases within specific ecosystems, generally focused on distributed stock and production management. One example of such a modeling method is value stream management, a method that enables production companies to become lean manufacturers with low overhead costs by improving logistics. Such models, however, do not suffice for software due to its specific nature. Software has nextto-nothing reproduction costs, which implies that the actual logistics of reproducing and moving software are negligible. Nonetheless, there exists a need for modeling software ecosystems because (1) software vendors have trouble distinguishing the specific software ecosystems in which they are active and (2) they have trouble using these ecosystems to their own strategic advantage. Software ecosystem models can have three scope levels of which examples can be found in Figure 1. At each of these scope levels different entities are considered. At the software supply network scope level (a), the objects of study are the actors and their relationships. At the SECO scope level (b) the objects of study are the Software Supply Networks (SSNs) and their different relationships. at the SECOs scope level (c) the objects of study are the SECOs themselves, and the relationships among them. At each level different research challenges exist, ranging from the effect of architectural changes on the SECO to the development of overall health metrics for any SECO. These challenges can be further articulated by defining generic properties on the objects of study, which remain similar as we raise the scope levels. A non-exhaustive list of these generic properties contains such properties as (SSN, SECO, or SECOs) health, interac-
Currently there is no formal modeling standard for software ecosystems that models both the ecosystem and the environment in which software products and services operate. Major implications are (1) software vendors have trouble distinguishing the specific software ecosystems in which they are active and (2) they have trouble using these ecosystems to their strategic advantage. In this paper we present and formalize a standards-setting approach to software product and software supply network modeling. Applying this approach enables software vendors to communicate about relationships in the software supply network, theorize about weak spots/links in their business model and anticipate upcoming changes in the software ecosystem.
Categories and Subject Descriptors K.6.3 [Management of Computing and Information Systems]: Software Management—software development; I.6.5 [Simulation and Modeling]: Model Development
General Terms Design, Standardization, Management
Keywords Software ecosystem modeling, software supply network, product deployment context
1.
INTRODUCTION
A software ecosystem (SECO) is defined as a set of actors functioning as a unit and interacting with a shared market for software and services, together with the relationships among them [10]. Software ecosystems are a topic of debate for software vendors presently, with many relevant questions asked by Messerschmitt and Szyperski in each chapter of their book [12] about the practices of software companies that aim to thrive in software ecosystems. These questions
Permission to make digital or hard copies of all or part of this work for personal or classroom use is granted without fee provided that copies are not made or distributed for profit or commercial advantage and that copies bear this notice and the full citation on the first page. To copy otherwise, to republish, to post on servers or to redistribute to lists, requires prior specific permission and/or a fee. IWOCE’09, August 24, 2009, Amsterdam, The Netherlands. Copyright 2009 ACM 978-1-60558-677-9/09/08 ...$10.00.
41
Sup1 Cust1 Sup2
ISV ISV
Cust1
Sup3
ISV
(a)
(b)
(c)
Figure 1: Software Ecosystem Scope Levels
models provide interesting insights into software ecosystems on a high level, especially when viewed over time. It is not possible, however, to create insight into the reasons why software ecosystems develop through time as they do. A further enrichment and formalization of the modeling technique provides insight into effects of architectural and business changes. Section 2 continues with a description of the research approach. Section 3 presents the Software Ecosystem Modeling (SEM) technique, which includes the Product Deployment Context (PDC) and SSN diagrams. Furthermore, the SEM meta-model that describes the relationships between the diagrams is presented in Section 3.1, the formalization of the SSN and PDC diagrams in Section 3.2 and a case-study of SEM in Section 4. Finally, in Section 5 we evaluate the research undertaken by pinpointing issues that arose in the process.
tion, performance, inputs, outputs, competition, value sharing and coordination methods. Relatively little literature has treated each of the three different levels. The SSN scope level has received some attention in our earlier work [8, 4] and presently a lot of discourse is taking place in the industrial arena, as organizations realize they no longer function as independent units. The SECO scope has received more attention from authors such as Iyer [1] and Iansiti and Levien [7]. Iansiti and Levien provide comprehensive overviews of the different roles actors can play within a SECO and also describe several effects of strategic choices on the overall health of a SECO. Iyer on the other hand created many different software ecosystem models1 that display the development of these models over time. These models provide interesting insights into the life and death of certain technologies and platforms and their accompanying SECOs. On the scope level of SECOs, which views SECOs as interacting units, Iyer and Ianisiti and Levien have taken several first steps. Iyer for instance has developed models in which actors are grouped in with SECOs. Furthermore, Iansiti and Levien have defined “bridging” actors, who are active in two different SECOs en thereby provide a bridge between them. When looking at the properties mentioned above, however, a sea of different research challenges still exist. This paper focuses on the SSN scope level and on the actors that have a direct relationship with the product of interest and develops a formalization for SSN modeling by merging two earlier techniques. By merging the best aspects of the existing modeling methods and development of new insights, with this research we establish and formalize an approach for modeling software ecosystems that enables describing schematically both the context of a software product, which is considered a deciding component of SSNs, and the software product’s relevant positioning in its SSN. Making use of the approach enables software vendors to adequately describe and formally communicate aspects of the SSN in which they are operating to various (primarily non-technical) stakeholders. Iyer’s [1] modeling techniques are used to map connections between organizations. These
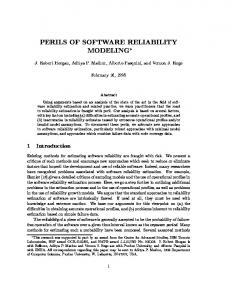
Example To illustrate the problems experienced we take the example of a Dutch software vendor (DutchSV) that builds and sells a large product platform. Recently, the vendor has chosen to work solely through partners. Furthermore, the vendor has opened up their Application Programming Interface (API) to enable third parties to build extensions to their software. Also, their product platform contains two large open source components (from open source providers, OSp1 , OSp2 ) with commercially re-use friendly licenses and one commercial component from commercial software vendor (CSV). The vendor’s SSN has been modeled in Fig. 2. Fig. 2. is a simplified version of the SSN for DutchSV. The SSN model shows that Partner X is capable of creating its own component (P.5) that is resold to customers. Some interesting weaknesses can be spotted in the SSN. For instance, what if OSp1 decides to change their licenses to an infectious open source license for new versions of the component, forcing DutchSV to redevelop the component. Also, what if the prices of CSV are raised (e.4) such that DutchSV can no longer afford to include that component? Since these are generally long-lasting dependencies with high costs, these are typical examples of the problems software vendors face in software ecosystems.
1 Of which many different visualizations can be found at http://softwareecosystems.com
42
OSp 1 OSp 2
P.2 P.1
P.3
DutchSV
P.4
CSV
P.1
P.5
Partner X €.1
Customer €.2
€.4
Figure 2: SSN Example
2.
RESEARCH APPROACH
3. SOFTWARE ECOSYSTEM MODELING
The research follows the seven guidelines of design science, as proposed by Hevner [6]. Below follows an elaboration on those guidelines that have been deemed relevant to this research. In essence, this research builds upon already existing insights by devising and formalizing an approach for modeling a software ecosystem, which consists of two different previously developed diagram techniques. The underlying business need that calls for this research stems from the emergence of relevant but differing modeling techniques for describing software products [4] and their business models and software supply networks [8] (Problem Relevance). This design research bridges the gap between different solutions by merging the best of all worlds and attempts to set the standard with the presented modeling technique. Design Evaluation will be performed by making use of several criteria, against which the success of the modeling technique will be measured in a twofold evaluation. On one side the overall usage aspects as experienced by the user have to be evaluated: simplicity, understandability, learning curve and readability. On the other, we want to evaluate the extent to which the modeling method will be robust under extreme usage scenarios as well as future-proof (amendable), which is achieved by scalability and extensibility. Although the utility of the proposed technique has not been extensively evaluated, the techniques on which this technique builds upon have been used in generating numerous case studies in [4] and [8] and have been generally found to reflect the actual situation of a company [4]. The evaluation of the research is revisited in Section 5. The Research Contributions include an improved approach to software product and software supply network modeling and a novel formalization of the software ecosystem modeling. The formalization is intended to be used in future research with the goal of deriving new theorems by modeling existing SSNs and observing their properties. The research undertaken was carried out in a highly iterative process. At the end of each iteration the set of external laws and design evaluation criteria were reassessed and means were reshaped accordingly until the end-result was reached (Design as a Search Process). Sufficient detail to enable researchers and practitioners to construct and use the model is provided in the meta-model and formalization sections of this paper (Research Communication). The modeling techniques proposed in this paper are being used for a number of business modeling courses at Utrecht University. Furthermore, the techniques of Brinkkemper et al. [4] were applied to over fifty Dutch start-up businesses.
The Product Deployment Context (PDC) was created to provide a quick overview of the architecture and dependencies of a software product in its running environment. The details provided by the PDC show the hierarchy between different products and components and provide a stack view of these on different locations of a network. The PDC was deliberately kept simple so as to accommodate both nontechnical readers and software developers. A Software Supply Network (SSN) is a series of linked software, hardware, and service organizations cooperating to satisfy market demands [8]. At the software supply network level software vendors must consider how to deal with first-tier buyers and suppliers. The SSN model is inspired by Weill and Vitale’s supply networks [16]. These networks show value, knowledge, and software flows between the different actors in a software supply network. The SSN model enables reasoning about the business model of a software firm, since it shows the inter-firm dependencies and flows. Below we define the individual SEM concepts for both PDC and SSN diagrams and their visual notation (diagram components). In Figures 3 and 4 we introduce the components with their respective visual notation and provide a high-level description for each, as well as examples to aid the reader. Since the entire set of rules and relationships between the components as well as the diagrams themselves are encoded in the SEM Meta-model (Figure 5) presented in Section 3.1, below some details are discussed that remain implicit in the model.
PDC Components. The SEM Meta-model in (Figure 5) shows that a Product and all its specializations carry the property Optional except fo the Product of Interest (PoI). An optional component is drawn with a dashed border instead of a solid one. The implication on the semantics of the components is that an optional product is not required for the PoI’s standard functionality. Examples are plugins or components that can be used interchangeably with other products. In case a Platform Product includes other products which are irrelevant, the Platform Product can be alternatively modeled as being “closed”: the box attached to the bottom part that is used for the placement of other products becomes then gray and no included products are then modeled. All components are distinguished with a unique identification number (ID) in the top left corner which is a combination of a character that signifies the nature of the component (i.e. P for Products, H for Media) followed by a dotseparator and a unique number for each character. In case of a ubiquitous component (i.e. the Internet as a Medium) the ID can be optionally left blank, thus unidentified.
43
P.1 Product of Interest
P.7 Product
P.5 Platform Product P.7
Product
P.5
Side B
Sidea A
Medium
P.2 Hardware Product
SSN Components. The SEM Meta-model (Figure 5) shows
Product of Interest (PoI): The main software PoI in the business model. The color of the PoI is blue and its border line is solid. Product: A required software product for the PoI delivery to the customer. Its color is orange and its border line is solid. Examples: Web server, Database, Operating System. Platform Product (Open): A platform software product that includes other products of immediate interest. Its color is orange and its border line is solid. A white box attached to the bottom part is used for the placement of included products. Medium: The communication medium between two or more products. Its color is white and its border line is solid. Below and attached, a dashed line separates the two sides (stacks) that the medium connects with a description (stack title) for each. Hardware Product: A hardware product that is required for the PoI to function. Its color is white and its border line is solid.
that Actors, Trade Relationships and Flows have the Optional property. An optional component is drawn with a dashed border in case of Actors and Flows and as a dashed line in case of Trade Relationships. The implication on the semantics of the aforementioned components is that they are not required for the CoI’s delivery to the Customer. Gateways can be visualized as a hub, connecting two or more incoming Trade Relationships (input) to one outgoing Trade Relationship (output). They enable the conditional Trade Relationship choice between the Input Trade Relationships (and their Flows) and the Output Trade Relationship.
3.1 SEM Meta-model Van de Weerd et al. [15] propose a meta-modeling technique comprised of the Meta-process and Meta-deliverable diagrams that extend and adjust standard UML activity and class diagrams respectively. We make use of the Metadeliverable diagram notation in order to created a concept diagram (Fig. 5) of the SEM notation that depicts the individual components (presented in Section 3) as concepts out of which the PDC and the SSN are comprised, as well as their cardinalities, properties and associations. The main justification for using the Meta-modeling technique of van de Weerd et al. instead of standard UML class diagrams comes with the extended descriptive capabilities of the proposed notation for class generalizations. As displayed in Fig. 5, in one case using a “d” in a circle overlapping two or more inheritance links signifies the disjointness of the linked sub-concepts (sub-classes): Hardware Products and Platform Products are mutually disjoint but an instance might exist where one of them is also a PoI. A line divides the SEM meta-model, showing the conceptual separation between SSN and PDC models. The main relationship between the two models is established on the concept of Product and the main rule is that all Products carried by a Flow in the SSN have to appear in the PDC, using the same reference ID. This inhibits modeling unnecessary Products, irrelevant to the delivery of the PoI to the customer. Furthermore, Products are traded by Actors that participate in at least one Trade Relationship in the SSN. The Trade Relationships in turn, consist of at least one Flow that can carry a Product, a service, a certain monetary value, etc. Flows are intentionally left “open” allowing the user to specify different artifacts to be carried by a flow, as the situation dictates. There are several implications in regards to the Product specialization scheme. Platform Products and Hardware Products are mutually disjoint because of the design decision to restrict the modeling capabilities of the proposed method to software products and eliminating the possibility of modeling complex hardware structures since that would shift the focus of the modeling method and also introduce unnecessary, for the current scope, hardware-related modeling intricacies in the problem domain. Stacks are the column equivalent of a table, where Products and Media are stacked on top of each other. Stacks are also conceptually divided further in Levels (or the row equivalent of a table), a concept which we refrain from presenting but is still discussed in the formalization. The diagram user will not explicitly draw the Stacks (not encouraged) but rather use them as conceptual placeholders. Each Stack can be either a Product or a Medium Stack, according to the
Figure 3: PDC Components
Company of Interest
Supplier
Customer
Intermediary
Customer’s Customer
X.Y
OR
Company of Interest (CoI): The CoI delivers the PoI in the business model under investigation. Its color is blue and its border line solid. Supplier: An actor that supplies one or more required products or services is a Supplier. Its color is orange and its border line solid. Customer: An actor that directly or indirectly acquires or makes use of the PoI. Its color is yellow and its border line solid. Intermediary: Actors like Distributors, Resellers, etc, act as intermediaries between two parties. Their color is green and its border line is solid. Customer’s Customer: A Customer might have his own customers being provided with a product or service directly or indirectly from the CoI. Examples: Product Support, Updates, etc. Its color is gray and its border line is solid. Trade Relationship: Connects two actors. A relationship might be complex, constituting of many Flows of arbitrary directions. Drawn as a black solid line. Flow: Represents an artifact or service flow from one actor to another. One or more characters substitute X, denoting the nature of the transferred artifact (Flow Type). Y is substituted by a number, denoting different artifacts of the same nature. Its color is white and its border line is solid. OR Gateway: Enables one or more or all Trade Relationships and their Flows between the input Trade Relationships and the output Trade Relationship. Its is black; the color of the text is white. XOR Gateway: Enables only one Trade Relationship and its Flows between the Input Trade Relationships and the Output Trade Relationship. Its color is black; the color of the text is white.
Figure 4: SSN Components
44
controls 0..*
0..* 0..*
2
d
MEDIUM STACK PLATFORM PRODUCT
1
connects
d
trades
PRODUCT STACK
POI
HARDWARE PRODUCT
1..* 0..*
PDC participates in
SSN
1..*
TRADE RELATIONSHIP
MEDIUM
carries
0..1
Stack Name
1..*
1
includes
0..*
ProductID Product Name Optional
STACK
contains
0..*
contains
1..*
PRODUCT
1..*
Optional
restricts 1..*
2..*
1..* ACTOR Actor Name Optional
1..* 0..1 0..1
OR GATEWAY
XOR GATEWAY
FLOW FlowID Optional
Figure 5: SEM meta-model (concept diagram).
45
1..*
PP : the set of platform products, SP : the set of product stacks, PI : the set of products of interest, SM : the set of media stacks, PH : the set of hardware products, E: the set of extended components, F : the set of control/information flows, L: the set of levels, M : the set of media.
type of the contained items. Mixing Products and Media in the same stack is forbidden. Stacks of a certain type can only be adjacent to Stacks of a different Stack type on either side or to no Stack at all. The implication of this is that a Product Stack cannot have another Product Stack adjunct to it but possibly one or at most two Media Stacks (one at either side). Each Product Stack signifies the necessary physical hardware and software configuration for the delivery of the software product to the customer and can contain at least one to any number of Products on each and every Level. When multiple Products are placed in the same Stack’s Level, they have to be horizontally aligned and no wrapping is allowed. The placement of Products in Levels dictates the control and/or information passing scheme which always flows from top to bottom and never the other way around or horizontally among Products in the same Level. The control/information flow affects only Products in the same Stack. Therefore we say that a Product X controls or passes information to another Product Y if and only if X is contained in Level a and Y is contained in the adjunct Level a + 1 below and they are vertically aligned. In other words, when the vertically expanded horizontal sides of the two Product rectangles overlap. This also enables us to draw cases where two or more Products control or pass information to another Product below. In case a “blank” Level exists between two such vertically aligned Products there is no control/information flow occurring. Another case where no control/information flow occurs although vertical alignment and even Level adjacency are fulfilled is that of Products contained in a Platform Product. Modifying the previous example, if X is a Platform Product and contains Products Ψ and Ω, then none of Ψ and Ω control or pass on information to Y . In such a case holds that X is the Product that controls Y . Each Medium Stack has to contain one or more Media but at most one per Level. The positioning of a Medium can only occur on a Level where two adjunct Product Stacks (one on each side of the Medium) also have Products, thus signifying the interconnection of the two using the specific Medium. In several cases the user will need to draw more advanced configurations that involve for example client-server schemes, in which case the user has to draw three Stacks: one Product Stack for the server configuration, another Product Stack for the client configuration and a Medium Stack that will describe how server and client are interconnected.
Extended Components. The set of extended components is introduced as an auxiliary set, defined as the union of products and media. The two subsets are mutually disjoint which implies that an extended component is either a product or a medium: E = P ∪ M . In order to distinguish between the two mutually disjoint kinds of extended components, it is assumed that two predicates are defined: predicate product over E predicate medium over E Extended components are contained in stacks at specific levels. To formalize the concept we define the basic predicate cntdIn. Then cntdIn(e, s, l) has to be read as: extended component e is contained in stack s, at level l. predicate cntdIn over E × S × L
Products. In order to distinguish the three kinds of products it is assumed that three predicates are defined accordingly: predicate poi over P predicate platf orm over P predicate hw over P A platform product cannot be a hardware product and vice versa. ∀p ∈ P ¬[platf orm(p) ∧ hw(p)]
(1)
A product of interest might also be a platform product or a hardware product. In addition, there can only be one product of interest. � � ∃p ∈ P poi(p) ∧ [platf orm(p) ∨ hw(p)] (2) ∃!p ∈ P [poi(p)]
(3)
Stacks. In order to distinguish between the two mutually disjoint kinds of stacks, product stacks and medium stacks, it is assumed that two predicates are defined: predicate prdStack over S predicate medStack over S Products are contained only in product stacks and media are contained only in medium stacks.
3.2 SEM Formalization For reasons of brevity in this subsection we present a summary of the SEM formalization; the entire formalization is available upon request from the authors. The formalization of SEM is split up according to the two diagram techniques, the PDC and SSN. The associations between the different concepts of the SEM method are established in terms of predicates and their corresponding axioms, as proposed by Brinkkemper in [3].
∀e ∈ E∃s ∈ S∃l ∈ L [cntdIn(e, s, l) ⇔ product(e) ∧ prdStack(s)]
(4)
∀e ∈ E∃s ∈ S∃l ∈ L [cntdIn(e, s, l) ⇔ medium(e) ∧ medStack(s)]
PDC Rules
(5)
We assume that the auxiliary predicate cntdInN xtStck is defined. For example cntdInN xtStck(e1 , e2 ) is read as an extended component e1 contained in a specific stack has another extended component e2 contained in its immediate next stack and on the same level.
The sets listed below include auxiliary concepts, necessary for the formalization. All these sets are mutually disjoint unless otherwise stated: P : the set of products, S: the set of stacks,
46
predicate cntdInN xtStck over E × E as
one specific actor type. In addition, there can only be one actor of the type company of interest.
cntdInN xtStck(e1 , e2 ) ≡ ∃s1 , s2 ∈ S∃l1 , l2 ∈ L [cntdIn(e1 , s1 , l1 ) ∧ cntdIn(e2 , s2 , l2 ) ∧ nextstack(s1 , s2 ) ∧ l1 = l2 ]
∃!a ∈ A[coi(a)] (6)
Trade Relationships. Trade relationships relate two different actors. We distinguish between the starting-point actor of a trade relationship using the predicate source and the destination actor using the predicate destination. predicate source over T × A predicate destination over T × A No trade relationship may be unconnected, so each one must have a source and a destination. Additionally, no actor may appear in the SSN diagram without being connected to a trade relationship.
Levels. We assume the auxiliary predicate cntdInN xtLvl is defined. For example cntdInN xtLvl(e1 , e2 ) is read as an extended component e1 contained in a specific level has another extended component e2 contained in the immediate level below. predicate cntdInN xtLvl over E × E as cntdInN xtLvl(e1 , e2 ) ≡ ∃s1 , s2 ∈ S∃l1 , l2 ∈ L [cntdIn(e1 , s1 , l1 ) ∧ cntdIn(e2 , s2 , l2 ) ∧ nextlevel(l1 , l2 ) ∧ s1 = s2 ]
(7)
We also assume the predicate aligned is defined in order to describe the situation where two extended components on two different levels are vertically aligned; in other words when the vertically expanded horizontal sides of two extended components rectangles overlap. predicate aligned over E × E Using the previously defined predicates we now define the basic predicate controls, which describes when a product controls or passes information to another product. predicate controls over P × P
∀t ∈ T ∃a ∈ A[source(t, a)]
(10)
∀t ∈ T ∃a ∈ A[destination(t, a)]
(11)
∀a ∈ A∃t ∈ T [source(t, a) ∨ destination(t, a)]
(12)
Flows. The set of flows is the union of the sets of financial, product, service, content and custom flows. The set of custom flows can be used in order to extend the already established subsets of flows: F = {FF , FP , FS , FC } ∪ FA , where FA = {custom f low extensions}. A trade relationship carries at least one flow. To formalize this we define the basic predicate carries. Then carries(t, f ) has to be read as: trade relationship t carries flow f . predicate carries over T × F
controls(p1 , p2 ) ≡ cntdInN xtLvl(p1 , p2 ) ∧ aligned(p1 , p2 )
(9)
(8)
Then controls(p1 , p2 ) has to be read as the productp1 controls or passes on information to product p2 because p2 is contained in the same stack as p1 in the exact level below and additionally, they are aligned.
∀t ∈ T ∃f ∈ F [carries(t, f )]
(13)
4. CUBICEYES CASE STUDY CubicEyes is a privately held Netherlands based company - a vendor/developer application service provider of database-driven Internet solutions and other web applications built for various purposes (e.g. E-Commerce). Specializing and engaged almost exclusively in the Real Estate, Travel and Multi-Channel Publishing markets, its customers range from individuals and small to large companies. In this case study we will focus on the EYE-move software product that is targeted at Real Estate market and the most popular product of the company. The case study was conducted by studying the software, studying third parties in the SSN, and by conducting several interviews, all using Yin’s case study method [17]. The aim of the case study was in part to see whether the SSN and PDC would be appreciated and reused in the software documentation. The case study was preceded by a formal agreement on a case study protocol. The case study report was reviewed by employees of CubicEyes and by research colleagues. Product selection was based on the fact that the product is responsible for upward of 60 percent of the total revenue of the company. In part the case study can be considered action research due to the fact that the researcher works for CubicEyes in a part-time position. To remain objective this researcher was not included in the evaluation of the usability and effectiveness of the PDC and SSN.
SSN Rules In addition to the SSN concepts, the sets listed below include auxiliary sets. All sets are mutually disjoint unless otherwise stated: A: the set of actors, AS : the set of suppliers, ACoI : the set of companies of interest, AC : the set of customers, AI : the set of intermediaries, ACC : the set of customer’s customers, F : the set flows, FP : the set of product flows, FS : the set of service flows, FC : the set of content flows, FA : the set of custom flows, FF : the set of financial flows, T : the set of trade relationships.
Actors. We assume the following predicates are defined, in order to distinguish between the different kinds of actors: predicate supplier over A predicate coi over A predicate customer over A predicate customersc ust over A predicate intermediary over A The sets AS , ACoI , AC , AI and ACC are disjoint subsets of and total subdivisions over A. An actor can be only of
47
S.1
P.5
MS IIS
P.2
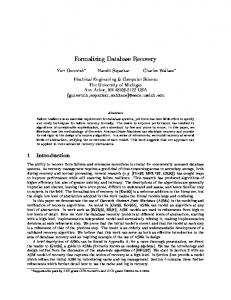
Figure 7 models CubicEyes’ SSN with CubicEyes at the center of the SSN, connected through multiple trade relationships to its suppliers, partners and customers. CubicEyes is directly supplying its customers with the EYEmove application service (S.1) and customers pay the appropriate fee (e.1) for it. Each customer also provides CubicEyes with its own real estate objects (C.1). A number of suppliers supply EYE-move with components, services and content. The Chilkat XML library is free for commercial use and iTextSharp is a free open-source library. Cyclomedia provides optional on-demand customer service and is paid for on a per usage basis (e.10). NetInvent is providing important network security services to both CubicEyes and its customers (S.3) and is being paid a monthly fee (e.3) NVM is providing data (C.2) on Netherlands-wide real estate objects. Vdvorm is the UI designer (S.5) for CubicEyes software products, receiving a per design fee (e.4). Hewlett Packard (HP) provides with the servers (P.2) which run a Microsoft (MS) Operating System (P.3), MS IIS Webserver (P.4), MS .NET Framework (P.5) and SYBASE DBMS (P.1). The SSN of CubicEyes enables further analysis of the business model of the company. The SSN of CubicEyes shows that though it is a relatively small company, it is dependent on a large amount of components from other parties. Furthermore, the company participates in several SECOs, such as the Microsoft SECO, the Sybase SECO, and the real estate SECO. The company is mostly dependent on three suppliers, being Microsoft, Sybase, and AMS-IX. In each of these main suppliers lies a risk for CubicEyes. One of these suppliers could decide no longer to support the required software or AMS-IX could decide no longer to provide its service. Though improbable, these risks must be considered during software development as well as during business model development. Similar things are true in regards to the data suppliers; if they decide to develop their own interfaces CubicEyes’ business model is threatened. Finally, the SSN can be used to theorize about new business models: CubicEyes could try supplying their service as a software product that is installed at the customer. Another example could be that CubicEyes starts providing their service in smaller segments, enabling others to resell those services.
Cycloconnect Plugin
.NET Framework P.6
iTextSharp
P.3
4.2 Software Supply Network
Web Browser P.8
EYE-move
P.7
P.1
Internet
Chilkat
SYBASE
Collocation Side Client Side
P.4
OS HP Server
Figure 6: CubicEyes PDC Diagram.
4.1 Product Deployment Context EYE-move is a large software product that is used by Real Estate agents and agencies that want to integrate most or all of their internal functions in one information system. EYEmove offers functionality for customer relationship management, multi-channel marketing and publishing, task and work flow management, real estate object properties management, etc. Furthermore, EYE-move provides access to the Dutch Association of Real Estate Brokers real estate database. Designed as a CMS, the software product is highly expandable and customizable both by the customer and the company itself, making it relatively easy to design and build custom modules that extend EYE-move’s functionality. A real estate agent-customer typically pays for the EYEmove service and accesses the application through a browser. EYE-move is hosted on the company’s self-owned servers, collocated with the ISP and hooked-up directly on the Internet backbone. Figure 6 presents the PDC diagram of CubicEyes. A customer’s request will be answered by the MS Internet Information Services (IIS) web-sever (P.4), which in turn is forwarded to EYE-move (S.1). EYE-move makes use of the .NET Framework (P.5) to communicate with the SYBASE database (P.1) and store/retrieve the necessary data. On request, EYE-move might also make use of iTextSharp PDFeditor component (P.7) and Chilkat XML .NET (P.6) component in order to read and write XML files. The server-side components run on a Microsoft Operating System. It is critical to mention at this point that the EYE-move application has been assigned the ID “S.1” (S marks a service) for consistency with the SSN and represents a software product that provides some service. The PDC of CubicEyes shows that Eye-move is dependent on many other components. Typically, products that are lower in the stack tend to change less frequently, and are therefor more stable. The same holds in this example, where the Eye-move product is updated frequently, whereas the HP server and its software are only updated when security requires it.
5. DISCUSSION AND CONCLUSIONS While working on the CubicEyes case study the SEM method was found to be of great use for communicating aspects of the software product’s deployment and software ecosystem. A number of issues regarding the PDC and SSN models were recognized though. For instance, the role of an organization is of higher importance that the company instance. In other words, a company embodying a number of substantially different roles is modeled accordingly equivalent times in the SSN, with different names that include the name of the company. Another issue encountered relates to the scalability of the modeling method. Being explicitly developed with simplicity in mind, aiming at the “interoperability” between technical and non-technical audiences (and biased in favor of non-technical audiences), the method was found not to scale well. When there are large numbers of participants in the SSN or components in the PDC, the models appear to be
48
Cyclomedia P.8
Netinvent S. 3
3 €.
Chilkat Software
S.3
P.6 6 S. 1 €.
iTextSharp
1
P.7
C.2
NVM
€.2
Vdvorm
S.1
CubicEyes
S.4
€.1
Customer C.1
€.4 P.1
SYBASE
€.5
P.2
P. 3
Microsoft
AMS-IX
€.9
€.8
P.
4
HP
S.5
P. 5
€.6
€.7
S.2
LeaseWeb Legend
Products
Services
Finance
Content
P.1 Sybase Database P.2 Server Machines P.3 Operating System P.4 MS IIS P.5 .NET Framework P.6 Chilkat XML .NET P.7 iTExtSharp P.8 Cycloconnect Plugin
S.1 Access to the EYE-move service S.2 High-Speed Internet S.3 Network Security S.4 User Interface Designs S.5 Server Collocation S.6 Cycloramas
€.1 Fee for S.1 €.2 Yearly fee for C.2 €.3 Monthly fee for S.3 €.4 Per design fee for S.4 €.5 Fee for P.1 €.6 Fee for P.2 €.7 Fee for P.3 €.8 Monthly fee for S.5 €.9 Fee for P.4 €.10 Fee for S.6
C.1 Real estate objects C.2 NL-wide Real Estate objects
Figure 7: CubicEyes SSN Diagram.
49
Acknowledgments. We would like to thank the CubicEyes team for their contribution of the case study and their followup discussions on the use of the models.
crowded. Further experimentation is needed with networking tools to semi-automatically gather data about SSNs and SECOs through network analysis and proxy variables, such as the number of incoming connections or the amount of money leaving the company. An interesting aspect surveyed during the case study relates to the learning curve of the modeling method. The SSN appears to have a low learning curve while the PDC has a high one. We attribute these differences on one hand to the similarity of the SSN diagram to other already established and well known arc-based or networked modeling techniques (i.e., UML) and on the other hand the “bricked”, seemingly unstructured nature of the PDC. Even though the PDC is actually more structured than the SSN, the top-down control/information flow approach appeared to be confusing in the beginning and its rules difficult to abide to. The resulting PDC diagrams however were found to be easily understandable and quite readable. The technique has been used for over 20 case studies in gaming companies and product software vendors. Furthermore, the techniques have been applied for over five years in the course of ICT Entrepreneurship, a master level course in which students have to design and develop a software product prototype. The models are used to further specify the underlying business model. Though it can not be considered a formal evaluation, the introduction of the formalization appears to have improved the students’ understanding of the modeling techniques, including a significant increase in grades for the business model assignment, while other grades were not significantly different from earlier years (over a period of three years). The research presented in this paper makes a contribution in the area of software ecosystems with the formalization of an integrated method for modeling software products and software supply networks. The method itself is mature enough to be used in the industry but there are nonetheless several issues uncovered that call for its further development. First of all, we see future research iterations on the theme focusing in typology researchers [4]: there is a need to extensively identify different constellation types of involved actors in an SSN and establish their typology. The formalization of this typology will add to the already existing functionality of the SEM method by enabling (1) vendors to theorize on and possibly exploit different distribution channel designs and (2) making assumptions about different actors’ roles and relationships. Another item on the agenda for future research is the creation/adoption of a modeling tool. During this research we have been experimenting with MetaEdit, a tool designed for the development of domain specific languages. Using a standard modeling tool is expected to lower the learning curve involved and enforce conformance of the derived diagrams, something that currently is possible only by reasoning with first order logic. Finally, as described in the introduction, this research is only a start in the area of SECO modeling. Presently many other challenges exist, for instance: the models of Iyer can be further enriched by defining extra properties, the effects of specific coordination techniques on the health of a SECO need to be defined, and architectural effects on the SSN or SECO level need to be researched. This work has focused on SSNs specifically, which leaves the area of complete SECO modeling and the higher scope level of SECOs interaction modeling for two new projects.
6. REFERENCES [1] N. V. Bala Iyer, Chi-Hyon Lee. Managing in a ”small world ecosystem”: Lessons from the software sector. Harvard Business Review, (5), May 2006. [2] P. Bannerman and L. Zhu. Standardization as a Business Ecosystem Enabler, pages 298–303. 2009. [3] S. Brinkkemper. Formalization of Information Systems Modelling. PhD thesis, 1990. [4] S. Brinkkemper, I. van Soest, and S. Jansen. Modeling of Product Software Businesses: Investigation into Industry Product and Channel Typologies, pages 1–19. 2007. [5] B. Farbey and A. Finkelstein. Software acquisition: a business strategy analysis. In Requirements Engineering, 2001. Proceedings. Fifth IEEE International Symposium on, pages 76–83, 2001. [6] A. R. Hevner, S. T. March, J. Park, and S. Ram. Design science in information systems research. MIS Quarterly, 28(1):75–105, 2004. [7] M. Iansiti and R. Levien. Strategy as ecology. Harvard Business Review, 82(3):68–78, March 2004. [8] S. Jansen, S. Brinkkemper, and A. Finkelstein. Providing Transparency In The Business Of Software: A Modeling Technique For Software Supply Networks, pages 677–686. 2007. [9] S. Jansen, S. Brinkkemper, I. Hunink, and C. Demir. Pragmatic and opportunistic reuse in innovative start-up companies. Software, IEEE, 25(6):42–49, 2008. [10] S. Jansen, A. Finkelstein, and S. Brinkkemper. A sense of community: A research agenda for software ecosystems. In Software Engineering, 2009. Proceedings. International Conference on, 2009. [11] S. Jansen and W. Rijsemus. Balancing total cost of ownership and cost of maintenance within a software supply network. In Software Maintenance. Industry Track. International Conference on, 2005. [12] D. G. Messerschmitt and C. Szyperski. Software Ecosystem: Understanding an Indispensable Technology and Industry, volume 1 of MIT Press Books. The MIT Press, 2005. [13] A. Osterwalder, Y. Pigneur, and C. Tucci. Clarifying business models: Origins, present, and future of the concept. The Communications of the Association for Information Systems, 16(1):25, 1, 2005. [14] D. Postmus and T. D. Meijler. Aligning the economic modeling of software reuse with reuse practices. Information and Software Technology, 50(7-8):753–762, June 2008. [15] I. van de Weerd and S. Brinkkemper. Metammodeling for Situational Analysis and Design Methods, pages 38–58. Hersey: Idea Group Publishing, 2008. [16] P. Weill and M. Vitale. Place to Space: Migrating to Ebusiness Models. Harvard Business School Press, 2001. [17] R. K. Yin. Case Study Research - Design and Methods. SAGE Publications, 2003.
50