analysis of a 3-C survey to predict sand/shale ratios in a Viking channel in the Winfield. Oil Field in Alberta. A increase in Vs/Vp correlated with an increase in ...
Formation elastic parameters
Formation elastic parameters and synthetic P-P and P-S seismograms for the Blackfoot field Colin C. Potter, Susan L.M. Miller and Gary F. Margrave ABSTRACT Formation elastic parameters were calculated from blocked P-wave sonic, S-wave sonic, and density logs from four wells in the Blackfoot Field. These data and cross plots of well log data from the Glauconitic channel showed a tendency for Vp/Vs to increase with shale content. This is primarily due to a decrease in Vs with increasing shaliness. Low Vp/Vs is a good diagnostic indicator of clean reservoir sand. P-P and P-S offset synthetic seismograms from these four wells were correlated to the Blackfoot 3C-3D survey at the well locations. Quality of correlation varied between synthetic seismograms and stacked data. There was good overall P-P and P-S correlation for the 08-08 and 12-16 wells, and the P-S correlation was superior to the P-P in the 04-16 and 09-17 wells. A different bandpass filter for the 04-16 P-P synthetic stack results in better correlation. INTRODUCTION A 3C-3D survey was acquired over the Blackfoot-Cavalier Field twenty kilometers south east of Strathmore, Alberta in November, 1995. The purpose of the survey was to use P-P and P-S seismic data to delineate Glauconitic incised valleys, and to distinguish between sand and shale valley fill. The purpose of the work presented here is to provide formation elastic parameters from well log data. These parameters are made available for reference and for input into further analyses. The well logs were also used to generate P-P and P-S offset synthetic seismograms, which were then correlated to the P-P and P-S 3D seismic surveys. The geology of the Blackfoot Field was discussed by Miller et al. (1995) in Volume 7 of the CREWES Research Report. This is a brief review of the lithology of the formations of interest in this paper. The Glauconitic consists of very fine to medium grained quartz sandstone in the eastern part of Alberta, and glauconite is only common northwards of central Alberta. The sediments of the channel in this study are subdivided into three units corresponding to three phases of valley incision; all three cuts may not be present everywhere. The lower and upper members are made up of quartz sandstones with an average porosity of approximately 18%, while the middle member is a relatively denser lithic sandstone. The channel sands shale out in some locations, such as at the 12-16 well. The primary hydrocarbon is oil, although gas may also be present in the upper member. The individual members range in thickness from 5-20 m. The incised valley cuts to varying depths through the underlying strata and thus the base may be found directly overlying one of several formations. The Ostracod beds underlying the Glauconitic are made up of brackish water shales, argillaceous, fossiliferous limestones and thin quartz sandstones and siltstones (Layer, D. B. et al, 1949). The Sunburst Member contains ribbon and sheet sandstones made up of sublitharenites and quartzarenites. The Detrital Beds make up the basal part of the Mannville Group. This unit has an extremely heterogeneous lithology containing chert pebbles, lithic sandstone, siltstone and abundant shale. Its distribution is largely controlled by depressions in the pre-Cretaceous erosional surface and, as such, its thickness is also highly variable over short distances. Within the study area, the
CREWES Research Report — Volume 8 (1996)
37-1
Potter, Miller and Margrave
Mannville Group lies unconformably over Mississippian carbonates of the Shunda Formation. The erosional contact surface has an irregular topography and, as the Shunda is shalier up-section, it cuts into varying lithologies. The elastic rock parameters are useful for characterizing the reservoir, and the elastic-wave synthetic seismograms provide a tie between well log data and seismic data. The following section reviews the relationship between velocity and various rock parameters. BACKGROUND Seismic velocities are affected by numerous geologic factors, including rock matrix mineralogy, porosity, pore geometry, pore fluid, bulk density, effective stress, depth of burial, type and degree of cementation, and degree and orientation of fracturing (McCormack et al., 1985). Deciphering the lithologic information inherent in seismic elastic-wave velocities requires an understanding of the relationship between geology and velocity. In order to understand how rock properties influence velocity, researchers have employed a variety of approaches, such as core analysis, well log and seismic interpretation, and numerical modelling (e.g., Kuster and Toksöz, 1974; Gregory, 1977; Eastwood and Castagna, 1983; McCormack et al., 1984). Well log studies are useful because logs provide us with independent measurements of various rock properties of interest. As explorationists, we are particularly interested in formation porosity, permeability, and pore fluid. We also want to identify lithologic variations between reservoir rock and non-reservoir rock. Ultimately, the goal is to deduce petrophysical information from multicomponent seismic data. To establish correlations between elastic-wave velocities and other rock properties, it is useful to think about how seismic waves propagate. In the case of shear waves, where particle motion is perpendicular to the direction of wave propagation, the rock undergoes a shearing stress which changes its shape, but not its volume. The more that a material resists the shear stress, the greater the shear velocity. In the case of compressional waves, where particle motion is parallel to the direction of wave propagation, the rock undergoes a compressional stress which causes a change in both shape and volume. Again, the more the material resists this deformation, the higher the velocity of the propagating wave. The mode of wave propagation is reflected in the equations for Vp and Vs, where the rigidity modulus (µ) is a measure of the resistance to shearing stress, and the bulk modulus (κ) is a measure of the incompressibility. Both Vp and Vs are inversely related to density (ρ).
Vp =
k + 4µ 3 ρ
Vs = (1)
µ ρ
(2)
The equations indicate that if all other factors stay equal, an increase in density will lower both Vp and Vs; however, increases in formation density are usually accompanied by proportionately larger increases in the rigidity and/or incompressibility of the rock. For example, the increase in density which sediments undergo when they are buried, compacted, cemented, and lithified, coincides with a greater increase of the rigidness and incompressibility of the material, so that the seismic velocities increase. Density is empirically related to porosity by the following equation:
37-2
CREWES Research Report — Volume 8 (1996)
Formation elastic parameters
ρb = ρf φ + ρm (1 - φ)
(3)
where: ρb = bulk density ρf = pore fluid density φ = porosity ρm = matrix density Vp, Vs and bulk density (ρ) can be used to calculate other elastic moduli, including Young's modulus (E), Poisson's ration (σ), rigidity modulus (µ), bulk modulus (κ), Lame's constant (λ). The equations relating these parameters are shown in Table 1 (Sheriff and Geldart, 1995) Poisson's ratio (σ) is another elastic parameter that can improve predictions about mineralogy, porosity, and reservoir fluid type (e.g. Pickett, 1963; Tatham, 1982; Rafavich et al, 1984; Miller and Stewart, 1990). In a static sense, σ is the ratio of fractional lateral contraction to fractional longitudinal extension when a rod is stretched (Sheriff, 1991). Thus, σ tends to be high in 'soft' materials, and low in stiffer materials. Poisson's ratio can be dynamically related to elastic-wave velocities by the following equations: 2
Vp .5 − 1 Vs σ= 2 Vp − 1 Vs
(4)
Vp 1− σ = .5 − σ Vs
(5)
Vp/Vs increases monotonically as σ increases. Thus, we expect softer rocks, such as unconsolidated sediments or shales, to have high values of Vp/Vs, and hard rocks, such as consolidated clastics and carbonates, to have lower values of Vp/Vs. Velocity and lithology P-wave velocity alone is not a good lithology indicator because of the overlap in Vp for various rock types. The additional information provided by Vs can reduce the ambiguity involved in interpretation. Pickett (1963) demonstrated the potential of Vp/Vs as a lithology indicator through his laboratory research. Using core measurements he determined Vp/Vs values of 1.9 for limestone, 1.8 for dolomite, 1.7 for calcareous sandstone, and 1.6 for clean sandstone. Subsequent research has generally confirmed these values, and has also indicated that Vp/Vs in mixed lithologies varies linearly between the limits of Vp/Vs for the end members (Nations, 1974; Kithas, 1976; Eastwood and Castagna, 1983; Rafavich et al., 1984; Wilkens et al, 1984; Castagna et al., 1985, Miller and Stewart, 1990). Clay content is a significant factor in the study of velocity-porosity relationships in clastic silicate rocks. A number of workers have included a clay term in empirical linear regression equations developed from core analysis data (Tosaya and Nur, 1982; Castagna et al., 1985; Han et al., 1986; King et al., 1988; Eberhart-Phillips et al., 1989). When both porosity and clay effects were studied, porosity was shown to be the dominant effect by a factor of about 3 or 4 (Tosaya and Nur, 1982; Han et al., 1986; King et al., 1988). Vernik and Nur (1991) observed that correlations between
CREWES Research Report — Volume 8 (1996)
37-3
Potter, Miller and Margrave
velocity and porosity in sandstones improved significantly if sandstones were divided into separate categories based on clay volume. Clay which is incorporated into the rock matrix, or is layered between more competent rocks, will make the rock less able to resist shearing forces. Lowering the rigidity of the rock lowers both Vp and Vs, but has a greater affect on Vs, resulting in an overall increase in Vp/Vs (Minear, 1982). This result has been observed in core studies of clastic silicates (Han et al., 1986; King et al., 1988) and well logging studies of clastic silicates (Castagna et al., 1985). The increase in Vp/Vs with shaliness has been used in seismic field studies to outline sandstone channels encased in shales (Garotta et al, 1985; McCormack et al, 1984). Garrotta et al. (1985) used Vs/Vp analysis of a 3-C survey to predict sand/shale ratios in a Viking channel in the Winfield Oil Field in Alberta. A increase in Vs/Vp correlated with an increase in sand channel thickness as determined from well log data. McCormack et al. (1985) used Vp/Vs analysis to identify sandstones encased in shales in the Morrow Formation in the Empire Abo Field of New Mexico. They observed a decrease in Vp/Vs moving along the line from a dry hole to a productive well. The effects of porosity, gas saturation, and sand/shale ratios were modelled; the best fit to the data was a model of increasing sandstone content. Comparison of sonic logs and seismic data The data presented in this paper are obtained from borehole logs. When using these data to interpret multicomponent seismic data, there are several factors to consider. Well logs sample a thin annulus around the borehole, whereas surface seismic and VSPs sample average rock properties over large areas of unaltered rock. The depth of penetration of acoustic logs is dependent on signal frequency, and transmitter and receiver spacing, but is generally about one sonic wavelength (Paillet and Cheng, 1991). The rock in the region of the borehole is altered by the drilling process. Fluid invasion, borehole washouts, fractures, and mud cake affect the well log readings. By using longer spacing and lower frequencies, full-waveform tools attempt to penetrate beyond this altered zone. Other factors which influence log measurements include the presence of clay or gas, and tool effects such as tilting. The frequency of the log signal is tens of kHz, compared to the seismic signal of tens of Hz. Because it has a much shorter wavelength, the sonic log signal may be influenced by small scale features in the travel path, such as mineral inclusions. Fractures and bed boundaries act as discrete discontinuities to the high frequency signal. At the longer wavelength used in surface seismic surveys, all of these features are averaged into the bulk properties of the rock (Liu, 1987; Paillet and Cheng, 1991). Conversely, the seismic wavefield will respond to lateral facies changes and large scale heterogeneities which are not visible at the well bore. In a vertical well, the travel path of the log signal is close to vertical, whereas seismic rays travel at an angle which is dependent on offset and depth. In rocks where layering, fractures, or other features have caused velocity anisotropy, the sonic log data and the seismic data may be recording different quantities. Because of the bandwidth difference, sonic and seismic wave trains have different velocity dispersion characteristics. In the case of normal dispersion, high frequencies travel faster than low frequencies, so that the integrated sonic log travel times are generally shorter than seismic travel times (Stewart et al., 1984).
37-4
CREWES Research Report — Volume 8 (1996)
Formation elastic parameters
The Vp and Vs values presented in this paper were obtained from the P and S transit times from dipole sonic logs. These tools use a dipole source to generate a flexural wave which deforms the borehole. The first arrival travels at the same velocity as the S-wave, and no Stoneley wave is generated. P waves are recorded using an alternately firing monopole source. Dipole tools can also be run in cased holes. FORMATION ELASTIC PARAMETERS The parameters in Tables 3 - 6 are taken from log data from four wells (08-08; 0416; 12-16; and 09-17) in the Blackfoot Field located in Township 23, Range 23 West of the 4th Meridian. These wells were selected because they have dipole sonic logs over the zone of interest in addition to a full suite of conventional logs. The parameters were obtained using MATLAB scientific programming environment. Well logs (P sonic, S sonic and density) were blocked across the lithological units listed in Table 1 using the LOGEDIT algorithm (Margrave and Foltinek, 1995). The mean value between units was used for blocking. Each depth relates to the top of the formation and it’s corresponding interval. The slowness values (us/m) were converted to velocity (m/s) for the P sonic and S sonic logs. The blocked Vp, Vs and ρ log values were used to calculate Vp/Vs, σ, κ, µ, λ and Ε using the elastic equations in Table 1. References to the conventions are as follows: Vp or α for P-wave velocity (m/s); Vs or β for S-wave velocity (m/s); ρ for density (kg/m3); σ for Poisson’s ratio; κ for Bulk modulus (pascals); µ for Rigidity modulus (pascals); λ for Lame’s constant (pascals); Ε for Young’s modulus (pascals). The sonic curve data from the Ostracod in the 09-17 well were judged unreliable and therefore not included in the analysis. Table 2 shows the naming conventions used in Figures 3 - 7, Tables 3 - 6, and other chapters in the 1996 CREWES Research Report Volume 8.
CREWES Research Report — Volume 8 (1996)
37-5
Potter, Miller and Margrave
Table 1. Relations between elastic constants and velocities (Sheriff and Geldart, 1995)
Table 2. Formation naming conventions Abbreviation 2WS BFS VIKING MANN COAL 1 COAL 2 COAL 3 GLCTOP LITHCH GLCSS OST SUNB DET MISS
37-6
Unit Name Second White Speckled Shale Base of Fish Scales Zone Viking Blairmore - Upper Mannville 1st Coal Layer 2nd Coal Layer 3rd Coal Layer Glauconitic Channel Top Lithic Channel Unit Glauconitic Channel Porous Sandstone Unit Ostracod Sunburst Detrital Shunda - Mississippian
CREWES Research Report — Volume 8 (1996)
Formation elastic parameters
Table 3. Formation parameters for 08-08 (oil well on channel) Fm Units above MANN COAL 1 COAL 2 COAL 3 GLCTOP LITHCH GLCSS DET MISS
Depth m 1362 1432 1504 1512 1524 1552 1576 1582 1595 1612
Vp m/s 3872 3978 3700 3996 4064 3860 4299 3783 4256 6008
Vs m/s 2030 2097 2117 2233 2098 2322 2513 2295 2506 3116
Vp/Vs 1.907 1.897 1.747 1.790 1.937 1.662 1.710 1.648 1.698 1.928
σ 0.310 0.307 0.256 0.273 0.318 0.216 0.240 0.208 0.234 0.316
ρ kg/m3 2500 2512 2366 2437 2495 2412 2530 2383 2521 2661
κ e10Pa 2.374 2.501 1.824 2.271 2.656 1.859 2.544 1.735 2.455 6.160
µ e10Pa 1.030 1.105 1.060 1.214 1.097 1.300 1.598 1.255 1.583 2.584
λ e10Pa 1.687 1.765 1.117 1.461 1.924 0.992 1.478 0.898 1.399 4.438
E e10Pa 2.700 2.890 2.665 3.093 2.895 3.163 3.964 3.035 3.909 6.801
Table 4. Formation parameters for 04-16 (shale filled channel) Fm Units above 2WS BFS VIKING MANN COAL 1 COAL 2 COAL 3 GLCTOP SUNB DET MISS
Depth m 1180 1227 1315 1338 1433 1511 1518 1529 1561 1580 1589 1625
Vp m/s 3475 3535 3291 3826 3980 3396 4177 3964 4053 4377 4418 5477
Vs m/s 1815 1851 1516 1995 2018 1662 2100 2042 2110 2320 2396 2870
Vp/Vs 1.914 1.910 2.171 1.918 1.972 2.044 1.989 1.941 1.921 1.887 1.844 1.908
σ 0.312 0.311 0.365 0.313 0.326 0.342 0.330 0.319 0.314 0.304 0.291 0.310
ρ kg/m3 2536 2535 2475 2513 2517 2259 2547 2544 2574 2566 2519 2393
κ e10Pa 1.948 2.009 1.922 2.345 2.619 1.773 2.945 2.583 2.700 3.074 2.989 4.549
µ e10Pa 0.835 0.868 0.568 0.999 1.025 0.623 1.122 1.061 1.145 1.380 1.446 1.970
λ e10Pa 1.391 1.430 1.543 1.679 1.936 1.358 2.197 1.876 1.936 2.154 2.025 3.235
E e10Pa 2.193 2.277 1.553 2.626 2.720 1.675 2.988 2.800 3.011 3.603 3.736 5.167
λ e10Pa 1.492 1.498 1.503 1.729 1.956 1.462 1.976 1.946 1.805 1.482 2.297 4.304
E e10Pa 2.236 2.176 1.509 2.668 2.731 1.722 2.933 2.932 2.985 3.327 3.684 6.639
Table 5. Formation parameters for 12-16 (shale filled channel) Fm Units above 2WS BFS VIKING MANN COAL 1 COAL 2 COAL 3 GLCTOP GLCSS DET MISS
Depth m 1229 1241 1328 1353 1445 1519 1525 1538 1566 1586 1595 1611
Vp m/s 3562 3557 3303 3865 3987 3485 4121 4071 3999 4062 4458 5897
Vs m/s 1837 1819 1520 2008 2018 1683 2120 2103 2113 2297 2339 3063
Vp/Vs 1.939 1.955 2.173 1.925 1.975 2.071 1.944 1.936 1.892 1.769 1.906 1.925
σ 0.318 0.322 0.365 0.315 0.327 0.348 0.320 0.318 0.306 0.265 0.310 0.315
ρ kg/m3 2512 2485 2390 2516 2525 2256 2472 2516 2558 2493 2571 2690
κ e10Pa 2.057 2.046 1.871 2.405 2.642 1.887 2.717 2.687 2.567 2.359 3.234 5.987
µ e10Pa 0.847 0.822 0.552 1.014 1.028 0.638 1.111 1.112 1.142 1.314 1.405 2.524
CREWES Research Report — Volume 8 (1996)
37-7
Potter, Miller and Margrave
Table 6. Formation parameters for 09-17 (regional) Fm Units above MANN COAL 1 COAL 2 COAL 3 SUNB DET MISS
Depth m 1440 1450 1526 1532 1545 1593 1606 1637
Vp m/s 3597 3862 3416 3971 3890 4072 4170 5061
Vs m/s 1865 2011 1659 1996 2031 2122 2184 2421
Vp/Vs 1.928 1.920 2.059 1.989 1.916 1.919 1.909 2.091
σ 0.316 0.314 0.345 0.330 0.312 0.313 0.311 0.351
ρ kg/m3 2547 2528 2305 2508 2561 2550 2538 2669
κ e10Pa 2.113 2.407 1.844 2.622 2.466 2.696 2.798 4.751
µ e10Pa 0.886 1.022 0.634 0.999 1.055 1.148 1.210 1.564
λ e10Pa 1.522 1.725 1.420 1.956 1.762 1.931 1.991 3.708
E e10Pa 2.333 2.687 1.708 2.661 2.772 3.017 3.174 4.229
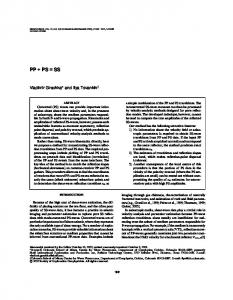
Although these data are provided primarily as a reference, we can make several observations directly from the tables. In the 08-08 well, Vp/Vs is lowest in the porous upper and lower units (1.66 and 1.65 respectively). The middle lithic unit is somewhat higher (1.71), but still within range for a sandstone. By contrast, Vp/Vs for Glauconitic is significantly higher in the shaley channel wells (1.89 to 1.92). The Glauconitic Channel Porous Sandstone unit within the 12-16 well is composed of 3 meters of sandstone and 6 meters of shale and Vp/Vs (1.77) is an intermediate value between sandstone and shale. In formations outside of the channel, the Detrital Vp/Vs values reflect the heterogeneity of this unit, ranging from 1.70 to 1.91. Although the logs terminate in the Mississippian, Vp/Vs values of 1.91 to 2.09 are reasonable for the shaley carbonate facies of the Shunda Formation. The Vp/Vs values of the formations above the Channel are generally over 1.92, suggesting significant shale content. Values of 1.92 to 2.07 in 12-16, 04-16, and 09-17 wells are also reasonable for coals. The coals in 0808 are much lower, but these beds are very thin and difficult to sample adequately. The relationship between Vp/Vs and sand/shale content is analyzed further in the next section. Analysis of Glauconitic channel data The data examined here are P-wave and S-wave transit times from the 08-08, 12-16 and 04-16 dipole sonic logs from the Glauconitic Formation. This formation is largely sandstone in the 08-08 well and primarily shale, with a 3 m layer of sandstone, within the 12-16 well. The 04-16 well is also primarily shale with a dirty sand lens. Transit times were converted to velocity and the gamma logs from the same zone were used for shale estimates. Figure 1 is a plot of Vp/Vs versus gamma log values for the 08-08, 12-16 and 04-16 wells in the Glauconitic formation. The data are very scattered, although there is a general trend for Vp/Vs to increase with increasing gamma log values, which in turn reflect increasing shale content. The majority of the data points from the 08-08 well have API values less than 90 and there is a dense cluster of points with values of less than 40 API. Most points from this well have Vp/Vs values ranging from 1.55 to 1.75; values indicative of sandstone lithologies (e.g. Miller and Stewart, 1990; EberhartPhillips et al., 1989; Han et al., 1986; Castagna et al., 1985). In contrast, most of the 04-16 and 12-16 data points have gamma ray values above 80 API and have Vp/Vs values from 1.80 to greater than 2.0. The exceptions are the data points from the thin
37-8
CREWES Research Report — Volume 8 (1996)
Formation elastic parameters
layer of sandstone within the Glauconitic Formation shown with hollow circles. These have low gamma readings, generally less than 40 API, and low Vp/Vs values, mostly from 1.60 to 1.70. The data points from the sandstone layer plot in a distinctly different region of the graph than the 12-16 data points from the shale section. These results are in agreement with the work of Han et al, 1986, and Castagna et al., 1985, which shows that Vp/Vs will increase as shale content increases. The cause of the increase in Vp/Vs with increasing shale content is illustrated by the graph of Vs versus Vp shown in Figure 2. Using the P-wave velocity alone, sandstone from the 08-08 well cannot be distinguished from shale from the 12-16 and 04-16 wells. However, S-wave velocities are significantly greater in the 08-08 sandstone section than the 12-16 and 04-16 shale section. Again, the points from the thin 12-16 sandstone layer also have a relatively higher S-wave velocity and tend to plot in the same region as the 08-08 data. This plot indicates that the increase in Vp/Vs with increasing shaliness is due to Vs decreasing while Vp remains relatively constant. 2.10
08-08 sand 12-16 shale 12-16 sand 04-16 shale
2.05 2.00 1.95
Vp/Vs
1.90 1.85 1.80 1.75 1.70 1.65 1.60 1.55
21
31
41
51
61 71 Gamma (API)
81
91
101
FIG. 1. Vp/Vs versus gamma values in the Glauconitic Formation for the 08-08, 04-16 and 12-16 wells.
CREWES Research Report — Volume 8 (1996)
37-9
Potter, Miller and Margrave
2600 2500
Vs (m/s)
2400 2300 2200 2100 08-08 sand 12-16 shale 12-16 sand 04-16 shale
2000 1900
3600
4000
4400
4800
Vp (m/s)
FIG. 2 Vs versus Vp in the Glauconitic Formation for the 08-08, 04-16 and 12-16 wells. P-P AND P-S SYNTHETIC SEISMOGRAMS One of the ultimate goals of multicomponent seismic data analysis is to extract rock properties from seismic sections. A critical step in this process is the correlation between synthetic seismograms generated from well logs and seismic data. Figures 3 to 7 show input P sonic, S sonic and density logs, output P-P and P-S offset synthetic stacks, and P-P and P-S seismic data from the Blackfoot 3C-3D survey. The well logs were sized using the LOGEDIT program in MATLAB. The P sonic, S sonic and density logs from each well were used for input to the SYNTH program (Lawton and Howell, 1992; Margrave and Foltinek, 1995). The P-P and P-S offset synthetic seismograms were generated from the SYNTH Algorithm as implemented in MATLAB. The offset seismograms are stacked and four traces are displayed. The synthetic seismograms have not been check shot corrected. The parameters used to generate the offset synthetic stacks are listed below. PARAMETER receiver type near offset capture radius number of receivers receiver spacing offsets log integration interval top layer specifications “ “ synthetic -> reflection type
37-10
VARIABLES Vertical (P - P ), horizontal (P - S ) 0 m 10 m 15 100 m 0 to 1500 m 2.0 ms Vp = 2860 m/s Vs = 1430 m/s Density = 2300 kg/m3 P-P, P-S
CREWES Research Report — Volume 8 (1996)
Formation elastic parameters
wavelet wavelet sample record
(P - P ) (P - S ) rate length
10/14-90/100 and 10/14-70/80 6/10-42/50 1 ms 2000 ms
Sensor Geophysical Limited processed the P-P and P-S seismic data. This data was acquired from Photon’s SeisX package point files. These point files consisted of six traces in the inline (E-W) direction at each corresponding well. The third and fourth trace of each data set are closest to each well. The 08-08 and 09-17 logs extend from above the Blairmore (Mannville) to just below the Shunda (Mississippian). The 12-16 and 04-16 logs extend from above the Second White Speckled Shale to just below the Shunda. Since the logs were all recorded to slightly below the Shunda formation, a full wave cycle below this formation could not be generated for the synthetic seismograms. The synthetic stacks may not be accurate at this formation.
CREWES Research Report — Volume 8 (1996)
37-11
1450
1650 400
1600
1550
1500
DEPTH (m)
us/m
CREWES Research Report — Volume 8 (1996) 100 650
us/m
S-sonic
250 3.0
no units
Vp/Vs
1.2 1200
kg/m 3
Density
3000
P-P data
P-P synthetic stack
P-S data
1625
1600
1575
1550
1525
1500
1475
1450
1425
GLCTOP LITHCH GLCSS DET MISS
COAL 1 COAL 2 COAL 3
MANN
P-S synthetic stack
FIG. 3 Correlation of 08-08 well logs in depth with migrated vertical (P-P data) and radial (P-S data) and the corresponding synthetic stacks in time
P-sonic
1100
1075
1050
1025
1000
975
950
08-08-23-23W4
TIME (ms)
37-12
1400
1350
Potter, Miller and Margrave
DEPTH (m)
CREWES Research Report — Volume 8 (1996)
1650
1600
1550
1500
1450
1400
1350
1300
1250
1200
1150
400 us/m 150 900 us/m
S-sonic
300 4.0
Vp/Vs
no units
1.0 1400
kg/m 3
Density
3200
P-P data
1100
1075
1050
1025
1000
975
950
925
900
875
850
825
P-P synthetic stack
1600
1550
1500
1450
1400
1350
1300
P-S data
1250
MISS
GLCTOP SUNB DET
COAL 1 COAL 2 COAL 3
MANN
VIKING
BFS
2WS
P-S synthetic stack
FIG 4. Correlation of 04-16 well logs in depth with migrated vertical (P-P data) and radial (P-S data) and the corresponding synthetic stacks in time
P-sonic
TIME (ms)
04-16-23-23W4
Formation elastic parameters
37-13
CREWES Research Report — Volume 8 (1996)
1650
1600
1550
1500
1450
450
1400
1350
1300
us/m
150 900
us/m
S-sonic
300 3.5
no units
Vp/Vs
1.0 1400
kg/m 3
Density
3000
P-P data
1080
1060
1040
1020
1000
980
960
940
920
900
880
860
P-P synthetic stack
P-S data
1600
1550
1500
1450
1400
1350
1300
GLCTOP GLCSS DET MISS
COAL 1 COAL 2 COAL 3
MANN
VIKING
BFS
2WS
P-S synthetic stack
FIG. 5 Correlation of 12-16 well logs in depth with migrated vertical (P-P data) and radial (P-S data) and the corresponding synthetic stacks in time
P-sonic
TIME (ms)
37-14
1250
1200
12-16-23-23W4
Potter, Miller and Margrave
DEPTH (m)
DEPTH (m)
1700
1650
1600
1550
1500
1450
1400
400
CREWES Research Report — Volume 8 (1996) 150 900
S-sonic
us/m
Vp/Vs
300 3.0 no units
kg/m 3
3000
Density
1.5 1500
TIME (ms) P-P data
P-P synthetic stack
P-S data
1650
1130
1600
1100
1625
1575
1080
1120
1550
1060
MISS
OST SUNB DET
COAL 1 COAL 2 COAL 3
MANN
P-S synthetic stack
FIG. 6 Correlation of 09-17 well logs in depth with migrated vertical (P-P data) and radial (P-S data) and the corresponding synthetic stacks in time
P-sonic
us/m
1500
1020
1525
1475
1000
1040
1450
980
09-17-23-23W4
Formation elastic parameters
37-15
CREWES Research Report — Volume 8 (1996)
1650
1600
1550
1500
1450
1400
1350
1300
1250
400 us/m 150 900 us/m
S-sonic
300 4.0 no units
Vp/Vs
1.0 1400
kg/m 3
Density
3200
P-P data
P-P synthetic stack
1600
1550
1500
1450
1400
1350
1300
P-S data
1250
MISS
GLCTOP SUNB DET
COAL 1 COAL 2 COAL 3
MANN
VIKING
BFS
2WS
P-S synthetic stack
FIG 7. Correlation of 04-16 well logs in depth with migrated vertical (P-P data) and radial (P-S data) and the corresponding synthetic stacks in time (P-P synthetic stack with 10/14-70/80 filter)
P-sonic
1100
1075
1050
1025
1000
975
950
925
900
875
850
825
04-16-23-23W4
TIME (ms)
37-16
1200
1150
Potter, Miller and Margrave
The 08-08 P-P and P-S data correlation is very good. The P-P data and P-P synthetic stack correlates well across the coal markers and the channel where the all three units of Glauconitic are observed. The P-S correlation is good over all, but the
DEPTH (m)
Formation elastic parameters
data is slightly noisy near Glauconitic channel top, probably due to tuning effects. The P-S data in 08-08 is changing rapidly across five traces and shows better correlation at trace 2, then between traces 3 and 4 which is at the well location. The 04-16 P-S data correlates very well with the P-S synthetic stack. The amplitude peak of the Sunburst formation on the P-S data does not exist, although in traces 4 and 5 there is indication of a peak forming. The 04-16 P-P correlation is reasonable down to 1010 ms, but is poor below this. Figure 7 has much better correlation for the 04-16 P-P data than in Figure 4. The P-P synthetic stack (Figure 7) was generated with a 10/14-70/80 bandpass filter. The 12-16 P-P and P-S data correlates very well with the synthetic stacks, except for the P-P correlation below 1010 ms. The P-S correlation at the channel is excellent down to Coal 1, but deteriorates in the channel where the data becomes noisy. The 09-17 P-P data correlates poorly with the synthetic stack, even when a 10/14-70/80 bandpass filter was applied. Conversely, the P-S synthetic seismogram ties the data much better. Generally, the P-S correlation is much better than the P-P correlation in all the wells. The bandpass filter of 10/14-90/100 used for the P-P synthetic seismogram may be too high for the high cut pass. Check shots implementation could result in better correlation. CONCLUSIONS Vp/Vs values were calculated from P sonic and S sonic curves. Vp/Vs tends to increase as shale content increases. Low Vp/Vs values are a diagnostic indicator of clean sandstones. Vs is higher in sandstone than shale while Vp is less sensitive, resulting in an overall decrease in Vp/Vs. The correlation of the P sonic, S sonic, Vp/Vs, and density logs, synthetic stacked seismograms and the stacked migrated data vary. There was good overall P-P and P-S correlation in the 08-08 and 12-16 data. For the 04-16 and 09-17 data, P-S correlation is superior to P-P when using a bandpass filter of 10/14-90/100. A band pass filter of 10/14-70/80 for the 04-16 P-P synthetic stack resulted in very good correlation. FUTURE WORK Further analysis of formation elastic parameters for all the wells in the Blackfoot Field would improve diagnostics with geostatistical software. S sonic logs for all wells could be generated from P sonic curves using Vp/Vs relationships observed in the formation elastic parameters given here. Then P-S seismograms could be generated and correlated all wells to all migrated data sets. Better wavelet extraction is needed to generate specific synthetic seismograms. ACKNOWLEDGMENTS We would like to thank the staff of PanCanadian Petroleum Limited for valuable knowledge and data of the project area, in particular Ian Shook, Andre Politylo, Andy Edmunds, Bill Goodway and Garth Syhlonyk. We also like to thank GMA Ltd. and Photon Systems Ltd. for providing interpretative software, the CREWES staff for their assistance, especially Vladan Simin for helping generate offset synthetic seismograms, Darren Foltinek and Henry Bland for expert advice on the modelling and graphics software, and Don Lawton for his input and direction for this paper.
CREWES Research Report — Volume 8 (1996)
37-17
Potter, Miller and Margrave
REFERENCES Castagna, J.P., Batzle, M.L., and Eastwood, R.L., 1985, Relationships between compressional-wave and shear-wave velocities in clastic silicate rocks: Geophysics, 50, 571-581. Eastwood, R.L. and Castagna, J.P., 1983, Basis for interpretation of Vp/Vs ratios in complex lithologies: Soc. Prof. Well Log Analysts 24th Annual Logging Symp. Eberhart-Phillips, D., Han, D.H., and Zoback, M.D., 1989, Empirical relationships among seismic velocity, effective pressure, porosity, and clay content in sandstone: Geophysics, 54, 82-89. Garotta, R., Marechal, P., and Megesan, M., 1985, Two-component acquisition as a routine procedure for recording P-waves and converted waves: Journal of the Canadian Society of Exploration Geophysicists, 21, 40-53. Gregory, A.R., 1977, Aspects of rock physics from laboratory and log data that are important to seismic interpretation, in Seismic Stratigraphy - Applications to Hydrocarbon Exploration: AAPG Memoir 26, 15-45. Han, D.H., Nur, A., and Morgan, D., 1986, Effects of porosity and clay content on wave velocities in sandstones: Geophysics, 51, 2093-2107. King, M.S., Stauffer, M.R., Yang, H.J.P., and Hajnal, Z., 1988, Elastic-wave and related properties of clastic rocks from the Athabasca Basin, Western Canada: Can. J. Expl. Geophys., 24,110-116. Kithas, B.A., 1976, Lithology, gas detection, and rock properties from acoustic logging systems: Soc. Prof. Well Log Analysts 17th Annual Symp. Kuster, G.T. and Toksöz, M.N., 1974, Velocity and attenuation of seismic waves in two-phase media: Part 1. Theoretical formulations: Geophysics, 39, 587-606. Lawton, D.C., and Howell, T.C., 1992, P-P and P-SV synthetic stacks, Expanded Abstract, 62nd SEG Annual International Meeting, October 25-29, New Orleans, USA, 1344-1347 Layer, D.B. and Members of Staff, Imperial Oil Ltd., 1949, Leduc oil field, Alberta, a Devonian coral reef discovery: Bulletin of the American Association of Petroleum Geologists, 33, 575-602. Liu, O.Y., 1987, The sources of errors in slowness measurements and an evaluation of full waveform compensation techniques: Soc. Petr. Eng. 62nd Annual Tech. Conf. & Exhib. McCormack, M.D., Dunbar, J.A. and Sharp, W.W., 1984, A case study of stratigraphic interpretation using shear and compressional seismic data: Geophysics, 49, 509-520. McCormack, M.D., Dunbar, J.A. and Sharp, W.W., 1985, A stratigraphic interpretation of shear and compressional wave seismic data for the Pennsylvanian Morrow formation of southeastern New Mexico, in Seismic Stratigraphy II: AAPG Memoir 39, 225-239. Margrave, G.F., Foltinek, D.S., 1995, P-P and P-SV cross sections: CREWES Research Report 1995, Ch 5. Miller, S.L.M., Aydemir, E.Ö. and Margrave, G.F., 1995, Preliminary interpretation of P-P and P-S seismic data from the Blackfoot broad-band survey: CREWES Research Report 1995, Ch 42. Miller, S.L.M. and Stewart, R.R., 1990, Effects of lithology, porosity and shaliness on P- and S-wave velocities from sonic logs: Can. J. Expl. Geophys., 26, 94-103. Minear, J.W., 1982, Clay models and acoustic velocities: Soc. Petr. Eng. of AIME 57th Annual Tech. Conf. & Exhib. Nations, J.F., 1974, Lithology and porosity from acoustic shear and compressional wave transit time relationships: Soc. Prof. Well Log Analysts 15th Annual Symp. Paillet, F.L. and Cheng, C.H., 1991, Acoustic waves in boreholes: CRC Press, Inc. Pickett, G.R., 1963, Acoustic character logs and their applications in formation evaluation: J. Petr.Tech., June, 659-667. Rafavich, F., Kendall, C.H.St.C., and Todd, T.P., 1984, The relationship between acoustic properties and the petrographic character of carbonate rocks: Geophysics, 49, 1622-1636. Sheriff, R.E., 1991, Encyclopedic Dictionary of Exploration Geophysics, Third Ed., SEG Sheriff, R.E., and Geldart, L.P., 1995, Exploration Seismology, Cambridge University Press, New York, NY Stewart, R.R., Huddleston, P.D., and Kan, T.K., 1984, Seismic versus sonic velocities: A vertical seismic profiling study: Geophysics, 49, 1153-1168. Tatham, R.H., 1982, Vp/Vs and lithology: Geophysics, 47, 336-344. Tosaya, C. and Nur, A., 1982, Effects of diagenesis and clays on compressional velocities in rocks: Geophys. Res. Lett., 84, 3532-3536. Vernik, L. and Nur, A., 1991, Lithology prediction in clastic sedimentary rocks using seismic velocities: presented at the 1991 SEG Summer Research Workshop, St. Louis, Missouri. Wilkens, R., Simmons, G., and Caruso, L., 1984, The ratio Vp/Vs as a discriminant of composition for siliceous limestones: Geophysics, 49, 1850-1860.
37-18
CREWES Research Report — Volume 8 (1996)