Review of European Studies; Vol. 9, No. 1; 2017 ISSN 1918-7173 E-ISSN 1918-7181 Published by Canadian Center of Science and Education
Formulation and Anticipated Approach for Developing a New Business through Integrated Strategic Morphological Analysis and Integrated Fuzzy Approach and Estimate the Cost of the Integration of PSO and BP Neural Network in the Plastic Injection Molding Industry Seyed Ashkan Hoseini Shekarabi1 & Behrouz Dorri2 1
Department of Management, Alborz University, Qazvin, Iran
2
Department of Industrial Management, Shahid Beheshti University, Tehran, Iran
Correspondence: Seyed Ashkan Hoseini Shekarabi, Department of Management, Alborz University, Qazvin, Iran. E-mail:
[email protected] Received: February 7, 2017
Accepted: February 10, 2017
Online Published: February 16, 2017
doi:10.5539/res.v9n1p239
URL: http://doi.org/10.5539/res.v9n1p239
Abstract In this article we have tried to identify the factors by which industry experts predict medium-term future, then the relationship between the environmental factors determined by comparing the morphology characterized couple, this relationship is obtained through interviews with experts economy. The experts in economic conditions and environmental factors determine the medium-term future. Finally, according to industry experts on space environmental conditions, inter-organizational scenarios to determine the ranking. Using fuzzy decision-making through the evaluation and ranking of organizational standpoint, the most appropriate one is selected that has the features, dimensions and unique circumstances applicable to the environment. Due to the globalization of business in recent years, managers and business owners are looking to cut costs and accurate and realistic estimates of cost, due to its ability to make the right decision about the products and the future of their business. At the end of a cost estimate for superior business model that obtained by ranking methods propagation is back propaganda neural network Particle swarm optimization. It is also complex and covers defects traditional methods. Hybrid algorithm can not only take advantage of the ability to search for a strong global particle swarm optimization, but also be robust search capability regional propagation neural network as well. The corresponding operation in MATLAB software environment (MATLAB) is implemented. Finally, model related to the choice of business, business model and cost estimates provided kitchenware and printing and packaging businesses are adaptable to future requirements and trends toward this part of the industry for the benefit of the organization. Keywords: morphology, environment, fuzzy hierarchical analysis, cost estimation, neural network, particle swarm optimization 1. Introduction In recent years the importance of anticipating and making accurate and fast reaction increases day by day. By understanding the different behavior, there are a series of strategic decisions, which are highly flexible and can be the slightest change your environment to adapt organizational standpoint. Greatly reduce the analysis of morphological complexity and will determine risk managers to error and a specific pattern for future decisions. Failing to recognize the environment is inevitable decision, even successful managers have this-such wrong. Factor that separates the successful from non-successful director, the wrong decision and the effect of their wrong decisions. Morphological analysis according to the saves space, can detect impossible cases and Guide Director. Using analysis of morphological complexity of the problem reduced and can adopted more structured decisions. By combining the two terms of morphology, environmental factors and internal factors all aspects of a business in the plastic injection industry can be checked. Plastic injection industry environment is quite vague and morphological analysis made by the issues will be solved. Estimated cost is the key to starting any business. Manage costs and improve it known today as one of the main tasks of managers. By combining the two terms of morphology, environmental factors and internal factors all aspects of a business in the plastic injection industry be checked. Plastic injection industry environment is quite vague and morphological analysis made by the issues 239
res.ccsenet.org
Review of European Studies
Vol. 9, No. 1; 2017
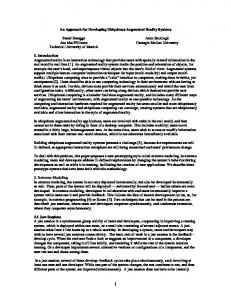
will be solved. Estimated cost is the key to starting any business. Manage costs and improve it known today as one of the main tasks of managers. In order to achieve continuous sustainability in business, companies have developed a series of new products and services in response to market demand and satisfy customer requirements using production and business, adequate the growth of the organization. As a result, for small or large companies launch new products is very difficult and there were many failures, even large companies have failed with a lot of resources, for example, 660 million dollars Texas Instruments lost home computer Microsoft business and IBM failed in the internet market. Rate products and business success needs understanding the cost and efficiency of spending. If the cost estimate done with higher accuracy witness of people to the efficiency of business and the future will be more (Wang et al., 2013). In recent years, many studies have been done on cost estimates and a large qualitative and quantitative methods are used. In order to achieve continuous sustainability in business, companies have developed a series of new products and services in response to market demand and satisfy customer requirements using production and business, adequate the growth of the organization. Generally, the methods fall into three categories: methods based on analogy: these techniques are to define and analyze the degree of similarity between new and old products produced by the company. Parametric method: this method costs expressed as an analytical function and includes a set of variables. Analysis Model: in this approach, cost estimates based on the analysis of the production process, product features and business. Propagation neural network and particle swarm optimization scenarios are an example of this (During et al., 2012). Cost estimates can be seen through a review of literature, in recent years the cost of a large number of businesses is estimated using Artificial Intelligence (AI). This technique is among the last generation of estimated tools to cost. The concept that is in the use of artificial intelligence estimates in costs estimation. 2. Background Research 2.1 Morphology Morphological Analysis (GMA) has been developed by Fritz Zwick. This method is used as a way to build and evaluate a set of multi-dimensional relations, non-quantifiable and can Complex Issues generally divided into the following three categories: The first type (dilemmas): do not have the proper definition or structure issues. The problem for you is unknown. The most complex issue is this group of issues. The second type (semi-structured problems): issues that are a form of defined structure. These types of issues are identified dimensions and states that form the perimeter of the structure. About how these variables interact and influence each other to have information by which the relation of each to be determined. The third type (such structured): the problem is well defined structure and has a specific solution. It does not have many issues need to be analyzed and its structure is clear. Morphological analyses in problems that belong to the first two categories are pays. The morphological analysis is used to structure the issues belonging to the first category and they will become the second type issues (Rightel & Weber, 1973). 2.2 Environment Environment includes all factors and variables, both indoor and outside of the organization which affect the life and success of the organization (Smith, 2007). Environmental forces, external variables that are not easily controlled and not easily manipulated by managers (Adbesy, 2006). 2.3 Particle Swarm Optimization Particle Swarm Optimization (PSO) is a population-based stochastic optimization technique, inspired by the social behavior of birds. Particle Swarm Optimization of Swarm Intelligence (SI) is derived from the study of living organisms as a group. In particle swarm optimization each member has little knowledge or lack of knowledge, but by interacting with each other or surroundings, they can do very complicated work as a group (Zhu et al., 2011). PSO algorithm or algorithms is global optimization that is made simple particles and the particles have local interacting with each other and with the environment (Mangat & Whyte, 2014). In applications based on PSO, each particle represents a solution through the search space. The position of a particle’s best position has been accessed by using the knowledge and the position of the particle is considered, becomes clear, that will be biased by knowledge of neighboring particles. When the best neighborhood, considers the swarm of particles, is told the best bit. How in optimize particle approaching the world according to the type of optimization problem FITNESS be measured by function (Trela, 2003). Figure 1 is indicated the general structure of PSO.
240
res.ccsenet.org
Review of European Studies
Vol. 9, No. 1; 2017
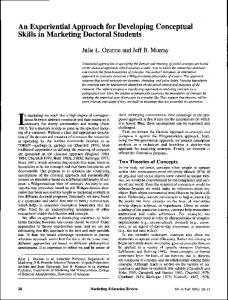
Figure 1. The general structure of PSO 2.4 Propagation Neural Network BP neural network theoretically can be any nonlinear continuous function under certain circumstances structured and weighted appropriately predict. This method uses descending gradient algorithm to minimize the mean square error between the actual output values, the output value of the network. This method Figure 2 shows in a three-layer neural network.
Figure 2. Structure of a three-layer propagation neural network General formula BP learning algorithm is as follows:
Here w represents the weight of the network, Δw increasing weight, E Function error output node of the network:
241
res.ccsenet.org
Review of European Studies
Vol. 9, No. 1; 2017
δk is the propagation of the error signal from the output layer in the inner layer, L the number of output neurons f and derived transfer function of the output layer and hidden. Is fixed-rate Learn network. This article will help in propagation neural network and particle swarm optimization in estimate the cost and determine its accuracy. Hence, these two methods are complementary to each other are, in such a way that each covers a different weaknesses. 2.5 Fuzzy Hierarchical Analysis Analytical Hierarchy Process is necessary to implement that decision on the issue at the highest level in the hierarchy of the ultimate goal. The second level of decision criteria options at the bottom of the lowest level of the hierarchy structure; The following criteria in mind the ultimate goal of paired comparisons as well as comparisons have been done a couple of options to the individual criteria. Top choices are detected from among available alternatives (Farahani & Asghar, 2007). 2.6 The Method Is Similar in Fuzzy Ideal Option TOPSIS are one of the multi-criteria decision-making methods that ranking m option with respect to the n criteria. Basis of working in this way, choose the option that is closest to the desired ideal answer, and the most distant from the ideal answer is negative. To involve the uncertainty of fuzzy logic in this method is used to form the first technique (San, 2010). According to this technique is the definition of a positive ideal solution and negative ideal solution. The ideal solution is a positive solution to criteria of maximum profit and minimum cost of the measures. The ideal solution is no solution that will benefit the criteria of minimum and maximum values of the cost. The ideal solution would best values for standard positive and negative is worst ideal solution consists of standardized data. The best option is the shortest distance from the positive ideal solution and the greatest distance to be a negative solution. Compared to other methods such as multi-criteria decision AHP, have less calculations and therefore can easily be used (Shahngy, 2008). 3. Methodology The proposed model: the nature of the study is development-applied research and method is descriptive-analytical. In the industry great efforts has been made to provide predictable cost model. There are many points in common between models. In Figure 3 the overall model study aid.
Figure 3. Overall research model
242
res.ccsenet.org
Review of European Studies
Vol. 9, No. 1; 2017
Stages of morphological analysis is as follows (Ritchie, 1998): 1) Determine the dimensions and parameters: at this stage findings the main of scenarios, that each with different scenarios dimension. 2) Define different scenarios possible for each dimension: at these stage scenarios and allocate the related to relevant dimensions. 3) Configure the morphological context: using the parameters of the procedural document in tables, field’s n-dimensional morphology is formed. The size of the field of morphology are formed based on the size and scale of states. When placed together the different dimensions. Provide a solution for complex problems. To each of these fields is said to be such a configuration. Table 1 is to determine the appropriate dimensions and each dimension’s size and scenarios and show how to create a morphological context of. The path shown in the table with blue shows a hypothetical field configuration. Table 1. Configuration of the field of morphology Dimension 1
Dimension 2
Dimension 3
Dimension 4
1.1 mode
1.2 mode
1.3 mode
1.4 mode
2.1 mode
2.2 mode
2.3 mode
2.4 mode
3.1 mode
3.2 mode
3.3 mode
3.4 mode
4.3 mode
4.4 mode
4.1 mode 5.1 mode
1) Cross Compatibility Assessment (CCA): the next step morphological analysis, a reduction in the problem space arrangements may be configured in have fewer internal consistency with each other. In other words, states are impossible to remove it and in “the answer” to the problem is reached. The complex arrangements with internal consistency, called CCA. In the morphology three types compatible are considered including: Adapts perfectly logical (are the contradictions that arise from the nature of the concept); Experimental limits (experience has shown limitations exist between concepts); Normative limit (restrictions caused by moral or political grounds, etc.). Table 2 shows a matrix A. Table 2. Cross compatibility assessment Dimension A
Dimension B
Mood
A1
B1
-
A2
Dimension B B1
B2
C2
C3
C4
C5
X
C1
-
C2
K
X
C3 C4 C5
X K
D1 Dimension D
C1
B2 B3
Dimension C
Dimension C B3
-
K
D2
K
D3 D4
X -
X
X
For example, in Table 2 dimension the A1 from A to B3 of dimension B mode has no internal consistency. 2) Evaluation of the results of morphological analysis: in the end, using special software morphological analysis (MA/Carma) can choose one or more dimensions related to different modes as input. Consider other cases as
243
res.ccsenet.org
Review of European Studies
Vol. 9, No. 1; 2017
proportional output to the input on the different aspects to (Hossein & Amir, 2013). Since the morphological analysis is a method that can solve obscure issues, complex, non-quantitative and models. Research in fields such as new product development, development of new services and technologies used prediction, because the development of new products and services is a multidimensional issue which is vague, unclear and non-quantitative (Eim & Chow, 2013). After the various business scenarios possible through environmental compliance and internal morphology was obtained two areas; among the possible scenarios within an enterprise’s premier business mode by fusion method FAHP-FTOPSIS rating is selected. In principles of hierarchical fuzzy weighting and ranking is done with the first technique. In another interview to determine the criteria and sub-criteria ranking of different scenarios with experts, industry takes place within the organization. Figure 4 shows general steps to select superior organizational standpoint. In fact, the dominant organizational stand points are different types of business expansion.
Figure 4. Proposed framework research to select the best possible business Business was selected in the previous step. At this stage business is estimated to cost superiority that all steps show in Figure 5.
244
res.ccsenet.org
Review of European Studies
Vol. 9, No. 1; 2017
Figure 5. Research proposed framework for estimating the cost 4. Data Analysis and Results In this review, first by the semi-open interview set of dimensions and forms can be obtained. This collection of 11 interviews with industry experts for plastic injection, which has two parts. The Dimension and states of the external environment changes and different scenarios, adopt different business strategies of industry experts that show specific reactions. Then identify the dimension and scenarios will be discussed within the organization. Researchers have identified environmental and internal factors; governing relations have identified these factors. During the calculation and application of the morphology of Sweden with fellow researchers have been necessary. After obtaining the opinion of experts, the economic environment has been achieved. Finally, according to industry experts will be asked to determine their own internal environmental factors. During this process, morphological analysis by eliminating the possible scenarios, commerce and industry experts helps to make a more accurate decision. The other part of the Dimension and positions within the organization. In the face of external environmental conditions, connoisseur industry makes the necessary changes to it. In other words, there are two areas of morphology: one of the other changes is related to environmental factors and internal factors that can be attributed to environmental factors your specific scenarios. In fact, the two are complementary, and combining these two geomorphological final answer to the individual. Researchers have identified opinion of experts in economic and environmental scenarios in the medium-term future gain an intuitive understanding of the future.
245
res.ccsenet.org
Review of European Studies
Vol. 9, No. 1; 2017
Then ask industry experts when considering future situations and scenarios within your organization identify. According to interviews and reviews of research has come to set the dimensions and environmental conditions Table 3 shows the complex factors. Table 3. Environmental factors morphological analysis Move consumerist customer towards plastic products
International sanctions
Quality view the price
Customs rules
Changes in currency price
Demography
Associations and guilds
In the capital goods
Lifting of a ban on the product parts
The trend toward quality
Improve laws to the importer of the product
Increase the exchange value of money and the government
Moving towards an aging population
Classroom assistant and fixing price by them
To the basic and essential goods
The removal of sanctions in the short term
The trend toward lower prices
Improvement of legislation in favor of the exporter
Move to the young population
Classroom assistant and price fixing by them
To the daily consumer goods
The overall long-term sanctions relief
Reasonable balance between price and quality
The combined population (the lack of high population changes)
Non-cooperative and lack of fixing price by them
The luxury goods
The removal of the export ban
Currency devaluation and the government Currency devaluation and lack of government Increase the exchange value of money and not public
Non-cooperative trade and lack of price fixing by them
In this part of the inter-organizational factors determined. These states are different; according to industry experts of different environments is one of these methods to work. Table 4 identifies a set of factors and conditions and all environmental factors and internal plastic injection industry in Iran. Table 4. Organizational factors morphological analysis The trend toward new Given to the customer
The way in product innovation
The move towards new product development
Long-term credits
Continuous innovation
The move to develop new services
Short-term credits
Innovations season
Need to know
Production conditions
product development or expansion of new services
Updated globally Technical knowledge
The need for high crop diversity
Outdated Technical knowledge
Need to diversify least Products One and the same product for a long time
Tends to be both (of new services and new product development)
Lack of innovation
Given that there are 7 dimension environment and 5 dimension within the organization, each dimension has several modes, display all the compounds the situation impossible and why, using morphological analysis on the subject of good practice. Then, the Cross Compatibility Assessment (CCA) is made, at this stage, the number of possible arrangements in space configuration issue fewer internal compatibility with each other is reduced. With regard to the structure, the morphology Sweden for researchers defined three types of incompatibility between couples is investigated, which include: “-” means optimal compatibility, “K” means the adjustment is possible (fully optimized) and “X” means the impossibility, and incompatibilities. CCA matrix and scenarios related to all aspects of row and column matrix is provided by relation high degree of compatibility with all scenarios are evaluated for a couple. 246
res.ccsenet.org
Review of European Studies
Vol. 9, No. 1; 2017
CCA matrix scenarios involving them in all aspects and is offered in rows and columns matrix. The compatibility of all scenarios using top-pair is evaluated. For this purpose, each pair is considered independent state, and relations between the two checked that provides three modes, K and X. When two other cases examined in relation to each other not to interfere in the comparison between the two will be considered independent. The Cross Compatibility Assessment (CCA), with regard to the relationship between each pair of states, limited space arrangements may be the answer. This arrangement relative to each other Darnd.hal internal consistency of each person having the screen may scenarios CAA-CARMA can be acquired from the external environment. This internal consistency of each other, respectively. Now any person in possession of this screen may scenarios CAA-CARMA can be acquired from the external environment. Then, according to the possible scenarios and specify the internal logic of the organization. In the plastic injection industry surveys carried out and the results show morphological analysis. With the opinions of experts and using morphological analysis of environmental conditions in the medium-term future can be predicted in Figure 6.
Figure 6. The mood selected environmental Figure 6 states according to industry experts finally chose four ways to expand business; in fact, their input is classified within these four methods. According to industry experts divided moods and aspects of the environment moods and modes Dimension organization within the following categories, each of which is originating from a particular perspective. In Figure 7, each of the four methods listed separately. No. 1 on the top left side, right above No. 2, No. 3 and No. 4 down bottom left right.
Figure 7. The method of business expansion
247
res.ccsenet.org
Review of European Studies
Vol. 9, No. 1; 2017
Researcher covers the morphology weakness in identifying the most appropriate. The output of morphology is obtained, but cannot find the most suitable. The second interview was conducted again with 11 industry experts, factors that different approaches to business rankings are obtained. In fact, different business approaches to these factors ranked. Fifteen obtained factors that have fulfilled them in four separate categories. At first these were industry experts who have reached eighteen numbers. After further review three of these factors were removed and the remainder was classified in four groups. This categorization has been done by the method of grounded theory. These factors are derived from the method of grounded theory that includes: 1) the encoded, 2) concepts, 3) compare the proposition that the propositions main criteria and sub-criteria are concepts. Figure 8 reflects these factors.
Figure 8. Set criteria and sub-criteria Using weight FAHP criteria and sub-criteria weights are shown in Table 5. Table 5. Final weight matrix criteria and sub-criteria Component
The final decisive weight components
Customer service
0.066
Dependent client Nations
0.069
Barriers to Entry
0.052
Devour old product
0.056
Time-to-market
0.051
Access to resources
0.062
The availability of technology
0.068
Operating costs
0.068
Market volume
0.061
Profitability
0.075
Growth potential
0.053
Competitive Advantage
0.07
Related experience
0.071
Initial operating costs
0.094
248
res.ccsenet.org
Review of European Studies
Vol. 9, No. 1; 2017
Facilities available
0.084
Comment of causation and causal effects
The final decisive weight components
Executive views
0.243
Market view
0.249
Operational
0.259
Perspective
0.249
Ranking business scenarios using TOPSIS indicates that the business Mood (4) CC larger than others and as a premier business Mood is selected. The results are given in Table 6. Table 6. Ranking of options Rank
CC
Distance to the negative ideal
distance to the positive ideal
Options
Row
3
0.173
0.695
3.327
A1
1
4
0.152
0.611
3.419
A2
2
2
0.174
0.699
3.328
A3
3
1
0.194
0.779
3.24
A4
4
Using FAHP-FTOPSIS to the conclusion that the method of business expansion (4) than the other superior, and in the second place of business expansion (3), the method of business expansion (1) and finally (2) there is a method of business expansion. The method of business expansion over the medium term future most adaptable and has the top spot in the rankings achieved. Weakness morphological analysis ranking methods is that the researcher is covered by FAHP-FTOPSIS method. Using the integrated method of particle swarm optimization and cost estimates for the propagation neural network and cost model is presented. In the second, cost factors related to the business taken and 7 major factors in the cost estimate as follows: 1) size, 2) model and size of the device, 3) device formats, 4) number of workers, 5) raw material costs, 6) equipment, 7) electrical equipment. In this article, there were 77 groups and 54 groups of training data. Training data make up 70 percent of all data. The remaining 23 groups of test data included. 7 input variable costs for input neurons and one neuron for exit, the output neuron is in fact the cost of business. The number of hidden layer neurons is achieved by trial and error. Variables as input costs and output costs as if the matrix is in a file format EXEL data network. To improve performance over the network, was designed because the only way to determine the number of hidden layers, the number of hidden layer neurons as well as the type of function, testing it. Finally, according to the results obtained, in order to avoid falling into the trap of local optimal training should rate (learning rate) chose to be suitable, why researcher training rate to 4.0 hidden layer and output layer learning rate to put 2.0. This convergence is improved. Activation function hyperbolic tangent is to estimate the cost. MSE, RMSE, and dispersion coefficient of the regression error data separately for training, testing and the calculated data-to be; Then outlines the results of which will be discussed. The overall topology of the neural network is shown in Figure 9.
249
res.ccsenet.org
Review of European Studies
Vol. 9, No. 1; 2017
Figure 9. Neural network related to the cost of business expansion The low coefficient of error reflects the accuracy of this method and represents the subject. This method than other studies is very low error rate. This method can help industry experts with high accuracy and low error rates; estimate the cost of various businesses. Figure 10 shows the network accurately predicts the cost for training is given. In Figure 10, section A, indicating compliance on the value of output is concerned. Figure 10, Section B, near the outlet indicates the network. The diagonal axis of the graph, closer and accumulate, the output values to actual values, closer. In Figure 10, section C, the amount of training data shows an error. In Figure 10, section D, indicated widest variety of educational data for each error histogram. The errors in the network, reducing the output data of the target data is obtained. According to this chart, the variables to zero, the closer they are, the margin of error is pretty small and reaches zero. As, shown in Figure 10, Section B, 39 data with fewer errors than 0.01, which is located in 72.2 percent of the data in this area are error, the error rate indicates high accuracy data training. 8 data error coefficient between 0.01 to 0.02, is the share of 8-14 percent. 0.02 is only 7 have a high error, which actually contains 13% of the data. Evaluate the performance of different models by factors R2 and RMSE is possible. Of the indicators in such a way that the R2 to the number and RMSE to zero, is near a model will have better performance. To evaluate the accuracy of the data and calculate the error rate calculated by the neural network was used in two ways the coefficient of determination R and RMSE. RMSE equal error rate based on 0.011527 and R is equal to 0.99977.
Figure 10. Training data (A), data and training (B), the error rate training data (C), histogram data error rate training (D)
250
res.ccsenet.org
Review of European Studies
Vol. 9, No. 1; 2017
Figure 11 shows the accuracy in predicting network cost for data testing. In Figure 11, section A, indicating compliance on output values are concerned. Figure 11, section B, is near the outlet of the real data indicates the network. In Figure 11, section C, shows the error rate testing data. In Figure 11, section D, indicative of the error of training data for each histogram. In the case of the test data, 21 data errors are less than 0.05, the data indicate the test. In other words, 91.3 percent and only 7.8 percent consider data within the data are out of this range which contains 2 data. RMSE equal error rate based on 0.036171 and R is equal to 0. 9977.
Figure 11. Test data (A), regression testing data (B), the data error rate testing (C), histogram data error rate testing (D) Figure 12 shows the accuracy of the projected cost for the entire data network. In Figure 12, section A, indicating compliance on output values are concerned. Figure 12 sections B shows, near the outlet of network actual values. In Figure 12, section C, the error rate of the data shows. In addition, Figure 12, section D, indicated the error rate of data for each histogram. The most important part outlines the cost model, the entire data is data that 75 percent of data error less than 0.05 to 97.4. Data out of this range is the only one of the above error is 0.1. Figures 12 to 13 can check and see details. Error value based on RMSE equal to 0.022 and R is equal to 0.99916.
Figure 12. Overall data (A), total regression data (B), the data error rate (C), total error rate histogram data (D) Cost model and the overall relationship between form factors Figure 13 that experts can thereby accurately estimate the cost to do so. The weight of the hidden layer and output layer with W2 is marked with W2 activation function, hyperbolic tangent function that f2 and f2 forms.
251
res.ccsenet.org
Review of European Studies
Vol. 9, No. 1; 2017
Figure 13. Estimated cost model 5. Conclusions and Recommendations In this paper, a model was designed by using morphological analysis and application MA/Carma that make a decision in the plastic injection industry more logical and easier. This method taking into account the high levels of flexibility tried to delete impossible scenarios and decision-making easier. In fact, with accurate predictions about the future and the correct choice of organizational standpoint, it becomes clear business orientation. Businesses today in the plastic injection industry are classified into 10 groups. Among the businesses of the two businesses have the ability to move on to consider article, which includes: 1) kitchenware, 2) printing and packaging. These two types of business have potential within them and within your enterprise are due to the ability to change the internal states of the organization. The two businesses are in need of new technology. For example, in dairy packaging containers thinner and more quality requires innovation and new technology. Because high elegance sanitary and kitchen appliances, only technology and devices on plastic injection is responsive to it. In these two types of business there is a great variety of products as well as customer and market tends is more variety. While the business such as packaging of agricultural products, pipe fittings, pipe and sewage, drinking water and irrigation industries traditional, modern drip and this capability cannot be seen. Due to the downturn in the housing and real estate businesses, pipe fittings, pipe and sewage, drinking water and building large-scale industry there is not chance in the medium-term future. Building high level of market acceptance of products should also be considered, a few percent of the market tendency to use these products in their structures in the medium-term future. Studies suggest that in the medium-term future to move toward large-scale production of plastic building still has not found its place in the market and the customer’s mind. The two businesses need to innovate continuously, or at least quarterly. According to industry experts, most likely easing of sanctions the day, with the opening of markets and move towards competitiveness, innovation position in plastic products is undeniable and these two businesses have potential. According to forecasts, conditions customs move to the importer and it destroys the economic feasibility of production of the device, of course, not the only reason that makes it impossible to produce. In fact, the lack of updated knowledge and inability to compete with foreign ones that are built with the same quality but lower price than they offer, it makes it impossible. Research shows only point where the manufacturer has comparative advantage is the production of custom and special. Today, credit is important to the customer in all businesses and customers tend towards long-term credits. All of these factors are within the organization in kitchenware and printing and packaging businesses. Industry, society and the country’s fundamental economic and Dutch disease keeps selling crude. According to estimates of the costs and creating the high-tech industry is in an important place. In this paper, using seven variables to estimate the cost of business in the plastic injection industry-propagation neural network integrated approach and particle swarm optimization are discussed. The results of the implementation of neural network and particle swarm optimization indicate an estimate cost of R2 RMSE 2.2 to 99.8 predictable. Also, according to the results of the 7 variables used as input costs for anticipated costs are two factors: 1) Size of Location, 2) Model and size of the device is as the most important variables influencing the estimation of costs. In this model, the optimal parameters Particle Swarm Optimization for Neural Network will be selected. This is to reduce the problems associated with set parameters and reduce the margin of error of cost. Neural network based on particle swarm optimization can accelerate network convergence rate. Many of the problems associated with artificial neural networks specification hidden nodes; the number of hidden layers and the learning rate is covered by the method used in this research. The results are satisfactory; the result is obtained of a low
252
res.ccsenet.org
Review of European Studies
Vol. 9, No. 1; 2017
coefficient of error. Also, due to the high dynamics, having a pattern, network topology, weights and conditions of the layers can also be predicted future conditions. References Adebisi, Y. (2006). Essential Marketing Management (1st ed.). Lagos: Gilgal Publication. Duran, O., Maciel, J., & Rodriguez, N. (2012). Comparisons between two types of neural networks for manufacturing cost estimation of piping elements. Expert Systems with Applications, 39(9), 7788-7795. https://doi.org/10.1016/j.eswa.2012.01.095 Farahani, R. Z., & Asgari, N. (2007). Combination of MCDM and covering techniques in a hierarchical model for facility location: A case study. European Journal of Operational Research, 176(3), 1839-1858. https://doi.org/10.1016/j.ejor.2005.10.039 Im, K., & Cho, H. (2013). A systematic approach for developing a new business model using morphological analysis and integrated fuzzy approach. Expert Systems with Applications, 40(11), 4463-4477. https://doi.org/10.1016/j.eswa.2013.01.042 Mangat, V., & Vig, R. (2014). Novel associative classifier based on dynamic adaptive PSO: Application to determining candidates for thoracic surgery. Expert Systems with Applications, 41(18), 8234-8244. https://doi.org/10.1016/j.eswa.2014.06.046 Ritchey, T. (1998). General Morphological Analysis A general method for non-quantified modeling. Adapted from the paper “Fritz Zwicky, Morphologie and Policy Analysis”. 16th EURO Conference on Operational Analysis, Brussels. Ritchey, T. (2003). MA/Casper–Advanced computer support for morphological analysis. Ritchey, T. (2005). Wicked Problems. In Structuring Social Messes with Morphological Analysis. Royal Institute of Technology in Stockholm. Rittel, H. W., & Webber, M. M. (1973). Dilemmas in a general theory of planning. Policy Sciences, 4(2), 155-169. https://doi.org/10.1007/BF01405730 Smit, P. J., Cronje, G. J., Brevis, T., & Vrba, M. J. (2007). Management Principles: A Contemporary. In Edition for Africa. Cape Town: Juta. Sun, C. C. (2010). A performance evaluation model by integrating fuzzy AHP and fuzzy TOPSIS methods. Expert Systems with Applications, 37(12), 7745-7754. https://doi.org/10.1016/j.eswa.2010.04.066 Trelea, I. C. (2003). The particle swarm optimization algorithm: Convergence analysis and parameter selection. Information Processing Letters, 85(6), 317-325. https://doi.org/10.1016/S0020-0190(02)00447-7 Wang, H. S., Wang, Y. N., & Wang, Y. C. (2013). Cost estimation of plastic injection molding parts through integration of PSO and BP neural network. Expert Systems with Applications, 40(2), 418-428. https://doi.org/10.1016/j.eswa.2012.01.166 Yu, F., & Xu, X. (2014). A short-term load forecasting model of natural gas based on optimized genetic algorithm and improved BP neural network. Applied Energy, 134, 102-113. https://doi.org/10.1016/j.apenergy.2014.07.104 Zhu, H., Wang, Y., Wang, K., & Chen, Y. (2011). Particle Swarm Optimization (PSO) for the constrained portfolio optimization problem. Expert Systems with Applications, 38(8), 10161-10169. https://doi.org/10.1016/j.eswa.2011.02.075 Zwicky, F. (1969). Discovery, invention, research through the morphological approach. Copyrights Copyright for this article is retained by the author(s), with first publication rights granted to the journal. This is an open-access article distributed under the terms and conditions of the Creative Commons Attribution license (http://creativecommons.org/licenses/by/4.0/).
253