Forward slices are smaller than backward slices David Binkley Loyola College Baltimore MD 21210-2699, USA
[email protected]
Mark Harman King’s College London Strand, London WC2R 2LS, UK
[email protected]
Abstract
The paper presents a theoretical argument to explain why forward slices are expected to be smaller than their backward counterparts and provides empirical evidence that this theoretical result applies in practice. Unfortunately, defining what a ‘typical’ slicing criteria depends upon too many factors and is too subjective to form the basis of a scientific study. In order to cover a wide range of possible definitions of what might constitute ‘typical’, two sets of slices are considered:
This paper presents evidence from two empirical studies which show that forward slices will tend to be smaller than backward slices and discusses the importance of this result for work on source code analysis and manipulation. The difference in forward and backward slice size distributions stems from the way in which control dependence and data dependence affect slice size. The paper explains this claim in detail and supports it with empirical evidence. The empirical evidence comes from a further study which uses a restricted form of slicing that isolates the effects due to control and data dependence. This study shows that it is the inherent difference between forward and backward control dependence that leads to the difference in slice size distributions for forward and backward slicing. The results from all three empirical studies are shown to be strongly statistically significant.
1. Slices over all possible criteria, and 2. Slices over direction specific criteria. These two general categories form a workable approximation to ‘typical’ criteria and furthermore form a set of criteria that are at least guaranteed to be meaningful (and, perhaps, likely to feature in many applications of slicing). The first category of direction independent criteria simply includes slicing on all statements in each program. The second category of direction specific criteria includes input formal parameters and input global variables used in a function, for which forward slices are taken, and the output function value (return value) and output global variables defined by a call to the function, for which backward slices are taken. They are termed ‘direction specific’ because it is only interesting to slice in one direction. Procedure inputs and outputs make natural candidates for ‘typical’ slice criteria. It would be expected that the resulting set of slices would form a reasonable cover of the procedure’s functionality and that each slice would be meaningful. Although it is difficult to claim that these sets are ‘typical’, it is, at least, possible to say that they represent a large sample of the set of all meaningful criteria, and that they are sampled without experimenter bias. These two sets of slicing criterion considered bound (above and below) what might be considered as the range of plausible choices for a set of typical slicing criteria. That is, it is not possible to consider a larger set than ‘all possible slicing criteria’ so this clearly provides an upper bound on the set of ‘typical’ criteria. However it might be too large
1 Introduction This paper is about the nature of control and data dependence and the way in which it impacts upon the distribution of slice sizes. The proposition at the heart of the paper and for which statistically significant empirical evidence is presented can be summarised as follows: “For a large class of programs, the distribution of forward slices will contain a significantly larger proportion of small slices when compared to the distribution of backward slices.” The focus of the study was static, syntax preserving slicing applied to a variety of programs written in the C programming language. This claim requires some explanation: Does it have theoretical justification? Does it apply in practice in real engineering situations? What is meant by the term ‘typically’? 1
and include so many atypical criteria that the results become skewed. Taking account of this possibility, the set of all ‘direction specific’ criteria forms a lower bound, in the sense that any application of slicing is likely to allow for slicing on the input formals and globals to a procedure and the output formals and globals from the procedure. In addition to the traditional interprocedural slices for each criteria, two kinds of specialised slices are considered. These deal with, respectively, the effect of control dependence in isolation and the effect of data dependence in isolation. Specialised slices allow the effects of control and data dependence to be considered separately and independently of one another and, thereby, facilitate investigation of a central claim that the cause of the difference between forward and backward slice sizes is control dependence. In total, over 5 million slices and 4.5 million specialised slices were constructed from 45 programs, consisting of an aggregate of just over one million executable lines of code. Individual programs ranged in size from a few hundred lines of code to a hundred and fifty thousand lines of code. Slices constructed from these programs provide data for two empirical studies. Data from which support the hypothesis that forward slices are typically smaller than backward slices: 1. The first study considers direction independent slicing criteria (that is, all possible slicing criteria). It shows that, over the set of all possible slicing criteria, the expected size of a forward slice is smaller than that of a backward slice. These results are shown to be statistically significant. Specialised slices are then used to investigate the cause of the size difference. The results show that the cause derives from the effects of control dependence. Once again, statistical analysis shows that these results are strongly significant. 2. The second study considers direction specific criteria. It presents evidence that forward slices, constructed for inherently ‘forward’ criteria are smaller than backward slices constructed for inherently ‘backward’ criteria. These results are shown to apply over all possible direction specific criteria and also over the distribution of average slice sizes (per procedure) for each of the four direction specific criteria. Once again, statistical tests reveal that these results are strongly statistically significant. The rest of this paper is organized as follows: Section 2 presents the theoretical motivation for the hypothesis that forward slices should turn out to be smaller than backward slices, over large distributions of slices size data, while Section 3 presents some of the implications of this result for source code analysis and manipulation. Section 4 outlines the experimental setup used to establish the empirical evidence supporting the hypothesis. Section 5 presents the
D
A B
C
Slice on: Forward Backward
A 4 1
B 1 2
C 2 2
D 1 3
Sum 8 8
Ave 2 2
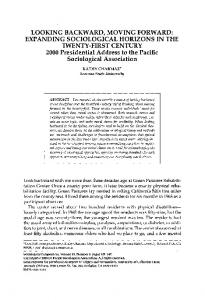
Figure 1. Average slice size over all vertices is identical for forward and backward slicing. results of the empirical study over non-directional criteria, focusing on the influence of control dependence upon slice size distributions. Section 6 presents the results of the empirical study over directional criteria, showing that, for what one might think of as reasonable criteria, the results are equally strong, if not stronger. Section 7 considers internal and external threats to the validity of the empirical results and Section 8 concludes.
2 Proposition: Forward Slices are Smaller than Backward Slices Forward and backward slicing are dual operations. Thus, if statement v is in the backward slice taken with respect to statement u then u is in the forward slice taken with respect to v. This duality follows from the dependence graph definitions [18], because u ∈ backward-slice(G, v) and v ∈ forward-slice(G, u) both imply a path of dependence edges from u to v. A simple counting argument based on this symmetry shows that, for a given graph, the average size of all static backward slices is the same as the average size of all static forward slices. This is illustrated by the graph shown in Figure 1. However, this symmetry does not mean that the distribution of slice sizes for forward and backward slicing will be necessarily identical. Figure 1 shows this too; the distribution of forward slice sizes is {1, 1, 2, 4} while for backward slices it is {1, 2, 2, 3}. Although the sum of slice sizes and the number of slices must be identical for forward and backward slicing, there is no reason for the distributions to be identical. In fact, there is reason for the distributions to be different: observe that in a typical dependence graph, control dependence tends to be “tree like” rather than graph like. Thus, the motivation for the hypothesis that forward slices are smaller comes from the effect control dependence structure is expected to have on the distribution of slice sizes. The tree like structure of control dependence comes from the structure of block structured programming languages, in which the nesting of control structures is reflected in the tree shape of control dependence, producing a hierarchical control dependence graph; a tree-like graph. For example, consider the simplified control flow examples shown at the top of Figure 2. The nesting of decision constructs (looping and conditional statements), nat-
if p then if q then if r then S1 else S2 else S3 else S4 while p do begin ... if a ... ... if b ... ... if c ... ... end
p q
S4
r
S3
S1
S2
p a
b
c
Figure 2. Standard control constructions give rise to tree–like control dependence graphs
urally give rise to a hierarchical, tree–like control dependence graph. For the first example, the forward slice size distribution is {7, 5, 3, 1, 1, 1, 1} while the backward slice size distribution is {1, 2, 3, 4, 4, 3, 2}. Both have a sum of 19, with a total of 7 slices, but the forward distribution contains small slices. Similarly, for the second construct (the while loop), the forward slice size distribution is {4, 1, 1, 1}, while the backward slice size distribution is {1, 2, 2, 2}. Thus, in theory, a typical forward slice ought to be smaller than a typical backward slice. That is, if one were to construct many slices from the procedures of a program, then one would find that the distribution of slices tended to have more smaller forward slices and more larger backward slices. Of course, for the average slice size to be the same, there must be a few large forward slices as can be seen in the figures of Section 5. Fortunately, these tend to be uninteresting slices (as the data from the second experiment shows). They occur primarily when slicing on vertices near the entry to the PDG (e.g., the main loop of a search function).
3 Implications for Source Code Analysis and Manipulation Work Program slicing has received significant attention as a possible supporting technology for a wide variety of software engineering applications. Interestingly, in all of these applications, it is backward slicing that is used, rather than its dual, forward slicing. There are several surveys of slicing techniques, applications and variations [4, 8, 14, 17, 29]. All of these surveys confirm that the overwhelming majority of previous work on program slicing has been concerned with backward slicing and its applications. However, in some of these applications, forward slicing could also be used. For instance, in program compre-
hension, backward slicing explains how a variable comes to have the value it does, while forward slicing explains how the variable is subsequently used. Forward slicing may therefore find application in work on program comprehension. In pursuing such an application, the results presented in this paper for direction-specific criteria (which correspond to likely program comprehension criteria) are particularly encouraging. Forward slicing is also useful in impact analysis, because it can be used to determine the size of ripple effects [9]. Unfortunately, the impact of a typical change is hard to assess because most of the accumulated understanding of slicebased dependence is based on results from backward slicing. Studies of backward slice size indicate that a typical backward slice may be as much as a third of the program [6]. However, these results cannot be extended to forward slicing. Fortunately, the picture for forward slicing appears to be more rosy; the impact of software changes may not be as large as believed. For researchers in source code analysis and manipulation, the results presented here may also be useful in suggesting or justifying research into forward slicing and its use in tools for analysis and manipulation. For example, the authors’ hypothesis is that forward slices are smaller than backward slices because of the difference between control and data dependence. This claim is supported by the evidence presented in the paper. However, it remains a conjecture that the reason for the difference in control and data dependence lies in the typical use of structured styles of programming. This conjecture remains to be proved. If true, it suggests that dependence can be used to give an semantic understanding of the impact of unstructuredness. This might provide more precise and useful measurements of unstructuredness than mere counts of unstructured statements. For backward slicing, many different paradigms and criteria have been studied. For example, amorphous and conditioned forms of slicing. By contracts, for forward slicing, the landscape of research is considerably more barren. The results presented here suggest that it may be worthwhile considering amorphous and conditioned forms of forward slice.
4 Experimental Setup The study concerns 45 C language programs that range in size from 563 to 167,478 lines of code (LOC). Three programs were obtained from the European Space Agency (ESA), while the remaining 42 consist of publicly available utilities and application programs. The data was collected by taking forward and backward slices of each program’s System Dependence Graph (SDG) [18]. In this study, slice size, and thereby the proportion of a procedure that is in a slice, is measured by
counting vertices of the dependence graph, rather than lines of code. Only vertices that represent executable code are counted; thus, vertices which relate to the internals of the SDG are excluded. The most frequently excluded vertices represent global variables. This is important because, in some cases (notably with programs that make heavy use of global variables), there are a significant number of vertices representing globals. Roughly speaking, counting vertices that represent executable code corresponds to counting non-comment, non-blank, executable lines of code. However, it also takes into account issues such as side effects and multiple-statement lines of code, since these produce multiple SDG vertices. Counting vertices provides a more precise and consistent measure given the wide variety of programs and coding styles. The data collected includes the effects of three speed– versus–precision choices regarding calling contexts, structure field expansion, and pointer analysis. For calling context and structure fields, which have a substantial effect on slice size [6, 19], the most precise option was chosen. The algorithm is fully context sensitive and structure fields are always expanded, so that individual fields of a structure are effectively treated as separate variables. The choice of points-to algorithm can also have a sizeable impact upon slice size [2, 21, 23, 24, 25]. Unfortunately, neither context sensitive [10, 27, 30] nor flow sensitive pointer analyses [11, 15, 20] scale to the size of the programs considered in this study. The algorithm used for pointer analysis was a variant of Andersen’s [1], which is almost as fast as Steensgaard’s algorithm [28], but often more precise. Previous results [5, 6, 7] indicate that this algorithm provides a good compromise between scalability and precision. The slices of PDGs constructed in the experiment are interprocedural in that transitive dependences are tracked through procedure calls. However, for a slice beginning in procedure P , the resulting slice size includes only elements from P . In particular, as noted in Section 7, this means that the results apply only to applications where the procedure is the typical unit of abstraction and for which the set of statements in a particular procedure form the slices of interest. Such a situation arises in many slicing applications, such as measurement [3, 22, 26], testing [16] and comprehension [12, 13]. In total 1,145,169 backward and 1,145,169 forward slices were computed for the first study. In the second study, the total number of input parameters was just over 1.8 million, consisting of 35,431 formal parameters and 1,775,520 global variables. These forward specific criteria produced a further 1,810,951 forward slices. The total number of output parameters was a little over 1.3 million, con-
sisting of 12,696 formal (result) parameters and 1,305,016 global variables. This, in turn, produced a further 1,317,712 backward slices. Thus, in total, 5,419,001 slices were constructed over the union of direction specific and direction independent criteria. In addition, control slices and data slices were taken for the direction independent criteria. This produced an additional 4,580,676 control and 4,580,676 data slices. Several statistical techniques are used in the interpretation of the data gathered during the study. Pearson’s linear correlation, the Mann-Whitney test, and the KolmogorovSmirnov test. Pearson’s linear correlation is used to construct quantitative models of the data. Such correlations measure linear associations between variables. The output is a correlation coefficient, reported as the value R, and the coefficients of a linear model. The statistical significance of R can be summarized as 0.8 - 1.0 strong association, 0.5 0.8 moderate association, and 0.0 - 0.5 weak or no association. All three tests report p-values, which represent the significant level of the result. These scores are interpreted as follows: p < 0.05 is a significant result and p < 0.01 is a highly significant result. A Mann-Whitney test provides a non-parametric comparison between the means of two data sets (slice size distributions in this case). Because the test is non–parametric, the underlying distribution need not be normally distributed. A Kolmogorov-Smirnov test compares the Cumulative Distribution Functions (CDFs) of two data sets (using the a Mann-Whitney test). A CDF is constructed in a non-parametric manner; thus, no default distribution shape is assumed. For the slicing data presented herein, a point at (x, y) on a CDF means that y% of the slices include up to x% of the procedure. Thus, the point at y = 0.50 represents the median slice size. For example, looking ahead to Figure 7b, 50% of all forward slices (the top line) have size less than or equal to about 42% of the procedure, while 50% of all backward slices (the bottom line) include less than or equal to about 72% of the procedure. In each case, there was at least one slice which included everything and one which included essentially nothing. Therefore, the CDFs always start at (0, 0) and reach (100, 100). However, the more the graph ‘bows out’ to the right, the more larger slices dominate the distribution. These visual observations are quantified statistically using the Kolmogorov-Smirnov test.
5 Results for Direction Independent Criteria This section and the next report results from two experiments designed to test the hypothesis that backward and
(a) Normal Slices
(a) All Slices
(b) Control Dependence Only Slicing
(b) Control Dependence Only Slices
(c) Data Dependence Only Slicing
(c) Data Dependence Only Slices
Figure 3. Forward (faint) and Backward (bold) slice size distributions over all criteria
Figure 4. Differences in Forward and Backward slice size distributions over all possible criteria.
forward slices have different distributions. The experiment described in this section considers the direction independent criteria. The data, which include data for control-only and data-only slices, illustrate the difference in the distributions. To begin with, Figure 3a shows the results for all possible slices constructed for all possible criteria. To help draw out the effect of control dependence, Figure 3b shows the results for all possible slices using only control dependence in slice construction and Figure 3c shows the results for all possible slices using only data dependence in slice construction. In all three figures, the backward slice distribution is shown in bold, while the forward slice distribution is shown unboldened. Furthermore, the size of a slice is normalised to the (percentile) proportion of the procedure which is in the slice. This removes the dominating effect of large procedures. Similarly the frequency is shown as a (percentile) proportion of all slices in the distribution. Thus, a point at (x, y) indicates that y% of the distribution of slices consist of slices which include x% of the procedures from which they are constructed. These results indicate that there are many more small forward slices than backward slices. The results also give evidence to support the claim that the difference is due to control dependence. The forward and backward slice size distributions for data-only slices are almost identical, as Figure 3c shows. However, the forward and backward dis-
tributions for control only slices are markedly different, as Figure 3b shows and this is carried over into the distributions for normal slicing (which considers control and data dependence), as shown in Figure 3a. Figure 4 shows the differences between forward and backward slice distributions from Figure 3. Here, the bar for each x-axis value shows the difference between the number of backward slices that contain x% of the procedure and the number of forward slices that contain x% of the procedure. Therefore, bars which tend positive indicate regions of the distribution in which backward slices predominate, while bars which tend negative indicate regions of the distribution in which forward slices predominate. As can be seen, forward slices predominate at the extreme left of the distributions (corresponding to small relative slice sizes) while backward slices predominate towards the right (corresponding to larger relative slice sizes). The effect is most notable for control dependence only slices, which carries over to the graph for dependence in general. In contrast, the effect, if indeed there is one, is much smaller and appears random for data dependence only slices. These figures provide visual evidence that support the hypothesis that forward slices are typically smaller than backward slices. However, to provide more rigour, a statistical analysis of the distributions was conducted. Fig-
ure 5 shows R values for linear models comparing the six distributions {forward, backward} × {data–only, control– only, data–and–control}. All models have p values less than 0.0001, indicating that they are statistically significant. R values greater then 0.800 indicate a strong linear correlation and are shown in bold. The remaining values all involve the distribution of backward control slices except the correlation between forward control slices and backward slicing. This outlier comes from the effect control dependence has on backward slicing. Squaring these values provides the percentage of the variation in one distribution explained by the other. For example, on the high side, 99.8% (0.9992) of the variation in the distribution of forward data slices is explained by the distribution of backward data slices. On the low side, 39.4% (0.6282) of the variation in the distribution of forward control slices is explained by the distribution of backward control slices.
6 Results for Directional Slicing Criteria This section presents results for direction specific slicing criteria. As explained in Section 2, the average over all slices is the same for forward and backward slicing. This need not be so for the direction specific criteria, due to differences between the input flow into a procedure and the output flow back from the procedure. Thus, two sets of results are presented: the results for slice size distributions over all slices and the results for the distributions over averages (per procedure). Direction specific criteria are constructed in terms of a procedure’s formal parameters and the global variables that the procedure transitively defines and/or uses. For formals, a backward slice is constructed with respect to the function’s return value, while a forward slice is taken with respect to a formal’s initial value. Similarly, a backward slice is taken with respect to a global’s final value, while a forward slice is taken with respect to the global’s initial value.
6.1 Results over All Directional Criteria First, Figure 6 shows the distribution of relative slice sizes. Figure 7 shows the associated Cumulative Distribution Functions (CDFs). Since these slices are constructed from four different categories of slicing criteria, each distribution consists of a different number of slices. As in the previous section, the frequency (y-axis) shows the percentage of slices that contain x% of a procedure’s vertices. Thus, a bar of height y at point x represents the fact that y% of all slices include x% of the procedure. For both formal and global parameters, the backward slices on output parameters (shown in Figures 6a and 6c) tend to be larger (higher bars occur towards the right of the
distribution) than those for forward slices on input parameters (shown in Figures 6b and 6d). This characteristic is particularly notable for global parameters. The CDFs for formal parameters (Figure 6a and Figure 6b) are shown in Figure 7a. Here the mean for backward slicing is 0.588, while for forward slicing it is 0.387. The Kolmogorov-Smirnov test reports a p-value less than 0.0001, indicating a highly significant difference between these two distributions. The Mann Whitney test reports that the distribution means differ (p < 0.00001). Together these tests imply that for formals backward slices are bigger. This difference is statistically significant. The CDFs for globals (Figure 6c and Figure 6d) are shown in Figure 7b. Here the mean for backward slicing is 0.664, while for forward slicing it is 0.435. The Kolmogorov-Smirnov test reports a p-value less than 0.0001, indicating a highly significant difference between the two distributions. The Mann Whitney test reports that the distribution means differ (p < 0.00001). Together these tests imply that for globals backward slices are bigger. This difference is statistically significant.
6.2 Results for Average per Procedure Directional Slice Size This section considers results obtained for the distributions of average slice size per procedure for the direction specific criteria. As illustrated in Figure 1, the average slice size per procedure is identical for forward and backward slicing over all vertices of the PDG. However, for direction specific criteria, this is not the case. To see why, consider Figure 1 once more. Suppose, instead of A, B, C and D being internal vertices of the procedure, that only B and C are internal and that A is a global input vertex and that D is a global output vertex. The average forward slice size on global inputs is therefore simply the size of the forward slice on A (which is 4). The average backward slice size on global outputs is simply the size of the backward slice on D (which is 3). The distributions of slice sizes averaged over each procedure are shown in Figure 8. The associated CDFs are shown in Figure 9. In these size distributions, the slices for each procedure are aggregated. Therefore, a bar of height y at point x denotes the fact that y of the 18,887 procedures studied have slices containing an average of x% of the procedure. In this case, the x-axis is relative (size expressed as a percentage), while the y-axis is absolute (since the total number of procedures is the same in all cases). Numerically, for formal parameters, the mean for backward slicing is 0.588, while for forward slicing it is 0.428. For global variables, the mean for backward slicing is 0.596, while for forward slicing it is 0.296. For both, the Kolmogorov-Smirnov test reports a p-value less than
Pearson Distribution Comparisons backward slices backward control “slices” backward data “slices” forward slices forward control “slices” forward data “slices”
backward slices 0.952 0.856 0.876 0.749 0.846
backward control “slices” 0.952 0.759 0.790 0.628 0.740
backward data “slices” 0.856 0.759 0.982 0.981 0.999
forward slices 0.876 0.790 0.982 0.957 0.978
forward control “slices” 0.749 0.628 0.981 0.957 0.985
forward data “slices” 0.846 0.740 0.999 0.978 0.985 -
Figure 5. R values from Pearson linear models comparing the size distributions. Bold values indicate a strong linear correlations.
(a) Backward slices on output formals
(b) Forward slices on input formals
(c) Backward slices on output globals
(d) Forward slices on global inputs
Figure 6. Distribution of relative slice sizes. In each chart the x-axis shows size–as the percentage of a procedure’s vertices in a slice–and the y-axis shows the percentage of slices having this size. 0.0001, indicating a highly significant difference between the two distributions and the Mann Whitney test reports that the distribution means differ (p < 0.00001). Thus for both formals and globals, when averaged over each procedure, backward slices are bigger. This difference is statistically significant. In conclusion, there is strong evidence that, for average slice sizes per procedure, the forward slices constructed for forward slicing criteria, yield smaller slices than backward slices constructed for backward slicing criteria.
only two potential threats to validity need to be considered. These are threats to internal and external validity. External validity, sometimes referred to as selection validity, is the degree to which the findings can be generalized. In this experiment, three external threats exist. First, it is possible that the selected programs are not representative of programs in general and thus results from the experiment do not apply to ‘typical’ programs. Second, nonblock structured languages might not have the same controldependence effect. Finally, the results may not apply to different kinds of slices.
7 Threats to Validity
Considering 43 subject programs helps to mitigate the first concern. The diversity of these programs makes it more likely that the conclusions which can be made about the techniques generalize to wider classes of programs.
With any empirical experiment, it is important to consider threats to validity. In the absence of human subjects,
(a) Formals
(b) Globals
Figure 7. Cumulative Distribution Functions for results over each slice. In both cases, the upper CDF curve is constructed from the forward slice size distribution, while the lower curve comes from the backward slice size distribution. The y axis shows the proportion of the distribution cumulatively considered, from 0.0 through to 1.0. The x axis shows the relative size of slices as a percentage of the procedure from which they come.
(a) Backward slices on output formals
(b) Forward slices on input formals
(c) Backward slices on output globals
(d) Forward slices on global inputs
Figure 8. Distribution of average (per procedure) relative slice sizes. In each chart the x-axis shows the percentage of a procedure’s vertices in a slice and the y-axis shows how many procedures have this percentage. It might also be argued that the results would not generalize to a non-block structured language, because the argument in Section 2 is based on observations concerning nested control flow constructs. The results are presented in terms of slices constructed for a single procedure. Though the slices are interprocedural (because slicing has to consider transitive effects of called procedures), in all cases the slices are expressed as
proportions of the procedures from which they are constructed. For applications where the procedure is the architypal abstraction mechanism and where slices are constructed from a procedure, these results are directly applicable. It is however possible that the results do not hold for applications of slicing for which the slice across the whole program is required. Internal validity is the degree to which conclusions can
(a) Formals
(b) Globals
Figure 9. Cumulative Distribution Functions for averages per procedure. In both cases, the upper CDF curve is constructed from the forward slice size distribution, while the lower curve comes from the backward slice size distribution. The y axis shows the proportion of the distribution cumulatively considered, from 0.0 through to 1.0. The x axis shows the relative size of slices as a percentage of the procedure from which they come.
be drawn about the causal effect of the independent variable on the dependent variable. In this experiment, the only serious threat comes from potential for faults in the slicers. To mitigate this concern, mature slicing tools were used. These tools have been throughly tested over a period of more than ten years. This reduces the impact that implementation faults may have on the conclusions reached regarding dependence analysis.
the space program and Chris Morel for his statistical guidance. Kathy Newstead assisted with presentation. Dave Binkley is supported by National Science Foundation grant CCR0305330 (Amorphous Program Slicing). Mark Harman is supported, in part, by EPSRC Grants GR/R43150 (FORTEST), GR/R98938 (TeTra), GR/S93684 (ASTRENET) and GR/T22872 (CONTRACTS) and by two development grants from DaimlerChrysler.
8 Summary
References
This paper has presented results concerning distributions of slice sizes for forward and backward slices, constructed according to a number of direction–specific and direction– independent slicing criteria. Using these data, the paper shows that forward and backward slice sizes distributions are not mere mirror images of one another. Rather, the results show that forward slice size distributions contain significantly more smaller slices than backward slices. The paper also considered control and data dependence separately, giving empirical results which support the claim that this difference in slice size distribution is due to the effects of tree–like control dependence graphs. The finding is important, because most existing work on slicing has focussed exclusively on backward slicing. The results presented herein indicate that forward slicing is worthy of more study and that its exploitation may be more fruitful than backward slicing.
9 Acknowledgements The authors wish to thank GrammaTech Inc. for providing CodeSurfer, Gregg Rothermel for providing
[1] L. O. Andersen. Program Analysis and Specialization for the C Programming Language. PhD thesis, DIKU, University of Copenhagen, May 1994. (DIKU report 94/19). [2] D. C. Atkinson and W. G. Griswold. Effective whole– program analysis in the presence of pointers. In Proceedings of the ACM SIGSOFT 6th International Symposium on the Foundations of Software Engineering (FSE-98), volume 23, 6 of Software Engineering Notes, pages 46–55, New York, Nov. 3–5 1998. ACM Press. [3] J. M. Bieman and L. M. Ott. Measuring functional cohesion. IEEE Transactions on Software Engineering, 20(8):644– 657, Aug. 1994. [4] D. W. Binkley and K. B. Gallagher. Program slicing. In M. Zelkowitz, editor, Advances in Computing, Volume 43, pages 1–50. Academic Press, 1996. [5] D. W. Binkley and M. Harman. An empirical study of predicate dependence levels and trends. In 25th IEEE International Conference and Software Engineering (ICSE 2003), pages 330–339, Portland, Oregon, USA, May 2003. IEEE Computer Society Press, Los Alamitos, California, USA. [6] D. W. Binkley and M. Harman. A large-scale empirical study of forward and backward static slice size and context sensitivity. In IEEE International Conference on Software Maintenance (ICSM 2003), pages 44–53, Amsterdam,
[7]
[8]
[9]
[10]
[11]
[12]
[13]
[14]
[15]
[16]
[17] [18]
[19]
Netherlands, Sept. 2003. IEEE Computer Society Press, Los Alamitos, California, USA. D. W. Binkley and M. Harman. Results from a large–scale study of performance optimization techniques for source code analyses based on graph reachability algorithms. In IEEE International Workshop on Source Code Analysis and Manipulation (SCAM 2003), pages 203–212, Amsterdam, Netherlands, Sept. 2003. IEEE Computer Society Press, Los Alamitos, California, USA. D. W. Binkley and M. Harman. A survey of empirical results on program slicing. Advances in Computers, 62:105–178, 2004. S. E. Black. Computing ripple effect for software maintenance. Journal of Software Maintenance and Evolution: Research and Practice, 13:263–279, 2001. D. Callahan. The program summary graph and flowsensitive interprocedural data flow analysis. ACM SIGPLAN Notices, 23(7):47–56, July 1988. J.-D. Choi, M. Burke, and P. Carini. Efficient flow-sensitive interprocedural computation of pointer-induced aliases and side effects. In ACM, editor, Conference record of the Twentieth Annual ACM SIGPLAN-SIGACT Symposium on Principles of Programming Languages: papers presented at the symposium, Charleston, South Carolina, January 10–13, 1993, pages 232–245, New York, NY, USA, 1993. ACM Press. A. Cimitile, A. De Lucia, and M. Munro. Identifying reusable functions using specification driven program slicing: a case study. In Proceedings of the IEEE International Conference on Software Maintenance (ICSM’95), pages 124–133, Nice, France, 1995. IEEE Computer Society Press, Los Alamitos, California, USA. A. Cimitile, A. De Lucia, and M. Munro. Qualifying reusable functions using symbolic execution. In Proceedings of the 2nd working conference on reverse engineering, pages 178–187, Toronto, Canada, 1995. IEEE Computer Society Press, Los Alamitos, California, USA. A. De Lucia. Program slicing: Methods and applications. In 1st IEEE International Workshop on Source Code Analysis and Manipulation, pages 142–149, Florence, Italy, 2001. IEEE Computer Society Press, Los Alamitos, California, USA. M. Emami, R. Ghiya, and L. J. Hendren. Context-sensitive interprocedural points-to analysis in the presence of function pointers. ACM SIGPLAN Notices, 29(6):242–256, June 1994. M. Harman and S. Danicic. Using program slicing to simplify testing. Software Testing, Verification and Reliability, 5(3):143–162, Sept. 1995. M. Harman and R. M. Hierons. An overview of program slicing. Software Focus, 2(3):85–92, 2001. S. Horwitz, T. Reps, and D. W. Binkley. Interprocedural slicing using dependence graphs. ACM Transactions on Programming Languages and Systems, 12(1):26–61, 1990. J. Krinke. Evaluating context-sensitive slicing and chopping. In IEEE International Conference on Software Maintenance (ICSM 2002), pages 22–31, Montreal, Canada, Oct. 2002. IEEE Computer Society Press, Los Alamitos, California, USA.
[20] W. Landi and B. G. Ryder. A safe approximate algorithm for interprocedural pointer aliasing. In SIGPLAN’92 Conference on Programming Language Design and Implementation (PLDI’92), SIGPLAN Notices, pages 235–248, July 1992. Published as SIGPLAN’92 Conference on Programming Language Design and Implementation (PLDI’92), SIGPLAN Notices, volume 27, number 7. [21] D. Liang and M. J. Harrold. Efficient points-to analysis for whole-program analysis. In O. Nierstrasz and M. Lemoine, editors, ESEC/FSE ’99, volume 1687 of Lecture Notes in Computer Science, pages 199–215. Springer-Verlag / ACM Press, 1999. [22] H. D. Longworth, L. M. Ott, and M. R. Smith. The relationship between program complexity and slice complexity during debugging tasks. In Proceedings of the Computer Software and Applications Conference (COMPSAC’86), pages 383–389, 1986. [23] M. Mock, D. C. Atkinson, C. Chambers, and S. J. Eggers. Improving program slicing with dynamic points-to data. In W. G. Griswold, editor, Proceedings of the 10th ACM SIGSOFT Symposium on the Foundations of Software Engineering (FSE-02), pages 71–80, New York, Nov. 2002. ACM Press. [24] A. Orso, S. Sinha, and M. J. Harrold. Effects of pointers on data dependences. In 9th IEEE International Workshop on Program Comprehension (IWPC’01), pages 39–49, Toronto, Canada, May 2001. IEEE Computer Society Press, Los Alamitos, California, USA. [25] A. Orso, S. Sinha, and M. J. Harrold. Incremental slicing based on data-dependences types. In Proceedings of the IEEE International Conference on Software Maintenance (ICSM 2001), pages 158–167, Florence, Italy, Nov. 2001. IEEE Computer Society Press, Los Alamitos, California, USA. [26] L. M. Ott and J. J. Thuss. The relationship between slices and module cohesion. In Proceedings of the 11th ACM conference on Software Engineering, pages 198–204, May 1989. [27] E. Ruf. Context-insensitive alias analysis reconsidered. ACM SIGPLAN Notices, 30(6):13–22, June 1995. [28] B. Steensgaard. Points-to analysis in almost linear time. In Conference Record of the 23rd ACM SIGPLANSIGACT Symposium on Principles of Programming Languages (POPL’96), pages 32–41, St. Petersburg, Florida, Jan. 1996. ACM Press. [29] F. Tip. A survey of program slicing techniques. Journal of Programming Languages, 3(3):121–189, Sept. 1995. [30] R. P. Wilson and M. S. Lam. Efficient context-sensitive pointer analysis for C programs. ACM SIGPLAN Notices, 30(6):1–12, June 1995.