example Mars transportation system architecture model is used to demonstrate ..... those elements is influenced by the interplanetary transfer geometry, the ...
Framework for the Parametric System Modeling of Space Exploration Architectures D.R. Komar1 NASA Langley Research Center, Hampton, VA, 23681 Jim Hoffman2, Aaron Olds,3 and Mike Seal4 Analytical Mechanics Associates, Inc., Hampton, VA, 23666
This paper presents a methodology for performing architecture definition and assessment prior to, or during, program formulation that utilizes a centralized, integrated architecture modeling framework operated by a small, core team of general space architects. This framework, known as the Exploration Architecture Model for IN-space and Earth-toorbit (EXAMINE), enables: 1) a significantly larger fraction of an architecture trade space to be assessed in a given study timeframe; and 2) the complex element-to-element and element-to-system relationships to be quantitatively explored earlier in the design process. Discussion of the methodology advantages and disadvantages with respect to the distributed study team approach typically used within NASA to perform architecture studies is presented along with an overview of EXAMINE’s functional components and tools. An example Mars transportation system architecture model is used to demonstrate EXAMINE’s capabilities in this paper. However, the framework is generally applicable for exploration architecture modeling with destinations to any celestial body in the solar system.
Nomenclature Acronyms ALSSAT
=
ATM CM COMET
= = =
Cx CxPrOS
= =
V V/TOF ECLSS
= = =
EDV EIO ERO ERV ES ESM ETI
= = = = = = =
1
Advanced Life Support Sizing Analysis Tool Architecture Trade Manager Crew Module Concept of Operations and Mission Event Tool Constellation (NASA) Constellation Propellant Options Study Delta-V Delta-V and Time-of-Flight Environmental Control and Life Support System EXAMINE Data Viewer Earth Insertion Orbit Earth Rendezvous Orbit Earth Return Vehicle Earth Surface EXAMINE Segment Model EXAMINE Trajectory Interface
EXAMINE
=
EXTRA gFOM gMSR
= = =
gTSM IMLEO Ispv JSC LaRC MAB MAH MAIO MAS MAV MDS MDV MISPP MPO
= = = = = = = = = = = = = =
EXploration Architecture Model for IN-space and Earth-to-orbit EXAMINE Trajectory Global Figure-of-Merit Global Mission & System Requirements Global Trade Space Manager Initial Mass in Low Earth Orbit Vacuum Specific Impulse Johnson Space Center Langley Research Center Mars Aero-Brake Mars Ascent Habitat Mars Ascent Insertion Orbit Mars Ascent Stage Mars Ascent Vehicle Mars Descent Stage Mars Descent Vehicle Mars In-Situ Propellant Production Mars Parking Orbit
Senior Aerospace Engineer, Vehicle Analysis Branch, Mail Stop E401. Senior Supervising Analyst, Software Development, 303 Butler Farm Road, Suite 104A. 3 Mission Analyst, Space Mission & Architectures Branch, 303 Butler Farm Road, Suite 104A. 4 System Integration, Space Mission & Architectures Branch, 303 Butler Farm Road, Suite 104A. 2
MPROV MS MSFC MSH MSP MSPS MSS MTH MTROV MTV MDI NTR
= = = = = = = = = = = =
Mars Pressurized Rover Mars Surface Marshall Space Flight Center Mars Surface Habitat Mars Science Payloads Mars Surface Power System Mars Surface Segment Mars Transfer Habitat Mars Tele-robotic Rover Mars Transfer Vehicle Model Definition Interface Nuclear Thermal Rocket
PMTMI RAD SAIF
= = =
sFOM SM sMSR
= = =
sTSM TEI TMI VBA
= = = =
Propellant Module for TMI Reference Architecture Data Systems Analysis Integration Framework Segment Figure-of-Merit Service Module Segment Mission & System Requirements Segment Trade Space Manager Trans-Earth Insertion Trans-Mars Insertion Visual Basic for Applications
I. Introduction
S
pace architecture definition and assessment is a fundamental process required in formulating programs to meet NASA strategic exploration objectives. System architectures, as defined in the NASA Systems Engineering Handbook, are the strategic organization of the functional elements of the system, laid out to enable the clear understanding of roles, relationships, dependencies, and interfaces between elements.1 In performing architecture definition, the system architects must develop at least one, but preferably multiple, concept architectures capable of achieving program objectives, and that each architecture concept involves specification of the functional elements (what the pieces do), their relationship to each other (interface definition), and the operations concept (how the various segments, elements, units, etc., will operate as a system when distributed by location and environment from start of operations to the end of the mission). Architecture assessment is the process of analyzing a given concept through trade studies or sensitivities in order to understand the system behavior. These processes, executed prior to or during program formulation, are mechanisms to define solutions that satisfy the objectives. However, as space exploration endeavors become more cost constrained and risk adverse, methods are needed to enable rapid execution of these processes so that space architects can evaluate a broader trade space for solutions that satisfy these tighter constraints. Table 1. Terminology for Architecture Organizational Hierarchy Description System Architecture
Strategic organization of functional elements Synonymous with segment-to-segment integration
Segment
Collection of functionally related elements Synonymous with vehicle, facility, or utility infrastructure
Element
Collection of subsystems that work together to perform a function Synonymous with module or stage
Unit
Additional instance of an element
Subsystem
Collection of components that work together to perform a function
Examples Mars Architecture, including Launch, Space Transfer & Surface Segments Mars Transfer Vehicle Mars Surface Segment Earth Return Vehicle Crew Entry Module Orbital Transfer Stage Surface Habitat Common Crew and Cargo Descent Stages Life Support Power, Thermal Control Propulsion
Architecture studies within NASA are typically conducted by distributed teams, each with a responsibility for a segment of the overall architecture. Reference architecture point designs are established and local trades and sensitivities are performed on the separate segments, incrementally and marginally improving them. Verification that the system design satisfies mission requirements is primarily accomplished in an ad-hoc fashion. No formal architecture integration model that interfaces directly with the various segment models is utilized. Rather, data from the segment teams is delivered to the integration team leader and compliance of the architecture performance
See Table 1 for terminology related to architecture organizational hierarchy used throughout this paper. 2 American Institute of Aeronautics and Astronautics
requirements is verified manually. The effort needed to perform updates, implement element design changes, fix errors or conduct assessments requires a time-consuming, re-execution of this distributed, manual process. The advantage of the distributed team approach is that the recognized experts are utilized directly in the design and that the advocacy for the design is enhanced through participation of the many distributed organizations. However, the approach must contend with the following limitations. First, reference point designs inherently limit the final solution to the local region of the trade space. As noted above, it is preferable to define multiple architectures that satisfy requirements. However, space exploration architecture trade spaces are extremely broad, composed of thousands of operational concept, element design, and technology variables. Given the sheer magnitude of the problem, “multiple” concepts cover an extremely small fraction of the possible solution space. By localizing trades around a reference design point the degree of improvement that can be achieved is limited because the trade space is so narrowly scoped and alternate ideas, concepts and approaches are not considered. Second, distributed teams (with their segregated models) have difficulty modeling the end-to-end system complexities and capturing the element-to-element and element-to-system interactions early in conceptual design. This limits the understanding of the architecture at a point in the design cycle when architecture changes are easily implemented (i.e., prior to establishing baseline architecture and element design requirements). Enabling a means to understand the influences of launch vehicle, spacecraft, space platform and surface system element design parameters on the overall system, as well as on each other, is needed to ensure a robust architecture design. In addition, these limitations tend to make the assessment process slow, cumbersome, and prone to errors, omissions, and modeling inconsistencies. An alternative methodology, utilizing a centralized, integrated framework of parametric models and operated by a small core team of general space architects, has the capability to execute the architecture definition and assessment process faster and more consistently. Thus, a significantly larger fraction of the trade space can be assessed in a given time enabling more ideas, concepts and strategies to be explored that satisfy a given set of objectives. Integration of parametric element sizing and performance models within the architecture-level framework provides the capability for rapid quantification of element-to-element and element-to-system influences and an overall improved understanding of the integrated system behavior. Disadvantages of this alternative methodology include failure to directly utilize the recognized experts in the design process and that the centralization of the study effort fails to gain stakeholder advocacy. However, these are significantly mitigated or eliminated if the recognized expert is utilized in the development, verification, and validation of the parametric models and if the framework is used to augment, rather than replace, the distributed team study approach. The distributed team approach used within NASA, with its advantages noted above, is held in high regard with stakeholders. However, as stated earlier, there are disadvantages to applying this approach early in program formulation. This paper advocates that the alternate, centralized methodology presented herein be used prior to and then in conjunction with the distributed team approach. As a study tool used early in program formulation, the alternate methodology can be utilized to survey the broad trade space and pursue new ideas, concepts and strategies. Results of these study efforts serve as a potential starting point for the distributed team process. During the early phases of the design, the centralized methodology augments the distributed team approach by providing integrated architecture verification, gap analysis, sensitivity studies and independent assessments. A computational and analysis framework using this methodology, known as the EXploration Architecture Model for IN-Space and Earth-to-orbit (EXAMINE), is presented in this paper. In addition to a description of EXAMINE and its functional modules, a demonstration of the framework’s use in defining a Mars mission architecture example will be provided. This example case was developed independent of any sanctioned NASA Mars study efforts for the purpose of framework demonstration only. Additional discussion will be dedicated to the use of the demonstration model to perform architecture sensitivity and gear ratio analysis.
II. EXAMINE Framework The EXAMINE framework, developed over the last 4 years at NASA Langley Research Center (LaRC), is a collection of Microsoft Excel© workbooks that utilize the inherent features of Excel© and its native programming environment Visual Basic for Applications (VBA). Utility programs, compiled separately, are also accessible from within the EXAMINE framework to perform graphical problem definition, to perform computations, and to initiate graphical visualization. As shown in Fig. 1, the EXAMINE framework consists of a workbook known as the Architecture Trade Manager (ATM), a collection of workbooks known as the EXAMINE Segment Model (ESM), and a separate tool known as the EXAMINE Data Viewer (EDV).
3 American Institute of Aeronautics and Astronautics
The ATM serves as the global system model used to define a given architecture, manage the data within the framework, and control global convergence of the architecture. The ESM is a collection of element parametric sizing models each capable of sizing launch vehicle stages, hypersonic cruise and accelerator vehicles, in-space transfer stages, lander stages, entry vehicles, transfer habitats, orbital platforms, surface habitats and other surface element types. The EDV is a graphical visualization tool available for interactively displaying and viewing mission phase and architectural element data. An EXAMINE Framework Architecture additional interface is provided to a NASATrade Manager LaRC data management framework known as (ATM) Systems Analysis Integration Framework 2 (SAIF). SAIF stores architectural element design data and interfaces with the strategic and campaign analysis toolsets that perform the life cycle cost analysis, architecture risk/reliability EXAMINE assessments, and campaign manifesting and Segment 3 optimization. Thus, through SAIF, architecture Models (ESM) solutions from EXAMINE are seamlessly EXAMINE acquired by the strategic and campaign analysis Data Viewer toolsets. Together these tightly integrated tools (EDV) are used to execute the architecture definition Systems and assessment process. Analysis Integration The EXAMINE framework is structured to Framework be hierarchical and modular. The hierarchical Figure 1. EXAMINE Framework system-segment-element structure allows the system-level ATM to govern the segment-level ESM’s in the fully integrated architecture model but still allow segment-level definition and assessment to be performed independent of the system model, if desired. The modular structure allows new ESM’s to be implemented within the ATM, as needed. This provides a high degree of framework scalability and facilitates model turnaround when reconfiguring the system-level ATM to work a new problem. The EXAMINE framework has been applied to support a variety of studies and analysis tasks. In support of NASA’s Exploration Systems Missions Directorate (ESMD), study applications include performance modeling for the Constellation (Cx) Propellant Options Study4 (CxPrOS) and the Directorate Integration Office Lunar Architecture Team study. Other tasks performed for Cx’s Analysis, Trades and Architectures project include: 1) Pareto sensitivity assessment to determine the parameters that drive the architecture; 2) gear ratio assessment to quantify the partial derivatives of element masses on all other elements and system metrics; 3) architecture performance sensitivity to mission requirements; 4) architecture performance verification and metric’s tracking; 5) program/project performance reserves assessment; and 6) trade space assessment to evaluate alternative architecture concepts and technologies. Demonstrated benefits of applying EXAMINE to these studies and tasks include early verification of integrated performance, identification of analysis needs, and identification of the influential, driving parameters relative to architecture performance margin. CaLV CLV LLV CEV LSS MTV MDV MSS MAV User-Defined
III. Architecture Trade Manager The ATM is EXAMINE’s global, system-level model that maintains a given architecture definition, manages data within the framework, and controls global convergence of the architecture. Since a primary input to any architecture construct is the concept of operations (ConOps), a user-friendly, graphical method to define the necessary mission phases and events for a given architecture is provided. Once the events are defined, a routine is executed that integrates these events, summing the time-based mission requirements (such as crew time and mission duration) for each element in the architecture. Although the nominal means to incorporate flight performance data (such as propulsive requirements and flight times) into the system model is direct input into lookup tables, an optional mission design and performance analysis capability is implemented that predicts these performance metrics in an end-to-end mission trajectory simulation. As illustrated in Fig. 2, the ATM workbook includes nine components that are in the form of either an Excel © worksheet or an offline application/tool: 1) Model Definition Interface (MDI) worksheet; 2) Global Trade Study Manager (gTSM) worksheet; 3) ConOps Definition Tool called iBAT; 4) ConOps and Mission Event Tool (COMET) worksheet; 5) EXAMINE Trajectory Interface (ETI) worksheet; 6) EXAMINE Trajectory (EXTRA) tool; 7) Delta-V and Time-of-Flight (V/TOF) Tables worksheet, 8) Global Figure-of-Merit (gFOM) Output worksheet; 4 American Institute of Aeronautics and Astronautics
Model Definition Interface (MDI)
Figure 2 - EXAMINE Framework Illustrated in N2 Diagram
5 American Institute of Aeronautics and Astronautics
Global Trade Study Manger (gTSM)
ConOps Definition Tool (iBAT) ConOps and Mission Event Tool (COMET)
EXAMINE Trajectory Tool (EXTRA) DeltaV & TOF Data Tables (V/TOF) Global Figure-of-Merit Output (gFOM) Global Mission & Systems Requirements (gMSR)
Segment Figureof-Merit Output (sFOM)
MTV
MDV
MAV
MSS
…
Segment Mission & System Requirements (sMSR)
EXAMINE Segment Model (ESM)
Segment Trade Study Manager (sTSM)
Figure 2. EXAMINE Framework Illustrated in N2 Diagram
EXAMINE Trajectory Interface (ETI)
EXAMINE Architecture Trade Manager (ATM)
ERV
Segment/ Element Subsystem Models EXAMINE Data Viewer (EDV)
and 9) Global Mission & System Requirements (gMSR) worksheet. A description of each of the ATM components follows with emphasis on the functionality necessary to manage all data within the architecture. A. Model Definition Interface The MDI worksheet is used to configure a global architecture problem by identifying all available segment models and creating elements not associated with a specific ESM. Data from the MDI is written to the gMSR module to update the configuration of the integrated model. A maximum of fifty elements are allowed for a given architecture, each with up to six units (i.e., additional copies of a sized element used within the reference architecture). B. Global Trade Study Manager The gTSM worksheet provides the user a centralized interface for defining architecture trade variables and ranges. Variable selection flags and controls are provided for executing sensitivity and trade studies using various VBA driver routines. The user can define any variable or parameter on the gTSM sheet, but must establish the appropriate linkages within Excel© and manage any input compatibility issues manually. Once defined, linked, and tested, the user can execute a single case or perform batch-type analysis on one or more independent variables using the routines provided. Since the ATM is the global driver model for EXAMINE, variables defined in the gTSM are typically related to architecture-level attributes such as architecture mission mode, architecture configuration, or performance requirement inputs. Segment and element design attributes are defined within the segment trade space manager (sTSM) in each ESM. Once the design variables are established within each of the segment models, the gTSM interfaces with each sTSM and segment/element level trades are performed within the context of the global, integrated architecture model. C. Concept of Operations & Mission Events EXAMINE’s concept of operations and mission event modeling capability includes the iBAT5 tool and the COMET interface worksheet. The COMET interface worksheet is the user interface for an embedded VBA routine used to determine the mission and system requirements for each element-unit from a sequential listing of mission events. This listing represents all events that define the architecture concept of operations from launch to landing, including event types such as launch, propulsive maneuvers, loiter time, flight time, docking, undocking, jettison, crew transfers, payload mass transfers, and propellant transfers. Each event type requires inputs that identify characteristics of that event. Manually entering the mission event sequence inputs on the COMET interface sheet is a tedious and inflexible process, especially when attempting to configure a new architecture or add events to an existing architecture. The iBAT tool was created to replace this process with one that was user-friendly. The iBAT tool is an interactive mission event sequencing tool that provides users with an intuitive interface for defining mission events and operations for used in the COMET and EXTRA tools. The iBAT tool allows the user to graphically construct a ConOps in a user-interface window that illustrates the movement of elements from a start of operations to the end of the mission. To create a mission concept using iBAT a user starts by defining waypoints. Waypoints are reference points in physical space used for purposes of celestial navigation and include all planetary bodies and orbits relevant to a desired ConOps. Existing elements can be inserted at any waypoint. Next, the user defines stacks by selecting the elements in a stack definition dialog. A stack is simply a collection of elements that exist together at the starting point of a path. For each defined stack, the user may create a path by dragging phase types into the graphical window. Phase types include launch, rendezvous, orbital operations, departure, transfer, deep space maneuver, flyby, arrival, orbital transfer, entry descent and landing, and surface operations. Three special phase types (dock, undock, and jettison) allow stack elements to be joined, split, or discarded. To facilitate the definition of events that occur in any one phase, each phase type has its own event phase definition dialog. By supplying the appropriate phase inputs and event parameters, the user can quickly define the phase. Details within a phase can be modified by either reviving the phase definition dialog or by editing fields within the Details Editor, a spreadsheet style interface window. Commonly used components, such as phases, stacks and missions, can be saved, edited and reused. Finally, iBAT helps in mission trade studies by allowing the user to copy and alter missions thus creating a collection of missions which define the trade space. A multiple mission export option then creates COMET and EXTRA input files for the selected missions.
6 American Institute of Aeronautics and Astronautics
D. Mission Design and Performance Analysis EXAMINE’s mission design and performance analysis modeling capability includes the EXTRA6 tool, the ETI worksheet and the V/TOF worksheet. EXTRA is an interplanetary mission design and performance optimization tool used within the framework for rapid assessment of mission opportunities and global optimization of mission performance. It has the capability to optimize planetary and interplanetary operations together, thereby allowing end-to-end missions to be designed from liftoff to touchdown. This capability is important for trajectories like those used for a crewed Mars mission which could involve placing elements in Martian orbit to be used at a much later date. The choice of the parking orbit for those elements is influenced by the interplanetary transfer geometry, the landing site, and the duration in orbit, all of which are modeled in EXTRA. Both high and low thrust trajectories can be modeled in EXTRA with multiple planetary flybys and deep space maneuvers. Ballistic arcs are parameterized by Lambert’s problem, and low-thrust arcs are modeled as exponential sinusoids which allow for a subclass of continuous, tangential thrust arcs to be quickly evaluated. Planetary operations include insertion, injection, ascent, descent, orbit transfer, and phased rendezvous. Insertion and injection can be modeled as one, two or three burn maneuvers. Orbits are modeled as ellipses, with circular orbits treated as a special case. EXTRA utilizes enumerative and optimization techniques to locate solutions within the design space. An enumerative, grid search algorithm can be selected to evaluate all possible solutions and present the trade space to the user. Alternatively, Differential Evolution,7 a successful global optimization routine for continuous variables, is used to optimize the desired objective function subject to a number of user definable constraints without relying on the user to provide an initial guess for the solution vector. If desired, the interplanetary transfers can be optimized independently, assuming ideal planetary operations. Additionally, both routines can satisfy user-defined, nonlinear constraints. The ETI worksheet serves as the user interface for EXTRA, although the majority of inputs for EXTRA are autogenerated by iBAT. This includes both mission phase and waypoint definition inputs. Additional inputs required by the user include departure and arrival date ranges, maximum departure and arrival excess hyperbolic velocities, and planetary entry angle constraints for each interplanetary transfer stack. In addition, surface waypoints such as launch and landing sites, require latitude and longitude inputs while planetary waypoints such as insertion and parking orbits require periapsis, eccentricity and inclination inputs. Upon completion of the EXTRA performance optimization, results are imported to the V/TOF tables. The V/TOF tables store all propulsive maneuver and loiter time (including both flight times and general loiter times) data for a given case. Each propulsive maneuver or loiter time event has a unique identifier such that COMET can look up the tabulated values. The V/TOF tables provide the default means to input delta-V and loiter/flight time data in EXAMINE. Thus, use of EXTRA to populate these tables is optional. Typically, this tabulated data comes from an offline source that pre-generated all of the required performance data for a given architecture construct. However, providing an optional mission design and performance analysis capability within the EXAMINE framework gives mission designers and space architects a “one-stop-shopping” capability for defining and assessing new missions and architectures. E. Global Figure-of-Merit Output The gFOM worksheet collects all output data for the integrated architecture model. This data is defined by the user and manually linked to the appropriate cells of the ATM. When EXAMINE is configured as an integrated architecture model, both global outputs calculated in the ATM and the segment outputs from the segment figure-ofmerit (sFOM) worksheets of each ESM are linked back to the gFOM worksheet. When the user utilizes one of the batch-execution routines from the gTSM module, data from the gFOM worksheet is output to a file in standard comma-separated variable (CSV) format so that the data file is readable by most standard plotting software. F. Global Mission & System Requirements The gMSR module calculates propellant requirements for each propulsive event, tracks the mass of each element for each propulsive event, and globally converges a given architecture. The gMSR also serves as the primary interface to the segment mission and systems requirements (sMSR) sheet in each segment model, containing the architecture data used for performance analysis and architecture element sizing. The majority of input data required on the gMSR is auto-generated from the MDI and COMET modules, resulting in little, if any, manual input by the user. The MDI and COMET modules provide the architecture setup and mission requirement data, including: 1) the crew and duration data for each element; 2) element-unit data for each propulsive event, including payload flags identifying which element-units are payloads and which element-unit 7 American Institute of Aeronautics and Astronautics
is performing a given propulsive event; 3) fuel cell status flags used to determine rate of consumable usage between each propulsive event; 4) mission elapsed time for each propulsive event used to determine element-unit boiloff and fuel cell consumable time increments; and 5) re-supply flags that identify what element-unit propellant is transferred from/to, what propellant type is transferred (fuel, oxidizer or both) and the waypoint location for the re-supply event. The segment models provides the gMSR additional inputs, including the reference propulsion data for each element, boiloff mass and fuel cell propellant consumption rates for each element-unit, and propellant re-supply quantity for each element-unit-waypoint. In addition, the element stage mass required is returned from each ESM and is used for convergence. Up to one-hundred sequential propulsive events are tracked on the gMSR worksheet. For each propulsive event, the payload element masses are summed to determine the net payload applied and the payload margin/reserves are added (at the user’s discretion) to determine the gross payload. The mass of each element-unit at the start of each propulsive event is calculated to provide an accurate, “up-to-the-moment” mass tracking, accounting for propellant consumption, boiloff, fuel cell consumables, and jettisoned/transferred mass changes up to the current event. The gross payload, along with the velocity requirement, specific impulse and propulsive element mass at the start of the event, are used to calculate propellant requirements for the element-unit performing the maneuver. Convergence of the global architecture is controlled on the gMSR sheet. Input options and multiple convergence routines are available that provide users the appropriate methods for solving a given integrated architecture problem. This includes an element-by-element mass converger, a user-definable variable converger, and a combined variableelement converger. Element convergence is obtained applying Newton’s method while the variable converger utilizes NLSYST,8 a standard Fortran library that has been re-coded in VBA to simplify utilization within EXAMINE. The gMSR generates phase and element summary report for converged architecture solutions. These reports are output in a format that allows the EDV to import them directly.
IV. EXAMINE Segment Model (ESM) The nature of architectural element sizing requires some elements to be close-coupled with other elements so that subsystems or components can be functionally allocated from element to element. Other elements do not require close-coupling as they simply are payloads of other elements. In determining the structure of the framework, the degree of modularization was an important consideration. Three approaches were assessed: 1) Integrate all elements within a single workbook model. 2) Integrate a small collection of elements in a segment model and integrate the architecture segment models at the ATM level. 3) Distribute each element to a separate workbook model and integrate the architecture element models at the ATM level. The final solution was to create a multi-element segment model for use in the EXAMINE framework. This decision represents a compromise between fully integrated element models within the ATM or fully distributed element models that are managed by the ATM. Rationale for this decision is that the close-coupling of element subsystems typically occurs within a segment rather than between segments. An example of this is the Apollo command and service module elements where the life support system oxygen and storage hardware, sized to support the command module’s crewed mission requirements, was functionally allocated to the service module element. The ESM is a collection of parametric performance and sizing tools and algorithms that enable users to model a variety of architectural element types. Typically, a given architecture problem employs multiple ESMs, as depicted in Fig. 1. Each ESM can size a maximum of five elements (in parallel), each with a maximum of six units, and has a standard interface that enables rapid and seamless data exchange with the ATM. Providing parallelized sizing within an ESM takes advantage of Excel’s© native iteration and convergence capability. The ESM is an evolutionary tool developed over the past decade but integrated into its current form over the past three years. In an effort to avoid re-inventing the wheel, existing NASA exploration launch vehicle and spacecraft sizing toolsets are selected as a starting point and physically integrated, along with in-house developed models, into the ESM to maximize modeling breadth, establish modeling consistency, and gain external acceptance. Specifically, JSC’s Envision9 tool, MSFC’s Mass Estimating Relationship Database10 and LVA11 tools, and LaRC’s AC-Sizer12 tools are chosen as the foundation for the ESM’s parametric sizing model. New modeling capabilities continue to be developed and integrated to enable modeling of new architectural elements or specific technologies. For example, significant effort over the past year was spent adding a surface habitat structure modeling capability.13 In order to support interplanetary mission design concepts, new subsystem models were developed and integrated into the ESM. This includes a bi-modal nuclear thermal rocket (BNTR) subsystem model,14 a Mars In-Situ Propellant 8 American Institute of Aeronautics and Astronautics
Production (MISPP) model,15 and interfacing the ESM with JSC’s Advanced Life Support Sizing Analysis Tool (ALSSAT)16,17 tool for performing closed-loop environmental control and life support system (ECLSS) sizing. In support of the CxPrOS, the space propulsion model was enhanced with an improved master equipment list4 and an improved model for predicting heat transfer into cryogenic tanks.18 Finally, the REFPROP19 toolset is utilized for predicting propellant properties, thus enabling an increased list of available propellants. As shown in Fig. 2, each ESM includes a segment Trade Study Manager (sTSM) worksheet, a segment Figureof-Merit (sFOM) Output worksheet, and a segment Mission & System Requirements (sMSR) worksheet. Each of these modules provides functions that support the ESM as well as serve as an interface to the ATM. The segment/element subsystems models, represented generically in Fig. 2, contain the subsystem sizing data and algorithms used for parametric design and analysis. The following sections discuss the function of each module, the interfaces with other modules in the ESM, and the interfaces with the ATM. A. Segment Trade Space Manager Similar to the gTSM, the sTSM provides a location for defining trade space parameters and ranges and provides the tools necessary for performing batch-execution sensitivity analysis or trade space assessment, but within the segment model. This approach allows segment-level trade studies, sensitivity analysis, and optimization to be performed independent of the global architecture, if desired. Driver tools for conducting performance trades and sensitivities, similar in function and form to the tools used in the gTSM, are available in the ESM for use in segment-level assessments. These toolsets are not required for use in a fully integrated architecture model. B. Segment Figure-of-Merit Output The sFOM module provides users with a standard interface for defining segment/element FOM output data. In an integrated architecture model, the sFOM data are linked back to the global FOM data sheet so that segment specific outputs can be collected at the global level. C. Segment Mission & System Requirements Similar to the gMSR, the sMSR is where critical mission-element inputs are located for elements of a given ESM. Propulsive events, crew-time, element duration and other mission requirement data are input, propellant requirements are calculated, and element masses are calculated and tracked for each event. The sMSR interface is linked back to the gMSR sheet in the ATM to feedback convergence data when operating within a fully integrated architecture model. D. Segment Subsystem Models In general, subsystem models and algorithms are either developed in-house or implemented from one of several sources. Together, these algorithms and methods are integrated into the appropriate ESM subsystem model and consistently formatted. Element sizing and mass properties algorithms are generally implemented in the ESM to allow the designer to pick-and-choose the appropriate algorithms and sizing methods for a given element type. The ESM can size launch vehicle stages, hypersonic cruise and accelerator vehicles, in-space transfer stages, lander stages, entry vehicles, transfer habitats, orbital platforms, surface habitat and other surface element types. Table 2a-c provides a listing of subsystem models within each ESM along with references to the original model, tool or dataset. Detailed description of these subsystem models are provided in the references listed in the third column of Table 2a-c. E. Miscellaneous Segment Input and Output Modules Several worksheet modules not illustrated in Fig. 2 are included in each ESM to provide necessary functionality and are discussed next. Each element has a dedicated, detailed sheet for bookkeeping mass, volume, power, and (optionally) longitudinal center of gravity. This functional breakdown is derived from reference 12 and directly supports the reference element sizing. Each ESM also utilizes a standard functional breakdown structure20 to bookkeep mass in a familiar format conducive to comparison with other tools. In addition, user definable mass, volume, or power breakdown structures can be easily implemented. The multi-unit capability for each element provided by the ESM requires that performance and sizing data be properly sorted, managed, and allocated to the proper element-unit. A dedicated data worksheet for each element determines the element-unit requirements and applies the data accordingly to reference element sizing. If multiple units exist for an element, only the driving (worst) case will size the element subsystems and components. For the 9 American Institute of Aeronautics and Astronautics
other units, the dry mass, as sized by the driving case, is used but the propellants, consumables, and crew accommodations required for that unit are based on the mission & system requirements for that specific unit. A method to import reference architecture data (RAD) for an existing element directly into the ESM is also provided to give the architect flexibility to assess the impact of utilizing existing elements within a new architecture construct. Two sheets provide this functionality: the RAD Input and RAD Output worksheets. The RAD Output worksheet collects useful reference data for each element, including element mass breakdown and subsystem data, and is exported to a text file. If the user chooses to input an element (i.e., utilize an existing element or one that has already been sized) this file can be imported back into the RAD Input sheet and propagated through the element model. As with the multi-unit capability, the dry mass of the imported element is used (and held constant) but the propellant, consumable, and crew accommodations data are scaled based on the specific element-unit requirements.
Table 2a. EXAMINE Subsystem Model Overview Subsystem Aerosurface Structure
Body Structure
Habitat Structure
Engines
Ascent Propulsion
LVA Interface Space Propulsion
Description Geometry, configuration and structural mass properties model for: Fixed wings Horizontal tails & canards Vertical tails Body flap Primary/secondary body and internal payload bay structure geometry and mass properties model for planetary entry & hypersonic airbreathing vehicles Geometry, mass properties & volume closure for vertical & horizontal habitat configurations, including: Primary structural shell Secondary structural components Floor systems, walls & windows Bulkheads, hatches Internal airlock/suitlock Docking & berthing provisions External porch Structural non-optimum Engine sizing & mass properties models for: Ascent rocket engine model with optional table lookup of >100 existing engines Scramjet flowpath, rocket- & turbine-based combined-cycle component sizing including inlets, turbines, thrusters, nozzles Propellant tank, feed & pressurization system sizing & mass properties model: Applicable to launch vehicle elements Extension to Body and Ascent Propulsion subsystem models to provide higher-fidelity structural sizing of launch vehicle element components OMS/RCS engine/thruster, propellant tank, feed & pressurization system sizing & mass properties model: Applicable to in-space vehicle elements Detailed equipment list REFPROP fluid properties Expanded propellant options to handle advanced propulsion technologies & configurations
10 American Institute of Aeronautics and Astronautics
References 10, 11, 12
10, 11, 12, 21
12, 13
10, 12
10
11 4, 9, 18, 19
Table 2b. EXAMINE Subsystem Model Overview Subsystem Nuclear Thermal Rocket
Mars In-Situ Propellant Production
Protection
Recovery
Avionics
Mechanical Power & Control
Electrical Power & Control
Thermal Control
Description Solid-core NTR sizing & mass properties model: Reactor core, containment vessel & shield sizing Thrust chamber, nozzle & feed system sizing Power generation via closed Brayton cycle power conversion system for bi-modal NTR application Propellant options include hydrogen, methane, carbon dioxide and water Propellant production facility sizing & mass property model: Methane & oxygen production from Mars atmosphere based on demanded production rate Seed hydrogen mass prediction Multiple CO2 acquisition methods Sabatier & water electrolysis processes Oxygen, water & buffer gas scavenging for ECLSS Vehicle protection parametric mass property models include: Aerosurface & body thermal protection system & insulation Base heat shield model Hypersonic aircraft active cooling Micro-meteoroid, orbital debris, surface ejecta protection Internal & external radiation protection model Vehicle recovery sizing & mass property models: Landing/takeoff gear for horizontal takeoff/landing vehicles Landing legs/skids for extra-terrestrial landing applications Miscellaneous recovery options for parafoils, parchutes, drogue chutes, airbags, flotation bags Component-level mass properties model: Command, control & data handling Communications Guidance & navigation Wiring & instrumentation Mechanical & fluid subsystem model: Auxiliary power & hydraulics systems Control surface & engine thrust vector control actuators Attitude control devices Range safety Electrical component sizing & mass properties model: Fuel cells (open-loop & regenerative) Photovoltaic solar arrays Batteries Nuclear reactors Power management and distribution TCS component sizing & mass properties model: Internal & external TCS fluid loops Radiators with optional heat pump Phase change heat rejection Fluid evaporator Heaters & passive insulation
11 American Institute of Aeronautics and Astronautics
References 14, 22
15
9
9, 10, 12
9
10, 22
9
9
Table 2c. EXAMINE Subsystem Model Overview Subsystem Crew Accommodations
Extra-Vehicular Activity
Environmental Control & Life Support System
External Elements
Description Table lookup structure employed provides users simple interface for defining mission-specific accommodation classes and requirements: Pre-defined accommodation classes Tables scale specific mass, volume & power requirements based on mission & system requirements. EVA model provides options for: Selectable airlock configurations Suits & spares Umbilical’s & support Tools & maintenance Additional airlock services ECLSS modeling options include: Open- and closed-loop air and water subsystem and consumables sizing Selectable technology options for: Air management subsystems Water management subsystems Solid waste management subsystems Temperature and humidity control subsystems Food and biomass subsystems Modeling of additional launch vehicle elements including: External tanks Hybrid rocket motors Solid rocket motors Auxiliary drop tanks External payload containers Launch vehicle shrouds
References 23, 24
9
9, 16, 17
10
V. EXAMINE Data Viewer (EDV) Overview An additional tool, known as the EXAMINE Data Viewer (EDV), graphically animates the end-to-end mission and allows the user to interactively visualize and interrogate the solution results. This capability was developed to provide a single tool that enables architecture performance data to be accessed and evaluated by users and customers. Three types of data are available to the user in the EDV: 1) mission trajectory data (from EXTRA); 2) element summary report (from each ESM); and 3) mission phase summary report (from the ATM). Outputs from the EXTRA trajectory optimization tool can be read by the EDV. As shown in the right half of Fig. 3, the results are displayed in a three-dimensional, interactive graphics window providing both solar system and planetary views. These views can be rotated and zoomed to any viewing angle. A DVD-type controller is provided for animating the trajectory in time. The user is able to browse trajectory data across time by monitoring a Dashboard display. Using the Phase View panel, a user may navigate directly to the phase of interest within a mission. The element summary report, output from each ESM and shown in the left half of Fig. 3, is displayed in a threepanel view for each element. The upper left panel displays available graphical images of the element. On the bottom left panel is a hypertext markup language (HTML) based description of the element. A hierarchical display, on the right in the element report window, provides a quick drill-down into the element-unit dry mass, wet mass, volume, and power breakdowns. Finally, a phase summary report is currently in development for the EDV. This report will provide a phase-byphase summary of the events for each phase and a mass summary of each stack at the start and end of each propulsive event displayed in graphical report views. Navigation from phase-to-phase is through a linked graphical illustration of the concept of operations developed in the iBAT tool (see Fig. 4).
12 American Institute of Aeronautics and Astronautics
Figure 3. EXAMINE Data Viewer Screenshot
VI. Example - Mars Mission A Mars mission architecture was selected to demonstrate the capabilities of the EXAMINE framework. It should be noted that this example case does not represent any current NASA study efforts. This independent modeling effort simply enables demonstration of the process used in EXAMINE to perform architecture definition and trade assessment. The basic mission used herein utilizes two pre-deployed missions in the 2035 Earth-Mars opportunity to preposition a cargo lander on Mars surface and a crew lander in Mars orbit. The crew mission begins at the start of the 2037 opportunity. Multiple Earth launches are required for each mission leg, thus multiple Earth orbit rendezvous (EOR) are required. Because the crew lander is pre-deployed to Mars orbit, the crew must perform a Mars orbit rendezvous (MOR) prior to descent to the surface. Thus, the basic mission mode used in this example is EOR-MOR. The following sections further describe the mission as well as the process used within the EXAMINE framework for performing architecture definition and assessment. A. Concept Operations The first step in modeling an architecture in EXAMINE is to develop the concept of operations. The operations concept does not address a complete exploration campaign. Rather, the operations concept is modeled to include only the mission events and architectural elements required to drive out the mission, system, and element sizing requirements. Elements defined for this model are shown in Table 3. For this example the Mars cargo and crew missions were modeled in iBAT and are graphically illustrated in Fig. 4. Two cargo mission legs are used to deploy mission assets to Mars before the crew arrives on the third leg. The first leg is a cargo-only mission where a Mars surface habitat (MSH) is delivered to Mars surface. TransMars insertion (TMI) is performed by the nuclear thermal rocket (NTR) stage, which is jettisoned and placed in a heliocentric disposal orbit. Upon Mars arrival, the MSH is aerocaptured into Mars orbit using the Mars aero-brake (MAB) element. The MSH, carrying provisions for the 500 day surface mission, then experiences Mars entry, descent and landing (EDL) to the designated surface location using an unpowered entry performed by the MAB and a terminal landing powered by the Mars descent stage (MDS). The second leg, also a cargo-only mission, delivers the Mars Ascent Vehicle (MAV), a MAB, and a MDS to Mars parking orbit (MPO). The MAV includes an empty Mars ascent stage (MAS), the Mars ascent habitat (MAH), 13 American Institute of Aeronautics and Astronautics
the Mars in-situ propellant production (MISPP) facility, and other payloads needed to support the surface mission. Following the TMI burn, the NTR is jettisoned and placed in a heliocentric disposal orbit. The MAV-MAB-MDS stack waits in MPO for the crew. The third leg delivers the crew, the Mars transfer habitat (MTH), and the crew module (CM) to MPO to rendezvous with the MAV. The NTR stage performs the TMI burn, drawing supplemental propellants from the TMI propellant module (PMTMI). Once Table 3. Segment and Element Models for depleted, the PMTMI is jettisoned Example Mars Architecture Model and the NTR-Truss-MTH-CM stack continues on to Mars. At Mars Segment Model Element Model arrival, the NTR stage performs a Earth Return Crew Module (CM) propulsive Mars orbit capture Vehicle (ERV) Service Module (SM) (MOC), and then rendezvous with the Mars Transfer Nuclear Thermal Rocket (NTR) MAV in MPO. The MTH carries Vehicle (MTV) TMI Propellant Module (PMTMI) provisions for both the 180 day PMTMI Truss Structure (Truss) outbound and 180 day inbound Mars Transfer Habitat (MTH) mission legs. Once the crew is Mars Descent Mars Descent Stage (MDS) transferred to the MAV, the MAB Vehicle (MDV) Mars Aero-brake (MAB) and MDS perform EDL, delivering Mars Ascent Mars Ascent Stage (MAS) the MAV to the designated landing Vehicle (MAV) Mars Ascent Habitat (MAH) site in close proximity to the MSH. Mars In-Situ Propellant Production (MISPP) The crew transfers from the MAV to Mars Surface Mars Surface Habitat (MSH) the MSH for the 500 day surface Segment (MSS) Mars Pressurized Rover (MPROV) mission. The MISPP facility begins Mars Tele-robotic Rover (MTROV) producing propellant for the MAV to Mars Surface Power System (MSPS) be used in the next crewed mission. Mars Science Payloads (MSP) Upon completion of the surface mission, the crew enters a fullyfueled MAV deployed on a previous rotation and ascends to rendezvous with the MTH. The crew transfers back to the MTH and the NTR performs the trans-Earth injection (TEI) burn. The crew performs a direct entry and landing upon return to Earth in the CM. The NTR-Truss-MTH stack performs an Earth flyby and is then placed in a heliocentric disposal orbit. Each of these mission legs, as illustrated in Fig. 4, requires two heavy lift Earth launches to deliver the payload to low Earth orbit (LEO). However, the actual number of launches may be more and will be driven by the required mass in LEO, the mass and volume of each payload, and the launch vehicle capability. Once the elements are sized and the architecture model is converged, an analysis of the payload manifesting can be performed. B. Mission Design and Performance Analysis In addition to defining the mission events for use in the ATM, the iBAT model is used to define mission phases for use in EXTRA. EXTRA is capable of performing mission design by utilizing its enumerative mode where all possible departure dates and flight times (over user-specified ranges) are calculated. In this example, the outbound cargo mission, the outbound crew mission, and the inbound crew mission opportunities and departure windows are determined over the 2030 to 2045 timeframe, covering a complete 15-year Earth-Mars cycle. The cargo mission utilizes propulsive Earth departure with aerocapture Table 4. Departure Date Ranges for 2037 Mars Reference Mission Mars arrival, the outbound crew mission utilizes Departure Date Mission Leg propulsive Earth departure Lower Bound Upper Bound with propulsive Mars arrival, Cargo Outbound (MSH) April 1, 2035 August 30, 2035 and the inbound crew mission Cargo Outbound (MAV) April 1, 2035 August 30, 2035 utilizes propulsive Mars Crew Outbound July 1, 2037 September 30, 2037 departure with direct Earth Crew Inbound April 15, 2039 January 15, 2040 aero-entry. These opportunities (departure dates) and windows (size of the date range for a given opportunity) are selected assuming: the TMI V is less than 4.5 kilometers per second (km/s); the MOC V is less than 2.5 km/s; and the TEI V is less than 2.5 km/s. These values are selected to narrow the range of mission departure dates to those where the mission performance required and departure window size are reasonable. However, the design V must be traded against the size of the 14 American Institute of Aeronautics and Astronautics
15 American Institute of Aeronautics and Astronautics Figure 4. iBAT Interface Illustrating Mars Crew and Cargo Mission Operations
departure window as decreasing design V decreases the size of the departure window. The 2037 crew mission opportunity was selected for further mission optimization and is shown in Table 4. EXTRA is also capable of performing mission optimization where specific mission opportunities defined using the enumerative mode are optimized subject to user-provided constraints. As an example, the date ranges from Table 4 are applied as limits in the optimization where EXTRA minimizes total mission V and satisfies all mission constraints. These constraints, in addition to the date ranges provided, include the following:
Mars equatorial landing site (30 degrees longitude, selected arbitrarily) Maximum excess hyperbolic velocity at departure and arrival less than 8 km/s Crew outbound flight time less than 180 days Crew inbound flight time less than 200 days
Utilizing the optimization mode in EXTRA allows determination of the departure dates, flight times, and performance requirements that satisfy a given set of mission constraints. For this example case, the planetary operations were assumed ideal, thus, all planetary operations are co-planar and the departure and arrival maneuvers are co-apsidal. It should be noted that the mission design approach used herein is a simplified example and may not represent the best or optimal approach for Mars mission design. The approach used is to demonstrate the utility of EXTRA for performing mission design and optimization. For each propulsive event required for the cargo and crew missions, Table 5 shows the transportation element performing the maneuver, the resulting V required, and the vacuum specific impulse (Ispv). This data, when implemented in the integrated model, are used to quantify the propellant storage requirements for the transportation elements of the architecture. C. Model Integration The process illustrated in Fig. 2 is executed to complete the integration of the end-to-end architecture model for this example. This includes developing and verifying each individual ESM, implementing the ConOps and mission performance data from iBAT and EXTRA in the ATM, and executing the COMET model to generate mission and system requirements for this case. With the ATM now configured for this example case, each ESM is linked to the global ATM and the converger is executed to size the architecture based on the parametric selection of Mars surface cargo required. Table 5. Cargo & Crew Mission Delta-V's
Event LEO Rendezvous TMI Disposal MOI – Aerocapture De-Orbit Entry/Descent Landing
Event LEO Rendezvous TMI MOI – Propulsive MPO Rendezvous Ascent Disposal TEI Disposal
Element NTR NTR NTR MAB MAB MAB MDS
Element NTR NTR NTR NTR MAS MAS NTR NTR
Cargo Mission Main Engine Ispv (sec) V (m/s) 3900 915.0 500-800 352.4
Reaction Control Ispv (sec) V (m/s) 150 335.9 100 335.9 150 335.9 15 335.9 50 335.9 100 334.5
Crew Mission Main Engine Ispv (sec) V (m/s) 4100 915.0 1800 915.0 5600 357.8 1600 915.0 -
Reaction Control Ispv (sec) V (m/s) 150 335.9 150 335.9 100 300.0 50 300.0 100 335.9
16 American Institute of Aeronautics and Astronautics
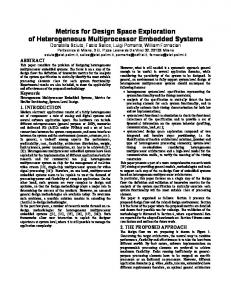
D. Reference Architecture Sizing Results For the reference architecture sizing, a 40 metric ton payload to Mars surface is arbitrarily chosen. Actual payload mass used for design is typically driven by the largest indivisible payload element. However, since this paper uses the transportation architecture side of the overall Mars architecture to demonstrate the capabilities of the EXAMINE framework, an evaluation of the surface system elements (i.e., payload) of the architecture is neglected. Instead, the payload to the surface Table 6. Reference Architecture Sizing Results is parametrically varied to illustrate the integrated Mission Leg Cargo 1 (t) Cargo 2 (t) Crew (t) transportation architecture NTR 139.6 139.1 147.4 response to the surface payload. MAB 43.8 43.8 As shown in Table 6, the total MDS 26.5 26.5 initial mass in low Earth orbit Truss 16.8 (IMLEO) for this example PMTMI 81.7 architecture is 787 tons and does Payload 40.0 (a) 39.3 (b) 42.6 (c) not include program performance IMLEO 249.9 248.7 288.5 reserves or margins. The 40 ton Total IMLEO 787.1 payload for the cargo cases sizes the NTR, MAB and MDS a – Cargo mission 1 payloads include the MSH, MSPS and MTROV elements. elements. For the crew case, the b – Cargo mission 2 payloads include the MAH, MAS, MISPP, MPROV and MSP elements. NTR primary tank is limited to the c – Crew mission payloads include the MTH, CM, crew and suit elements. same volume as designed for the cargo case (i.e., the NTR element is common across all three mission legs). However, additional RCS requirements are needed for the crew case, thus the crew NTR mass exceeds the cargo NTR mass. The truss and PMTMI elements are sized to package the additional propellant required by the NTR element for the crew mission based on a 33.1 ton MTH element (that includes six crew and provisions for 380 days) and a 9.5 ton crew entry module. A heavy lift launch vehicle (HLLV) with 147.4 ton delivery capability to LEO is required if each of the NTR elements is to be launched fully loaded. However, an architecture scenario that utilizes propellant re-supply in LEO or a dedicated NTR tank element sized to fit a given launch capability could reduce that gross delivery capability at the expense of additional launch, loiter and rendezvous events. E. Trades and Sensitivity Results With the reference architecture sizing complete and the integrated model in place, additional sensitivities and trades are performed with little or no turnaround time required. To demonstrate this capability, a parametric trade evaluating the IMLEO sensitivity to cargo mission payload is performed. Figure 4 and 6 illustrate the sensitivity of cargo and crew stack mass to cargo mission payload (PLD_cargo). Crew mission payload (PLD_crew), held constant in this sensitivity assessment, includes the MTH, the CM, and the crew element masses. An interesting observation shows that the larger the payload mass, the larger the NTR element mass as it is sized for the cargo mission. However, the truss and PMTMI element masses decrease as the cargo mission payload increases, due to the fact that the NTR tank capacity increases and a smaller fraction of the total crew mission propellant must be stored in the PMTMI. A sensitivity analysis is also performed to quantify the change in mass of each element with respect to a perturbation in mass for one of the architectural elements. This type of analysis is commonly known as gear ratio analysis. Table 7 summarizes the results of this analysis. The dry mass of each element (as shown in each row of Table 7) is perturbed and the element, along with the rest of the architecture, is allowed to re-size. The change in gross mass for each element (as shown in each column of Table 7) due to the perturbation is quantified in this analysis. Thus, if 1 kilogram (kg) was added to the dry mass of an NTR element, after resizing the NTR gross mass increases 2.6 kg and the total IMLEO mass increase 11.3 kg.
17 American Institute of Aeronautics and Astronautics
350 300
Mass, t
250
200 150 100 50
0 20 t
30 t
NTR
MDS
40 t
MAB
50 t
60 t
PLD_Cargo
Figure 4. Cargo Mission Mass Sensitivity to Surface Payload
350 300
Mass, t
250
200 150 100 50
0 20 t
NTR
30 t
40 t
Truss
PMTMI
50 t
PLD_Crew
Figure 5. Crew Mission Mass Sensitivity to Surface Payload
18 American Institute of Aeronautics and Astronautics
60 t
Table 7. Gear Ratio Sensitivity for Reference Mars Mission
VII. Future Work Documentation of the details of EXAMINE’s system model, each of the segment/element models, and the trajectory analysis model is in-work25,26 or planned for future papers. This will include an overview of each segment/element, subsystem summaries for each element, definition of the segment model trade space, application of the trade space tools (sensitivity analysis, full factorial trade study, etc…), and verification and validation using the best available data. EXAMINE is limited to the definition of launch vehicle stages, hypersonic cruise and accelerator vehicles, inspace transfer stages, lander stages, entry vehicles, transfer habitats, orbital platforms, surface habitats and Mars insitu propellant production facilities. Because not all surface system elements (e.g., surface power, surface mobility, and space communications) are currently modeled in EXAMINE, the relationship between transportation and surface architecture is limited to parametric specification of payload capabilities. Future efforts are planned to include a surface architecture definition tool and new subsystem modules that enable modeling of these additional surface element types. Adding these options to the current capability will enable investigation of the influence of surface system mission requirements and element design on the launch and space transportation architecture.
VIII. Conclusion An alternative architecture definition and assessment methodology, utilizing a centralized, integrated framework of parametric models and operated by a small core team of general space architects, is presented in this paper and is contrasted to the distributed team approach prevalent in NASA. This computational and analysis framework, known as the EXploration Architecture Model for IN-space and Earth-to-orbit (EXAMINE), has the capability to execute the architecture definition and assessment process faster and more consistently than a distributed team approach. A significantly larger fraction of the trade space can be assessed in a given time, enabling more ideas, concepts and strategies to be explored that satisfy a given set of objectives. Integration of parametric element sizing and performance models within the architecture-level framework provides the capability for rapid quantification of element-to-element and element-to-system influences and an overall improved understanding of the integrated system behavior early in the design process. Disadvantages of this methodology include failure to directly utilize the recognized experts in the design process and that the centralization of the study effort fails to gain broad stakeholder advocacy. However, these are significantly mitigated or eliminated if the recognized expert is utilized in the development, verification, and validation of the parametric models and if the framework is used to augment, rather than replace, the distributed team study approach. Utilization of this alternate, centralized methodology prior to and then in conjunction with the distributed team approach is recommended for program formulation. As a study tool used early in program formulation, the alternate 19 American Institute of Aeronautics and Astronautics
methodology can be utilized to survey the broad trade space and pursue new ideas, concepts and strategies. Results of these study efforts serve as a potential starting point for the distributed team process. During the early phases of the design, the centralized methodology augments the distributed team approach by providing integrated architecture verification, gap analysis, sensitivity studies and independent assessments.
Acknowledgments The author’s thank the Constellation’s Program and NASA Langley Research Center’s Systems Analysis and Concepts Directorate, in general, for their support of this research. Special thanks goes out to Vince Bilardo, currently with NASA Glenn Research Center, for encouraging and supporting the idea of an integrated architecture framework and to Neil Lemmons of NASA JSC and Cx’s Analysis, Trades and Architectures Project for providing the opportunity to demonstrate EXAMINE’s capabilities in a real-world setting. Neil, our thoughts continue to be with you.
References 1
“NASA Systems Engineering Handbook,” NASA/SP-2007-6105 Rev1, Washington, D.C., December 2007. Earle, K., personal communications, NASA Langley Research Center, 2008. 3 Cirillo, W., Earle, K., Goodliff, K., Reeves, J.D., Andraschko, M., Merrill, R. G., and Stromgren, C., “Strategic Analysis Overview,” AIAA Paper 2008-7778 to be presented at the AIAA Space 2008 Conference & Exposition, San Diego, California, 2008. 4 Stanley, D.O. and Martinez R.: “Constellation Propellant Options Study Results.” presented at the 58th Congress of the International Astronautical Federation, Hyderabad, India, September 2007. 5 iBAT, A Concept of Operations & Mission Event Definition Tool for use in the EXAMINE Framework: Version 1.3, Analytical Mechanics Associates, Inc., Hampton, VA 23666. 6 EXTRA, EXAMINE Trajectory Modeling Toolset for use in the EXAMINE Framework, Version 1.0, Analytical Mechanics Associates, Inc., Hampton, VA 23666. 7 Olds, A. D., Kluever, C. A., and Cupples, M. L., “Interplanetary Mission Design Using Differential Evolution,” Journal of Spacecraft and Rockets, Vol. 44, No. 5, September-October 2007, pp. 1060-1070. 8 Gerald, C.F. and Wheatley, P. O., Applied Numerical Analysis, 3rd ed., Addison-Wesley Publishing Co., Reading, MA, 1985, Chap. 2. 9 Robertson, E. and Geffre, J., “Lunar Architecture Focused Trade Study Final Report,” NASA-ESMD-RQ-0005, October 2004, pp. 28-29. 10 Brothers, B., “Launch Vehicle Mass Estimating Relationship Database,” Alpha Technologies, Inc., work performed under NASA Marshall Space Flight Center Contract #H-28653D, December 1999. 11 Philips, A., “Integrated Software for Analyzing Designs of Launch Vehicles,” NASA Technical Briefs, August 2003. 12 AC-Sizer, Advanced Conceptual Sizer Toolset, Release Version 7.0, NASA Langley Research Center, Hampton, VA 23681. 13 Dorsey, J., Wu, K.C. and Smith, R., “Structural Definition and Mass Estimation of Lunar Surface Habitats for the Lunar Architecture Team Phase 2 (LAT-2) Study,” Presented at the ASCE Earth and Space 2008 Conference, Long Beach, CA, March 3-5, 2008. 14 Wallace, J., “Mars Bimodal Nuclear Thermal Rocket (BNTR) Model Documentation: Model Version 0.9 Beta,” SpaceWorks Engineering, Inc., work performed under NASA Langley Contract #NIA Activity 2643, January 2008. 15 DePasquale, D., “Mars In-Situ Resource Utilization Sizer, Technical Modeling Summary: Model Version 1.1,” SpaceWorks Engineering, Inc., work performed under NASA Langley Contract #NIA Activity 2643, January 2008. 16 ALSSAT, User’s Guide for the Advanced Life Support Sizing Analysis Tool, Version 7.0, Engineering and Sciences Contract Group, Houston, TX 77058. 17 Yeh, H.Y., Lin, C.H., Brown, C.B., Ewert, M.K., and Jeng, F.F., “ALSSAT Development Status and its Applications in Trade Studies,” SAE-2004-01-2438, July 2004. 18 Hastings, L., Hedayat, A. and Brown, T.M., “Analytical Modeling and Test Correlation of Variable Density Multilayer Insulation for Cryogenic Storage,” NASA TM-213175, May 2004. 19 NIST Reference Fluid Thermodynamic and Transport Properties Database (REFPROP): Version 8.0, URL: http://www.nist.gov/srd/nist23.htm [cited 22 July 2008]. 20 Heineman, W., “Design Mass Properties: Guidelines and Formats for Aerospace Vehicles,” NASA JSC-23303, March 1989. 21 Heineman, W., “Mass Estimating and Forecasting for Aerospace Vehicles Based on Historical Data,” NASA JSC-26098, November 1994. 22 Humble, R.W., Henry, G.N. and Larson, W.J., Space Propulsion Analysis and Design, Space Technology Series, U.S. DoD and NASA, McGraw-Hill Companies, Inc., 1995, pp. 443-506. 2
20 American Institute of Aeronautics and Astronautics
23
Larson, W.J. and Pranke, L.K., Human Spaceflight: Mission Analysis and Design, Space Technology Series, U.S. DoD and NASA, McGraw-Hill Companies, Inc., 1999. 24 Mazanek, D., Lepsch, R. and Saucillo, R., “Lunar Architecture Broad Trade Study Final Report,” NASA-ESMD-RQ-0006, September 2004, pp. 139-169. 25 Wilson, M., Wilhite, A. and Komar, D.R., “Comparative Analysis of Bimodal Nuclear Thermal Rocket Propulsion Systems for Human Mars Exploration,” AIAA Paper 2008-7624 to be presented at the AIAA Space 2008 Conference & Exposition, San Diego, California, 2008. 26 Jones, C. and Wilhite, A., “Mars Ascent Vehicle: Optimization of Propulsion with In-Situ Propellant Production,” IAC-08D1.2.8 to be presented at the 59th International Astronautical Conference, Glasgow, Scotland, Sept. 29 – Oct. 3, 2008.
21 American Institute of Aeronautics and Astronautics