Greatest recall was for items of low complexity in short lists. Weak, but statistically ... California State University, Northridge provided computing assistance.
Memory & Cognition 1976, 4 (5), 466·470
Free recall and complexity of pictorial stimuli BARBARA TABACHNICK and S. JOYCE BROTSKY
Cali/om:in, State University, Northridge, California 91329 In order to explore variables underlying primacy and recency effects in free recall of pictorial material. norms were developed using 120 subjects who rated the vividness and complexity of slides. Two experiments were then run in which two levels of each of these variables (extreme high and low ratings) were factorially combined. In the first experiment 24 subjects were shown three mixed lists, two short and one long (consisting of materials of all four combinations of vividness and complexity), and in the second experiment 12 subjects were shown four pure lists (consisting of materials of a single type). Analysis of variance showed list length in the mixed list experiment and complexity in both experiments to be strong determinants of recall. Greatest recall was for items of low complexity in short lists. Weak, but statistically significant, serial position effects were evident, particularly for less complex items. The effects of primacy and recency seem to decrease with increasing complexity of visual materials. perhaps because of the greater difficulty in rehearsing more complex pictures either verbally or iconically. When any set of stimuli that exceeds our immediate memory span is presented and we are later asked to recall or recognize these stimuli, items at the beginning and end of the sequence have a higher probability of being recalled than items near the middle of the sequence. This hypothesis has been substantiated so consistently under so many different conditions that it has almost achieved the status of an empirical law. Under some circumstances, the recency effect is stronger than the primacy effect, but a reported failure to find either effect in a series of well-eontrolled experiments is an impetus to look carefully at the research. Using complex pictures that did not evoke a consistent label Shaffer and Shiffrin (1972) found that recognition was affected by presentation time but not by the time following a picture. Furthermore, neither primacy nor recency was demonstrated. In order to further explore this finding and its implications for a theory of memory which postulates separate shortand long-term stores, Shiffrin (1973) developed an ingenious procedure for studying free recall of complex pictures. Using a dependent variable based on vividness with which subjects reported recalling the picture, Shiffrin found (1) little primacy or recency effect regardless of presentation time or length of list and (2) a strong list-length effect showing significantly poorer recall for slides in longer lists when presentation time was held constant. Since we agreed with Shiffrin that both primacy and recency effects are, at least within a two-stage memory model, attributable to the additional rehearsal that is usually given to early items and final items in a series, the results seemed to suggest that we may not be able to effectively rehearse complex visual stimuli during periods when they are not physically present. We thank P. Herzer and J. Coleman for their assistance in collecting and analyzing the data. The Computer Center of California State University, Northridge provided computing assistance.
Although we knew of a number of studies using pic torial materials (e.g., Cohen, 1972; Madigan, McCabe, & Itatani, 1972; Paivio, Rogers, & Smythe, 1968) where primacy and recency effects had been demonstrated in the same way that these effects have been demonstrated for verbal materials, we had to agree that the materials, for the most part, had been easily labeled pictures which were distinct, vivid, and really quite simple. Two variables seemed especially appropriate in distinguishing between Shaffer and Shiffrin's pictures and those which normally produce serial position effects: complexity and vividness. The latter variable is one that is particularly interesting in light of the dependent variable used by Shiffrin. We therefore set up a three-stage program to further investigate the Shiffrin findings. First, we attempted to better describe our stimuli by having subjects scale them with respect to complexity and vividness. Then, using varying levels of complexity and vividness of pictures within a stimulus list, we set out to replicate the Shiffrin study with our own materials. Finally, we attempted to generalize our findings to lists composed of a single level of complexity and vividness.
NORMATIVE STUDY Method
Subjects. The subjects were 120 undergraduates enrolled in lower division psychology courses at California State University. Northridge (CSUN). The subjects volunteered to fulfill a course requirement. Eight groups of subjects ranging in size from 10 to 21 persons were run. Stimulus materials. A subset of 340 slides was chosen from a pool of approximately 600 slides. The slides were copies of materials from the Educational Curriculum Laboratory at CSUN or "vacation type" slides from the personal collections of members of the research group. The hue, brightness, and subject matter of the slides varied considerably. Slide coloration varied, for example, from the dull grays and browns of a foggy coastline scene to sunlit floral gardens. Subject content ranged from
466
FREE RECALL AND COMPLEXITY people of diverse ages, nationalities, and occupations to animals photographed in natural settings or in captivity, to paintings and sepia prints of scenes photographed in the Americas, Europe, and Asia. The slides were randomly assigned to five slide trays; the first held 20 slides and the remaining four held 80 slides. The 20-item tray was used for the warm-up period and, thus, was shown first. The four 80-item trays were shown in four different orders, but order of slides within trays remained unchanged. Apparatus. A Kodak Ektagraphic slide projector (Model AF2) projected the slides from a distance of 9.15 m. The projected size of each slide was approximately 1.2 x 1.8 m, varying slightly due to irregularities in commercial slide processing. A Davis time-interval generator (Model 0500 controlled timing of slide presentation. Procedure. When all subjects were seated at tables, the experimenter distributed the response booklets, alternating the form for rating vividness and the form for rating complexity at each table and maintaining a roughly equal proportion of males and females for each condition. Subjects were then told that the purpose of the study wis to learn how people describe and respond to visual material. They were told that they would see a large number of slides presented at a rapid rate. The verbal instructions were such that the sujects were not aware that half of them were rating on a vividness dimension and half were rating on a complexity dimension. After the 20 warm-up items had been shown, the procedure was sufficiently clear that all subjects seemed satisfied that they would be able to do what was requested. The first 260 slides were shown at the rate of one slide every 5 sec, with a I-sec interslide interval. Slide numbers were called out to insure response to the correct slide despite the brisk p~ce. The final tray of 80 slides, four different ones for the eight groups of subjects, was treated differently. The slides in the final tray were projected at a 12-sec rate. Subjects, instead of rating the slides, were instructed to label or describe each slide on the answer sheet provided. A single line was provided for each of the slides.
Results Each of 320 slides was rated by 42 to 45 subjects on a 5-point scale of vividness (V). The same 320 slides were each rated by 43 to 48 different subjects on a 5-point scale of complexity (C). The V ratings ranged from 1.64 to 4.32, with a grand mean of 2.95, a value relatively close to the midpoint (3.00) of the 5-point scale. Two-thirds of the standard deviations varied from .92 to 1.15. The C ratings varied from 1.38 to 4.40, with a grand mean of 2.86. Two-thirds of the standard deviations varied from .76 to 1.00. A Pearson product-moment correlation coefficient revealed that the relationship between the mean V scores and the mean C scores for the 320 slides was close to zero, r(318) = .0043, P > .05. A pool of high-vivid (HV) slides was developed by pulling those 50 or 60 slides from the total pool with the highest rated V scores. Slides were discarded from the pool to reduce obvious similarities in subject matter or slide type, eventuating in a fmal pool of 40 HV slides. A similar procedure was followed to produce the same number of low-vivid (LV), high-complex (HC), and low-complex (LC) slides. It was from these slide pools that slides were drawn for the studies reported below.
467
EXPERIMENT I Method
Subjects. The subjects, 24 undergraduates, were run in fourperson groups. The subjects volunteered to meet a course requirement in an undergraduate psychology course at CSUN. Six groups were run. Stimulus materials. The slides used in this study were of four types produced by factorially combining the two levels of complexity and vividness: (1) both high vivid and high complex (HY-HC), (2) both high vivid and low complex (HY-LC), (3) both low vivid and high complex (LY-HC), and (4) both low vivid and low complex (LV-LC). Three sets of slides (lists) were shown to each fcur-person group. The first two lists consisted of 12 items and the last list consisted of 24 items, and each of the lists contained items of all four types (mixed lists). Lists were balanced so that items of each of the four types occurred in the first third, the second third, and the final third equally often. Presentation order. For the 24-item list, each of the four types of slides was shown twice in each third of the list, yielding six levels of serial position for each type of slide. In order to analyze the 12-item lists and to make them consonant with the 24-item list, the six levels were derived by combining the two lists of 12. That is, the first level of serial position for a particular type of item (with respect to complexity and vividness level) consisted of its presentation in the first third (i.e., Item 1, 2, 3, or 4) of the first 12-item list. The second level consisted of an item of same type in the first third of the second 12-item list presented. The third level consisted of the item type in the second third (i.e., Item 5, 6, 7, or 8) of the first 12-item list presented, and so on, to the sixth level of serial position, consisting of the item type in the final third (i.e., Item 9, 10, II, or 12) of the second 12-item list presented. This transformation, while analytically convenient, may tend to obscure serial position trends. For the purposes of this study, however, this represents a conservative, or negatively biased, test of the serial position effect. Procedure. Subjects were told that they would see a series of slides briefly presented and that they would be asked to recall them immediately after eaeh list. They were further told that "in order to demonstrate that you recall a slide, you should picture the slide in your mind's eye and provide a line or two of description for us on the answer sheet provided." Subjects were then given a short series for practice and as much verbal information as they requested. The slides were presented using a Kodak Ektagraphic slide projector (Model AF2) controlled by a Davis time-interval generator (Model 0501). The slides were projected to a size of 71 x 107 em on a white screen at a 2-sec rate (l sec on and 1 sec off). Following the presentation of each list, subjects were given as much time as they needed to write down all of the descriptions they could recall at the time. The amount of time required by each group varied from 8 min to 10 min. When subjects had concluded the written recall, the same items were re-presented in a different order, and subjects were asked to find the corresponding description if they wrote it and were asked to rate the vividness of the recollection. More specifically, as the experimenter represented each of the slides, she called out a number. Then the subject was to find the description and affix the appropriate number to that description. Obviously, if the subject had not written a description of that slide, the number was not used. Also, the subject was asked to indicate next to the description the degree of vividness with which the slide in question was remembered at the time the description was written. The total running time varied from 43 to 53 min, and was dependent upon the recall period required, the matching period required, and the additional questions that might have been asked by members of a particular group.
468
TABACHNICK AND BROTSKY
Results The dependent variable was the vividness with which slides were recalled. A four-way (2 by 2 by 2 by 6) repeated-measures analysis of variance was performed for the following combination of independent variables: two levels of list length (12 and 24 items), two levels of complexity (HC and LC), two levels of vividness (HV and LV), and six levels of serial position. The dependent variable, developed by Shiffrin (1973), is a composite of two factors: whether or not a slide was recalled and a rating on a scale of I to 5 indicating, for those slides that were recalled, the vividness of the recall. Thus the combined measure reflects a 6-point scale on which 0 indicates lack of recall, I represents a slide recalled with very low vividness, and 5 represents a slide recalled with very high vividness. This is a useful DV which allows greater analytic flexibility than either probability of recall or vividness of recall alone. The interpretation of this combined variable as an indirect measure of recall is supported by the strong correlation, Pearson r( 45) = .94, p < .01, between combined vividness of recall rating and probability of recall of the 48 slides, pooled over the 24 subjects. In the remainder of this paper, then, references to recall, unless modified, refer to the combined probabilityvividness rating value. Analysis of variance of recall revealed strong effects of list length: F(I,23) = 42.41, p < .01. Slides showed higher recall when they appeared in the 12-item list (mean rating = 2.48 on the scale of 0 to 6) than when they appeared in a 24-item list (mean rating = 1.89). The strength of this relationship between list length and recall is reflected in the w 2 value! of .63. Looking simply at proportion of nonzero responses, this represents a reduction in probability of recall from 61.8% for the 12-item list to 49.5% for the 24-item list. The corresponding mean vividness of recall ratings for only those slides which were recalled were 4.01 and 3.82 for the short and long lists, respectively. Also striking was the influence of normative complexity rating on recall: F(1,23) =25.69, p < .01, w 2 =.53. Slides which had been rated less complex (LC) by the normative groups showed greater recall (mean rating = 2.52, probability of recall = 62.2%) than those which had been normatively rated HC (mean rating = 1.86, probability of recall = 49.1 %). The corresponding mean rating of vividness for recalled slides only was 3.79 for HC and 4.05 for LC slides. Normative vividness rating influenced recall, F(I,23) = 10.77, P < .01, w 2 = .29. Those slides which had been rated highly vivid (HV) by the normative groups showed more recall (mean rating = 2.40, probability of recall = 59.5%) than those which had been normatively rated LV (mean rating = 1.98, probability of recall = 51.7%). The mean vividness of recall ratings alone (on recalled slides only) for slides normatively rated HV and LV were 4.00 and 3.81, respectively.
u
.. u
I ~
I
u 11
... ... ", \\
U
........
.",._
....
_~
'"
H;p C-,..
ily
••
12- i _ U... 2. - i _ u...
• 1-2
2 ~
2 H
4 7-1
I
I
I
S ....
•
7
n-12 _
I
I
1 • IH6 _
,
,
I
10 11 .2 IND 11-22 D~
_1ClmIOII
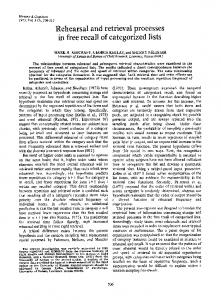
Figure I. Recall as a joint function of serial position am normative complexity rating of slides, Experiment I. Adjacen pairs of items He combined for 24-item lists. (Note that dat points are based on actual serial position rather than the siJ transformed levels.)
Both the main effect of serial position, F(5,115) = 2.69, p < .05, w 2 =.07, and the interaction of Com plexity by Serial Position, F(5,115) = 2.32, p < .05 w 2 =.05, reached statistical significance, althougl they account for a relatively minor proportion 0 variance. Trend analysis following Grant's (1956 procedure revealed a statistically significant quadrati trend, F(1 ,23) = 11.69, P < .01, while the deviatioi from quadratic trend for the main effect of serial posi tion was minimal, F(4,92) < 1. As demonstrated iJ Figure 1, the usual primacy and recency effects accoun for the quadratic trend. As can also be seen in Figure I, this serial positio: effect is limited to LC items. This is reflected by tlu significant quadratic component of the Serial Positioi by Complexity interaction, F(1 ,23) = 7.5, P < .05. Thl deviations from quadratic trend for the interaction failet to reach statistical significance, F(4,92) < 1. None of tlu remaining main effects or interactions significantf affected recall.
EXPERIMENT II Method
Subjects. The subjects volunteered to meet an undergraduate psychology course requirement at CSUN. The 12 subjects were run in four-person groups. Three groups were run. Stimulus materials. The slides were of the four types used in Experiment I: HV-HC, HV-LC, LV-HC, LV-LC. Each list con tained 12 slides of a single type (pure lists). Order of presenta tion of list type was balanced among the three groups. Order 01 slides, all of the same type within each list, was varied randomly among the three groups. Procedure. Instructions, task, and apparatus were identical to those in Experiment I. The two experiments differed in: (1) the elimination of the longer list of 24 items in Experi· ment II, (2) the reduction in groups from six to three, and (3) the manner in which lists were formed-with mixed list! used in Experiment I and pure lists in Experiment II.
FREE RECALL AND COMPLEXITY
469
from the quadratic also reached statistical significance, F(IO,llO) = 2.25, p < .05. No significant linear trend was found, F(1 ,11) < 1. 3.5 In addition, statistically significant, albeit weak, 3.0 interactions were found among serial position, comU plexity, and normative vividness rating. For the Vivid... , ness by Serial Position interaction, F(11,121)=2.11, " 2.1 \ p < .05, w 2 = .08; for the Complexity by Serial Position \ \ U \ interaction, F(11,121)=2.07, p u Further, it appeared that traditional serial position u effects were, as in Experiment I, stronger for LC slides, U although in a trend analysis of too Complexity by Serial Position interaction, the quadratic component 2.0 failed to reach statistical significance, F(I ,11) = 3.03, 1.5 p > .05. The remaining main effect of normative vividness rating and the Complexity by Vividness interaction 1.0 ...-----4 LowVI"'.... failed to reach statistical significance. 0.5 Because probability of recall is dichotomous for a o 12.11Ml1llll 1 2 2 4 5 6 7 1 , 10 11 12 given subject on each slide, statistical analysis of that 24-11. . 1lIlI 1-2 2·4 5-6 7-1 '-10 11-12 I2-M 1S-16 17-. IHO .-22 22-14 dependent variable as a function of serial position, SERIAL POSITION including analysis of trends, proved to be impractical. Figure 2. Recall as a function of serial position, nonnative Neverthless, as is suggested in Figure 3, which combines complexity rating, and normative Yividness rating of slides, Experiment II. Adjacent pairs of items are combined for the the data from both experiments, the existence of primacy and recency effects cannot be dismissed, even 24-item lists. for this direct measure of recall probability. Results The same pattern of repeated-measures analysis of DISCUSSION variance was applied to the same dependent variable as in Experiment I. The elimination of list length as a variWe do seem to have found a serial position effect. able reduced the analysis to the three-way model, and With a measure that combined vividness of recall and the use of pure lists allowed evaluation of the full 12 recall probability, the effect was weak but statistically levels of serial position, yielding a 2 by 2 by 12 analysis significant in both experiments. Further, the trend of complexity, vividness, and serial position, toward primacy and recency effects is strongly suggested in the direct measure of the probability with which respectively. Vividness of recall, measured in the same way as in Experiment I, was again interpreted as an indirect u measure of recall, supported by its high correlation, Pearson r(46) = .96, p < .01, with probability of recall. Complexity again proved to be a strong determinant of recall, F(I,Il) = 20.47, P