Apr 29, 2013 - first shown that performance increases compared to POT detection. ... EVT, motivated by condition monitoring of rotating machine were exposed in .... 2 Implementation is mainly done in Python an R. We used Numpy, Scipy, ...
Frequency-Dependent Peak-Over-Threshold algorithm for fault detection in the spectral domain Aur´elien Hazan, Kurosh Madani
To cite this version: Aur´elien Hazan, Kurosh Madani. Frequency-Dependent Peak-Over-Threshold algorithm for fault detection in the spectral domain. ESANN 2013, Apr 2013, Bruges, Belgium. i6doc.com, p.107-112, 2013.
HAL Id: hal-00785382 https://hal.archives-ouvertes.fr/hal-00785382v2 Submitted on 29 Apr 2013
HAL is a multi-disciplinary open access archive for the deposit and dissemination of scientific research documents, whether they are published or not. The documents may come from teaching and research institutions in France or abroad, or from public or private research centers.
L’archive ouverte pluridisciplinaire HAL, est destin´ee au d´epˆot et `a la diffusion de documents scientifiques de niveau recherche, publi´es ou non, ´emanant des ´etablissements d’enseignement et de recherche fran¸cais ou ´etrangers, des laboratoires publics ou priv´es.
Frequency-Dependent Peak-Over-Threshold algorithm for fault detection in the spectral domain Aur´elien Hazan and Kurosh Madani LISSI- Universit´e Paris-Est Cr´eteil IUT de S´enart-Fontainebleau, 77567 Lieusaint - France Abstract. An original novelty detection algorithm in the Fourier domain, using extreme value theory (EVT) is considered in this article. Periodograms may be considered as frequency-dependent random variables, and this can be taken into account when designing statistical tests. Frequency-Dependent Peak-Over-Threshold (FDPOT) puts special emphasis on the frequency dependence of extreme value statistics, thanks to Vector Generalized Additive Models (VGAM) estimation. An application is discussed in the field of mechanical vibrations. It is first shown that performance increases compared to POT detection. Then FDPOT is compared to state-of-the-art algorithms such as KPCA.
1
Introduction
The problem of novelty detection is addressed in this article, in the particular case when feature vectors are spectra, or more precisely periodograms that may be obtained from time-dependent signals. There is no typical fault: even though high peaks deserve attention, other unexpected signatures should also be considered. Novelty Detection has been extensively discussed recently in the Machine Learning [1, 2] and data mining litterature [3] partly because, most of the time, the learning dataset does not contain fault data. Extreme Value Theory has provided useful insights to novelty detection in a probabilistic framework: a model of “normality” is first learnt from available no-fault and multivariate data, before detection. Several succesful applications were discussed in engineering [4] and medicine [5]. Authors’ contributions to novelty detection in the spectral domain using EVT, motivated by condition monitoring of rotating machine were exposed in [6, 7], notably Bayesian Wavelet Modelling (BWAV) and Peak-Over-Threshold (POT) novelty detection. In this article we discuss major improvements on POT: the statistical basis and the resulting algorithm are detailed in 2, while experimental results are examined in 3.
2
FDPOT novelty detection: statistical basis and algorithm
In this article, feature vectors will be periodograms computed from univariate noisy time-series which typical length will range between 103 and 104 , without any usual smoothing pre-processing steps. Let us first briefly recall the definition of I(ωj ), the periodogram at Fourier frequency ωj = 2πj T , j ∈ [0, T − 1] associated with some discrete-time signal X0 , . . . , XT −1 : T −1
I(ωj )
=
1 X Xt e−iωj t |2 | 2πT t=0
(1)
Consistent with standard hypotheses in novelty detection, we consider the learning set to be free from abnormal periodograms. Some will be present however in the test dataset, in order to compute false positive and false negative rates. No model is assumed for the periodograms themselves, neither in normal nor abnormal mode. However, the excesses of the periodograms over a given frequency-dependent threshold will be modelled as explained in 2.1. 2.1
POT novelty detection
In [4] and related works the authors show that, given some abnormality score X, fitting some distribution for X is less robust than fitting the density of max(X) in order to detect faults. In [6, 7] we have adapted this idea to periodograms as follows. Let X be a random variable related to the behavior of a system we wish to monitor. Among many issues, Extreme Value Theory addresses the problem of modelling the probability P (X − t | X > t), namely the excess of X over t, assuming that X > t. Under mild conditions on the pdf of X, if t is large enough then P (X | X > t) can be approximated by the Generalized Pareto �− γ1 � distribution (GPD) [8, 5.3.1] F (x) = 1 − 1 + γx , where γ is the shape σ and σ the scale, and both need to be estimated from measurements. The fault detection algorithm may then be written: 1. select a subset of the learning dataset, made of N log-periodograms of length F . For each frequency f we compute the max of the log-periodograms across the subset. A real vector m is obtained, the mask. 2. spot excesses over the mask in the rest of the learning dataset. Only excess values Y = Xf − mf | X > mf are recorded, regardless of the frequency for which they occur. They consitute a sample of scalar excesses {Yi }i≤I , and serve as inputs to the parameter estimation of the GPD. 3. set a detection threshold t according to standard probabilistic considerations and define a decision rule: any excess Y over the threshold t is considered as a fault.
For new uncategorized data, the last two steps of the procedure are repeated: excesses Y over the mask are first computed, then compared to t. 2.2
Critical assessment of POT’s performance
3 0
1
2
excess
4
5
6
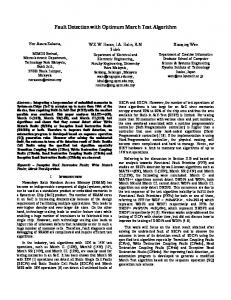
To assess the performance of POT, the ROC curve was computed in [7] and compared to similar curves obtained with similar algorithms such as KPCA (an extension of PCA that performs dimension reduction using kernels, adapted to novelty detection by Hoffman). In spite of the good results yielded, it immediately appears from the algorithm’s description in 2.1 that excesses Yi corresponding to all frequencies are gathered together in order to increase the learning set size, and improve statistical significancy. Doing so, we lose the frequency dependence, that may carry valuable information, as examplified by Fig. 1, where circles represent excesses Yi over a frequency-dependent threshold, with respect to their corresponding frequency. It is clear, in spite of the frequency dependent thresholding described in steps 1 and 2 of section 2.1, that a frequency dependence remains in the samples.
0
1000
2000
3000
4000
frequency
Fig. 1: Excesses (o) over the frequency-dependent threshold of POT. The black horizontal line is a constant detection threshold for a GPD fitted against the excesses, at the level α = 5%. The red curve is a frequency-dependent detection threshold at the same level α, obtained thanks to a VGAM fit of a GPD with constant shape γ and frequency-dependent scale σ(f ). This loss has consequences concerning the performance of the novelty detection algorithm. Indeed, assume that a Generalized Pareto distribution is fitted against the excesses Yi represented in Fig. 1. Now, let us set a constant Type-I error rate α = 5%, and compute the associated excess threshold, plotted as a red horizontal plain line in Fig. 1. It seems obvious that excesses with frequency index close to the peak around 1800 will generate more false alarms than excesses with frequency close to index 3000. The consequence is a higher false positive rate (FPR), and can also be a lower true positive rate (TPR). Several approaches may be devised to take this dependency into account, such that binning the frequencies and fitting independent Generalized Pareto
for each bin. We describe a more efficient approach in 2.3. 2.3
FDPOT novelty detection
Suppose we can fit the GPD function in a frequency-dependent way. Then for each frequency f , we can design a specific statistical test that takes into account the frequency-dependent shape γ(f ) and scale σ(f ) of the distribution. We would then expect the FPR to be lower than for POT. As we shall see below, one can compute such estimates {σ(f ), γ(f )}f ∈F where F is the set of frequencies of interest. The training steps of a FrequencyDependent Peak-Over-Threshold (FDPOT) novelty detection algorithm are thus: 1. Define a vector-valued mask m in a way similar to Algorithm POT. 2. Compute excesses over the mask in the learning dataset. Excess values yi = xi − mi | xi > mi are recorded with their associated frequency fi . 3. Fit a frequency-dependent GPD, and get {σ(f ), γ(f )}f ∈F . The detection algorithm itself would then be, for each new vector-valued periodogram: 1. Compute the excesses over the mask and the corresponding frequency {(yi , fi )}i∈I . 2. For each i in I, find the corresponding (σ(fi ), γ(fi )) and compute the probability pi = Pσ(fi ),γ(fi ) (yi ), where P is the GPD function. 3. Compute some function g of the pi , e.g. their average and get the abnormality score s = g(p1 , . . .). s is finally used to decide whether or not a detection occurs according to some policy (the ROC curve can be computed directly without specifying this policy). Let us now evoke the choice of the estimator for dependent variables (σ(fi ), γ(fi )). This issue is discussed at length in [9, §6.4] and [8, §7], where entry points to the specialized litterature are given, both parametric and non-parametric. Since the spectra we study in this article do not fit simple parametric models, we prefer non-parametric approaches. More specifically, we use the Vector Generalized Additive Model (VGAM) approach, intially developped by Yee for categorical data and later extended to extreme value statistics [10].
3
Experimental results
The IMS bearing dataset [11] is a publicly available1 set of vibration signals. Four bearings are installed on a shaft that rotates at a constant speed of 2000 rpm. Progressive degradations are recorded over a month from 8 accelerometers 1
http://ti.arc.nasa.gov/tech/dash/pcoe/prognostic-data-repository/
as the designed life time of the bearings is exceeded. In this section, univariate vectors of length T = 8092 will be used. First a baseline taken at the 90% percentile for each independent frequency is computed. The excesses over this baseline are first fitted to a frequencyindependent GPD as illustrated in Fig. 2(a), where a rather satisfactory fit is obtained. This would justify the fitting of a frequency-independent GPD as in POT novelty detection, but as we show below, the FPR and FNR are in that case far from optimal. We then fit2 a VGAM model with fixed shape parameter γ and frequencydependent scale σ(f ). This is advised by Yee for numerical stability reasons. Indeed when γ and σ both depend on f , the numerical optimization fails to converge. Setting a Type-I error level α = 5%, we then obtain the variable threshold curve of Fig. 1. It is clear from the latter that false alarm rate in regions with excess peaks will be attenuated. Conversely, the true positive rate will increase in regions where the variable threshold lies below the constant threshold red line at the same level α. Finally we compute the Receiver Operator Characteristic (ROC) of the FDPOT detector, and the Area Under Curve (AUC) of ROC, as displayed in Fig. 2(b). Table 1 summarizes AUC results for POT, FDPOT and KPCA-based detectors. While the results lack cross-validation at the moment, it appears clearly that FDPOT improves on POT performance. Fine tuning and accurate comparison of KPCA and FDPOT are left to further developments. Detector AUC
POT 0.88
FDPOT 0.97
KPCA 0.93
Table 1: AUC comparison.
Receiver operating characteristic
Density Plot
1.2
1.0
True Positive Rate
1.0
0.8
0.4
0.4
Density
0.6
0.8
0.6
0.2
0.2
0.0
0.0 0
1
2
3 Quantile
(a)
4
5
6
ROC (area = 0.93) Luck 0.0
0.2
0.4 0.6 False Positive Rate
0.8
1.0
(b)
Fig. 2: Frequency-independent GPD fit of excesses (a) and ROC curve of novelty detector (b). 2 Implementation is mainly done in Python an R. We used Numpy, Scipy, the package rpy2 http://rpy.sourceforge.net/, scikit-learn http://scikit-learn.org/. and R packages EVD and VGAM.
4
Conclusions and perspectives
In this article a new novelty detection algorithm is proposed, based on Extreme Value Theory, in the spectral domain. This algorithms makes the most of vector-valued non-parametric estimation, namely VGAM, applied to peak-overthreshold statistics in the dependent case. We show with a real labelled dataset that FDPOT improves on POT, and has performance superior to state-of-the art algorithms such as KPCA. However, FDPOT relies on numerical optimization, which is both time-consuming and likely to fail. Furthermore, FDPOT is more sensitive -by construction- to peaks than to very low values. In future works we first plan to compute theoretical ROC curves, to cross validate the ROC curves and AUC and extend comparisons to other real-world databases, for example the special case of very low error rate. We also plan to investigate the role of the averaging scheme in FDPOT, to take into account the influence of another dependent variable, namely the regime which is very important in rotating machine industrial applications. The numerical difficulties that arise when both σ and γ depend on f will be examined. Finally, we will look for theoretical arguments to explain the ranking of algorithms’ performance.
References [1] M. Markou and S. Singh. Novelty detection: a review. Part 1: statistical approaches. Signal Processing, 83(12):2481–2497, December 2003. [2] M. Markou and S. Singh. Novelty detection: a review. part 2: neural network based approaches. Signal Processing, 83(12):2499–2521, December 2003. [3] V. Chandola, A. Banerjee, and V. Kumar. Anomaly detection: A survey. ACM Comput. Surv., 41(3):15:1–15:58, July 2009. [4] L. Tarassenko, D.A. Clifton, P.R. Bannister, S. King, and D. King. Novelty detection. In K. Worden, editor, Encyclopaedia of Structural Health Monitoring. Wiley, 2009. [5] S. Hugueny, D.A. Clifton, and L. Tarassenko. Probabilistic patient monitoring with multivariate, multimodal extreme value theory. Communications in Computer Science, 127:199–211, 2011. [6] A. Hazan, M. Verleysen, M. Cottrell, and J. Lacaille. Bayesian inference for outlier detection in vibration spectra with small learning dataset. In Proceedings or Surveillance 6, Compi` egne, France, October 2011. [7] A. Hazan, J. Lacaille, and K. Madani. Novelty detection in vibration spectra using peakover-threshold statistics. In Proceedings of CFM-MPT’12, pages –, London, June 2012. British Institute of Non-Destructive Testing. [8] J. Beirlant, Y. Goegebeur, Y. Teugels, and J. Segers. Statistics of extremes. Theory and applications. Wiley, 2004. [9] S. Coles. An introduction to statistical modeling of extreme values. Springer Series in Statistics, 2001. [10] T. W. Yee and A. G. Stephenson. Vector generalized linear and additive extreme value models. Extremes, 10(1-2):1–19, 2007. [11] H. Qiu, J. Lee, and J. Lin. Wavelet filter-based weak signature detection method and its application on roller bearing prognostics. Journal of Sound and Vibration, 289:1066–1090, 2006.