Frequency-Domain Maximum Likelihood Identification of Modal Parameters with Confidence Intervals 1
1
2
P. Guillaume , P. Verboven and S. Vanlanduit 1 Department of Mechanical Engineering, WERK, Vrije Universiteit Brussel, Belgium 2 Department of Electrical Engineering, ELEC, Vrije Universiteit Brussel, Belgium E-mail:
[email protected]
Abstract A multivariable frequency-domain maximum likelihood estimator is proposed to identify the modal parameters together with their confidence intervals. The algorithm has been optimized to reduce the computation time as well as the memory requirements. The solver is robust to errors in the non-parametric noise model and can handle measurements with a large dynamical range. .
1. Introduction The results presented in this paper originate form the research project IWT/OZM/950298 and the Eureka project EU-1503 [l], both funded by the Flemish Institute for the Improvement of the Scientific and Technological Research in Industry (IWT). The aim of the research project is the valorization of advanced system identification techniques in the field of experimental modal analysis. In [2], these techniques are applied to optical measurements with a high spatial resolution
[Il. One of the most popular identification approaches used in industry consists of two steps [3]. First the poles (and the modal participation factors) are estimated with the (polyreference) least-squares complex exponential (LSCE) estimator. These results are used to construct a stabilization chart from which one tries to separate the physical poles form the mathematical ones. During the second step, the mode shapes are estimated with the leastsquares frequency-domain (LSFD) solver. This approach can handle large data sets in a reasonable mount of time. Although the LSCE-LSFD approach has proven to be useful in solving many vibration problems, the method has some drawbacks: . the polyreference LSCE estimator does not always work well when the number of references (inputs) is larger than, say 3, . the frequencies should be uniformly distributed, l the method is not able to handle noisy measurements properly, which can result in unclear stabilization plots, and,
the method does not deliver confidence intervals on the estimated modal parameters. In the present contribution the applicability of frequency-domain Maximum Likelihood (ML) identification techniques will be investigated. One of the often mentioned drawbacks of ML estimators is the fact that they are rather computer intensive and that they are not suited to handle large amounts of data. During the last years attention has be paid to the optimization of the ML estimator with respect to these two drawbacks. The algorithm has been modified to keep the memory requirements as low as possible. Moreover, by using an adapted parameterization and fast signal processing techniques, in was possible to obtain an important reduction of the computation time. The main ideas will be elaborated in Section 2. The case study we will consider in Section 3 to illustrate the possibilities of the ML approach is flight flutter testing. It has been recognized that maximum likelihood parameter estimation techniques have the potential to be a significant breakthrough in flight flutter testing [4]. This is because flight flutter data are quite noisy while the ML estimator, which is based on a statistical approach [5], can take noise information into account (e.g., the variances of the measured FRFs). Another important asset of the ML estimator is that confidence intervals can be derived on the estimated modal parameters, almost without additional calculations. This is interesting for flight flutter testing but also for applications such as condition monitoring and failure detection.
As the equations (2) are linear in the parameters, they can be reformulated as
2. Theoretical Aspects A scalar matrix-fraction description - better known as a common-denominator model - will be used in the present paper [6]. The Frequency Response Function (FRF) between output o and input i is modeled as
Xl
0
0
x2
0
0
...
x N&
YNN > n, where y1 is the order of the polynomials). Because every equation in (2) has been weighted with W,i (of ) , the X, ‘s in (3) can all be different. The LS estimate can be computed efficiently via a “structured” QR decomposition of J (see [7] for the case where all X, ‘s are equal). The algorithm in [7] can be further improved by computing the orthogonal projections by means of QR decompositions (a technique which is commonly used in subspace identification algorithms [8]). This improvement was necessary to handle the problem with different X, ‘s efficiently. Remark: Contrary to the Y, (ar ) matrices, the X, (of ) matrices occuring in (3) do not contain measured data (i.e., they are not subjected to errors). Because of this, it is possible to applied the “mixed LS-TLS” algorithm presented in [9] (TLS stands for
Total Least Squares). The first step consists again in a QR decomposition of J.
we observe that
[X,HX,l,
2.1.1 The LS equations
[YkH Yk 1
Many estimators used in modal analysis form the normal equations explicitly, i.e. they compute Re(JHJ) . Deriving the estimates directly from the Jacobian matrix leads to a better conditioned problem. However, forming the normal equations can result in a faster implementation as will be the case here.
0
JHJ =
0
xi%
FYY, (1. - s)
(4)
=FXY,(r-s)
with N-l
FXX, (m) = x XX, (IZ)~~~*~“~~ n=O N-l
FYY, (m) = c YY, (IZ)~?‘~~‘~ n=O N-l
FXY, (m) = c XY, (PZ.)~~“~~‘~ n=O
x;y,
...
xi% NoNi
Y,"X, YCX2 ...
c
Y,“Y,
/=I
with
If a discrete time-domain model is used, i.e. fi,i (Of ) = exp(--kufT, . j) , and if the frequencies are uniformly distributed (e.g., of = f. 60 with
the discrete Fourier transform of the above defined sequences. Using an FFT to form the normal equations [ 10, 111 results in an important reduction of the computation time (typically a factor of 10). A similar approach could also be applied to, for instance, the IQML [5] and the mixed-LS-TLS estimator. As a discrete time-domain model - which often leads to a well-conditioned Jacobian matrix J - has been used, the explicit calculation of the normal equations can be justified. If not, the slower algorithm based on the structured QR decomposition of the Jacobian matrix has to be used. 2.1.2 Solving the normal equations The normal equations can be rewritten as
Ao= 2n/NTs ), then, the above summations can be rewritten as
~l~w~,i(w,)~2e’““.“l” [Y,“YJ,, = ;llw> = varUwW,i (of 1) > =
The similar approach as used for (8) can be applied to (13) to derive the estimates together with their uncertainties. If the cost function increases during the optimization, the Gauss-Newton method is replaced by the Levenberg-Marquardt algorithm, which always results in a decrease of the cost function (and thus in an improvement of the estimates). The computation time could be further reduced with a factor 2 by using transfer function models with complex coefficients instead of real ones.
)I2
(14)
varI%, (Or ) 1 IHoi Cmf 11’
with H(u,~) the Hi estimate, M the number of averages (i.e., 3 in this case) and y2 (of.) the
(i.e., the noise-to-signal (power) ratio of the FRFs).
coherence function.
-2
20
0
60
40
-25' 4
80
6
8
S
IE
12
14
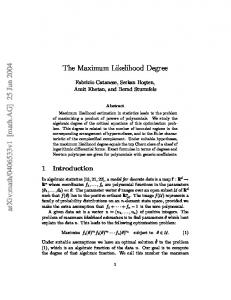
Figure 4: ML results. Amplitude in dB of the measured FRF (thin line) and the synthesized FRF (bold line).
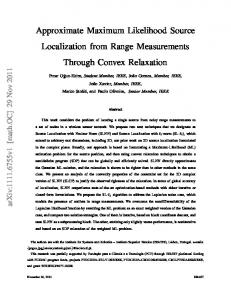
Figure 2: Measured input signals.
1 0.5
3
0 -0.5 -1
-1.5’ 0 20
40
60
80
S
Figure 3: Measured response signals. Table 1: ML results. Resonance frequencies and damping ratios (together with their 99% confidence levels). *yIx~--I*II)II Damping ratios,% _.” .IResonance ._“. --~_, freq., Hz 6.09 (kO.55) 4.860 (r0.027) “3.73 (kO.47) 6.155 (kO.029) 6.36 (kO.40) 6.813 (a0.027) 3.33 (kO.10) 8.487 (+O.OOS) 7.26 (kO.30) 12.138 (kO.036) 4.67 (kO.2$ 14.016 (kO.03 1) x+_ s ,\