This paper presents a frequency domain self-identification method reducing unavoidable measurement noise. To formulate the frequency domain ...
Frequency Domain Self-Identification with Variable Structural Parameters Using Impulse Response Atsuhiko Senba∗ and Hiroshi Furuya† Tokyo Institute of Technology, Yokohama, Kanagawa, 226-8502, JAPAN This paper presents a frequency domain self-identification method reducing unavoidable measurement noise. To formulate the frequency domain self-identification method, the variable angular momentum of the adaptive gyroscopic damper system is used as the variable structural parameter to identify the equivalent modal parameters of the mathematical model. It is supposed that the impulse response data of the system is measured to obtain the Fourier spectrum, and that the impulse response data contains measurement random and periodic noises. To reduce the measurement noise, we propose a noise reduction approach by using the difference between the two Fourier spectrums, where each spectrum is corresponding to the different variable angular momentum. Because the Fourier spectrum corresponding to the measurement noise can be assumed to be constant, the difference between the two spectrums has no spectrum corresponding to the measurement noise. As a result, multiplying the difference between the Fourier spectrums to the two Fourier spectrums reduces the measurement noise of them, and the equivalent modal parameters are identified accordingly. Numerical analyses indicate that the random and periodic measurement noises are effectively reduced by the difference between the two Fourier spectrums changed by the variable angular momentum, and the accurate identification of the modal parameters is realized.
Nomenclature M(τ ) Variable mass matrix C(τ ) Variable damping matrix K Constant stiffness matrix U(x) Input influence matrix S(x) Output influence matrix q Modal displacement vector y Output vector f External force vector w System noise vector e Measurement noise vector mi Equivalent modal mass Equivalent modal damping cˆi Equivalent modal stiffness ki Ig (τ ) Variable moment of inertia aournd gimbal axis Damping coefficient of gimbal axis cg kg Stiffness coefficient of gimbal axis ci (τ ) Variable gyroscopic parameter L Length of beam b Width of beam h Thick of beam A Cross sectional area EI Bending stiffness of beam Mg Mass of gyroscopic damper Eigen value of AGDS sj t Time ∗ Graduate Student, Department of Built Environment, Nagatsuta 4259-G3-6, Midori-ku, Yokohama 226-8502, JAPAN, AIAA student member. † Associate Professor, Department of Built Environment, Nagatsuta 4259-G3-6, Midori-ku, Yokohama 226-8502, JAPAN, AIAA senior member.
1 American Institute of Aeronautics and Astronautics
x ep φ θ τ ρ λi
Location Non-dimensional identification error Rotational angle of gimbal Angle of incline of beam Control parameter Mass density Solution of characteristic equation
Superscript ∗ Exact value Subscript j Mode number of AGDS i Mode number of beam e Elemental matrix of FEM min Mininum value max Maximum value
I.
Introduction
dentification of mathematical models, which describe the dynamical characteristics of structures, is one of the most important requirements for efficient control and realization of precise structures. The adaptive Istructures have attracted intense attention because of their possibilities to meet advanced mission requirement such as the precise control of large flexible structures1. As the application of the adaptive structures, we have proposed the concept of self-identification, which means that adaptive structures identify their unknown structural properties by using their dynamical responses to the variable structural parameters2. The study has indicated that the adaptive structures have the capabilities not only to suppress structural vibration and to control static deflection, but also to identify the mathematical models by using their variable structural parameters such as the variable stiffness3 , damping4 and inertia5 . Extending the study, this paper addresses the advanced application of the adaptive structures to reduce unavoidable measurement noise in vibration data for the self-identification of the equivalent mathematical model. In order to accurate system identification from test data, the noise in measured digital data can be reduced with various digital filters in many cases, however, if the frequency characteristic of the measurement noise is unknown, the effective digital filters cannot be well designed. On the other hand, singular value decomposition technique has been widely known as being very effective to separate the noise component from noisy data. Based on the Ho-Kalman algorithm6, the eigensystem realization algorithm (ERA) was proposed for modal parameters identification from noisy test data, which is based on the singular value decomposition of the generalized block Hankel matrix7 . For the realization using arbitral input-output data, some algorithms have been proposed, and they are called the subspace identification method8, 9, 10 . If the noise is small, correct singular values for the system modes are easily detected as the large singular values. However, the data of significantly low signal-to-noise ratio may affect the detection of the correct singular values from all of non-zero ones. To reduce the unavoidable noise without digital filters or singular value decomposition, we propose a noise reduction approach by using Fourier spectrum amplitude changed by the variable structural parameter of the adaptive structures. Because the Fourier spectrum corresponding to the measurement noise can be assumed to be constant, the difference between the two spectrums has no spectrum corresponding to the measurement noise. As a result, multiplying the difference between the Fourier spectrums to the two Fourier spectrums reduces the measurement noise of them, and the equivalent modal parameters are identified accordingly. The noise reduction approach is integrated with the self-identification method called the variable matrices method (VMM) as the frequency domain self-identification method. Basic formulation of original VMM has been shown using a second-order dynamical equation for adaptive structures12, 13 . The objective of this research is to propose the frequency domain self-identification method reducing the measurement noise. The measurement noise is reduced by using the Fourier spectrum changed by the variable structural parameter, where the Fourier spectrum is obtained from impulse response data. Numerical examples of the frequency domain self-identification of the adaptive gyroscopic damper system are demonstrated
2 American Institute of Aeronautics and Astronautics
Fig. 1.
Cantilevered beam model of Adaptive gyroscopic damper system (AGDS)
to show the feasibility of the proposed method.
II.
Self-Identification Method with Noise Reduction
In this section, we will formulate the VMM in modal space for identification of the equivalent modal parameters of the adaptive gyroscopic damper systems (AGDS), which has gyroscopic damper with the variable moment of inertia and angular momentum. The exact VMM equation is then approximated to linear equation about the fundamental mode of AGDS. Next, a noise reduction approach will be introduced to identify accurate eigen value, which is substituted for the derived equation to identify equivalent modal mass and stiffness of the fundamental mode. To show the effect of the noise reduction approach, an example will be shown using 2-DOF mass spring system. A. Basic formulation in modal space Figure 1. shows the numerical model of AGDS. Preliminary study on the use of variable moment of inertia to the modal mass and stiffness identification has been performed using sensitivity analyses2. We will again treat this model and for formulation of the VMM in modal space. The dynamical equation of AGDS in modal space is written as a linear second-order equation, M(τ )¨ q(t, τ ) + C(τ )q(t, ˙ τ ) + Kq(t, τ ) = U(x)(f (t) + w(t, τ )), y(t, x, τ ) = S(x)q(t, τ ) + e(t, x, τ ),
(1) (2)
where, M(τ ), C(τ ), K, U(x), S(x) are (n × n) matrices, and q(t), f (t), y(t, x, τ ), w(t, τ ) and e(t, x, τ ) are (n × 1) vectors, and t, x is scalar variables, respectively. The q˙ is derivative of q with respect to t. The elements of each matrix and vector are, M(τ ) = Diag(m1 , . . . , mn , Ig (τ )), c¯1 · · · 0 c1 (τ ) .. .. .. .. . . . . C(τ ) = , 0 · · · c¯n cn (τ ) −c1 (τ ) · · · −cn (τ ) cg
(3)
(4) T
K = Diag(k1 , . . . , kn , kg ), q(t) = {q1 , · · · , qn , φ} . The modal parameters are functions of the structural parameters as, � L 2 2 4 mi = ρA {Xi (x)} dx + Mg {Xi (L)} , ci = H(τ )θ(L), ki = (miEI)/(ρA) (λi /L) .
(5)
(6)
0
where, θ(L) = dXi /dx, and H(τ ) is the variable angular momentum. The parameter, λi satisfies following characteristic equation, µλi = (1 + cos λi cosh λi )/(sin λi cosh λi − cos λi sinh λi ).
(7)
where, the mass ratio, µ ≡ Mg /(ρAL). Then, assume that the solution of Eq. (1) as qj (t, τ ) = Qj (τ )esj (τ)t , which is depending on the control parameter, τ (0 ≤ τ ≤ 1). The mode shape Qj (τ ) is defined as, � T Qj (τ ) = Q1 j (τ ), · · · , Qn j (τ ), Φj (τ ) . (j = 1, . . . , n + 1) (8)
3 American Institute of Aeronautics and Astronautics
where, Qi j , i = 1, . . . , n and Φj (τ ) are the modal displacement obtained from the j th mode and the angle of the gimbal, respectively. Substituting q into Eq. (1), the following equations are obtained as, (ki + sj (τ )2 mi )Qi j (τ ) + sj (τ )ci (τ )Φj (τ ) = 0 (i = 1, . . . , n), n
ci (τ )Qi j (τ ) = 0. (kg + sj (τ )cg + sj (τ )2 Ig )Φj (τ ) − sj (τ )
(9) (10)
i=1
It is noted the structural damping, c¯i , i = 1, . . . , n are negelegible for the lightly damped structures. Using Eq. (9) and Eq. (10), � n
ci (τ )2 2 2 kg + sj (τ )cg + sj (τ ) Ig + sj (τ ) Φj (τ ) = 0, ki + sj (τ )2 mi
(11)
i=1
are obtained, and under assumption, Φj (τ ) �= 0, following equation about modal parameters are derived, n
i=1
ci (τ )2 kg + sj (τ )cg + sj (τ )2 Ig =− . 2 ki + sj (τ ) mi sj (τ )2
(12)
The unknown modal parameters, mi , ki , i = 1, . . . , n are thus expressed with the variable parameters of the gyroscopic system, which means the structure has capability to identify the structural models themselves. Although, the real space structures have large number of vibration modes, the first mode is known to behave dominantly in many cases. We approximate the exact VMM into linear one for the identification of the first fundamental mode as follows. First, Eq. (12) is rewritten as, c1 (τ )2 + �(τ ) = Rj(τ) . k1 + sj (τ )2 m1
(13)
where, �(τ ) =
n
i=2
kg + sj (τ )cg + sj (τ )2 Ig ci (τ )2 , Rj(τ) = − . 2 ki + sj (τ ) mi sj (τ )2
(14)
By using two value of the control parameters, τ1 , τ2 , we form the linear equation about the modal mass and stiffness as,
2 � � � 1 sj (τ1 ) c1 (τ1 )2 /(Rj (τ1 ) − �(τ1 )) k1 = . (15) c1 (τ2 )2 /(Rj (τ2 ) − �(τ2 )) m1 1 s2j (τ2 ) If the higher modes can be neglected,
2 � � � 1 sj (τ1 ) c1 (τ1 )2 /Rj (τ1 ) k1 ≈ . m1 1 s2j (τ2 ) c1 (τ2 )2 /Rj (τ2 )
(16)
The VMM in modal space is thus approximated using only the equivalent modal mass and stiffness of the fundamental mode of AGDS. B. Variable Fourier spectrum for noise reduction So far, self-identification of the fundamental mode requires the eigen value, sj (τ1 ), sj (τ2 ) and the gyroscopic parameter, ci (τ1 ), ci (τ2 ). To obtain eigen value and gyroscopic parameter from impulse response data with measurement noise, we propose a noise reduction approach in frequency domain using the difference between two Fourier spectrums. We will use the impulse response data excited by unit inpulse force to obtain Fourier spectrum of the AGDS. We assume that the unit impulse force, δ(t), is given at the tip of cantilevered beam of AGDS and the system noise, w(t) can be neglected. Using continuous time output signal, define the discrete time output signal, y(n, x, τ ) with the appropriate sampling interval, ∆t as, y(n, x, τ ) + e(n, x, τ ) ≡ y(n∆t, x, τ ) + e(n∆t, x, τ ) =
n+1
S(x)Qj (τ )esj (τ)n∆t + e(n∆t, x, τ ).
j=1
4 American Institute of Aeronautics and Astronautics
(17)
where, n = n∆t(n = 0, · · · , N − 1). It is important that Eq. (17) is a function of the τ , hence if we can obtain output signal twice, where first signal is output corresponding to τ1 and second one is output corresponding to τ2 , whereas the property of the measurement noise is less changed, there is a possibility to effectively cancel the noise term as follows: Assume that there is one sensor at the tip of beam, x = L, and the variable angular momentum is adjusted by τ = τ1 , the measured output signal from the sensor can be expressed by using Fourier coeffecient as, y(n, L, τ1 ) + e(n, L, τ1 ) =
N −1
Y (k, L, τ1 )ejk(2π/N )n , (n = 0, · · · , N − 1)
(18)
n=0
with, Y (k, L, τ1 ) =
N −1
(y(n, L, τ1 ) + e(n, L, τ1 ))e−jk(2π/N )n,
(19)
n=0
f (k) = k∆f, (k = 0, 1, . . . , N − 1)
(20)
where, ∆f in Eq. (20) is a frequency resolution as, ∆f = 1/(N ∆t).
(21)
Then, output signal after changing the control parameter from τ1 to τ2 is assumed to be measured and the Fourier spectrum is written as, Y (k, L, τ2 ) =
N −1
(y(n, L, τ2 ) + e(n, L, τ2 ))e−jk(2π/N )n.
(22)
n=0
The difference between two Fourier spectrums amplitude is, ∆Y (k, L, τ1 , τ2 ) = |Y (k, L, τ2 )| − |Y (k, L, τ1 )| ≈| +|
N −1
y(n, L, τ2 )e−jk(2π/N )n | − |
N −1
n=0
n=0
N −1
N −1
n=0
e(n, L, τ2 )e−jk(2π/N )n| − |
y(n, L, τ1 )e−jk(2π/N )n | e(n, L, τ1 )e−jk(2π/N )n |.
(23)
n=0
If the measurement noise is time-invariant, whose frequency bandwidth and amplitude are identical, it is expected the 3rd and 4th terms in Eq. (23) are almost cancelled. Further, we do not have to detect the noise types, such as random or periodic. For noise reduction of original Fourier spectrum, define the refining vector using the spctrum difference ∆Y (k, L, τ1 , τ2 ), ¯ 2 ), L, τ1 , τ2 ), W (k, L, τ2 ) ≡ ∆Y (k, L, τ1 , τ2 )/∆Y (k(τ ¯ 1 ), L, τ1 , τ2 )), W (k, L, τ1 ) ≡ (−∆Y (k, L, τ1 , τ2 ))/(−∆Y (k(τ
(24) (25)
¯ 1 ), k(τ ¯ 2 ) mean the integers corresponding to the peak amplitude of the fundamental frequency. where, k(τ Using W (k), refined Fourier spectrum is written as, YW (k, L, τ2 ) = Y (k, L, τ2 )W (k, L, τ2 ), YW (k, L, τ1 ) = Y (k, L, τ1 )W (k, L, τ1 ).
(26)
Once the refined spctrum is obtained, the spectrum analysis for identification of structural dynamics models can be performed. We think the refined Fourier spectrum is also used to recover the impulse response using inverse discrete Fourier transform (IDFT) followed by time domain subspace algorithms. In summary, the frequency domain self-identification with the noise reduction approach from displacement and angle sensor at the tip of beam is: 1. 2. 3. 4. 5.
Set initial angular momentum by control parameter, τ1 as H = H(τ1 ). Measure impulse response data from displacement sensor, y(n, L, τ1 ) (n = 1, · · · , N ). Measure impulse response data from angle sensor, θ(n, L, τ1 ) (n = 1, · · · , N ). Change control parameter, τ1 to τ2 to change angular momentum to H(τ2 ). Measure impulse response data from displacement sensor, y(n, L, τ2 ) (n = 1, · · · , N ).
5 American Institute of Aeronautics and Astronautics
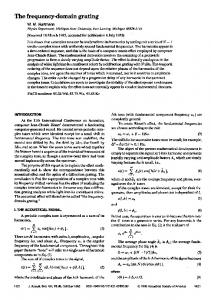
Fig. 2.
2-DOF mass-spring system with variable stiffness device.
5 Noise−added data Noise−free data
4
Displacement (m)
3 2 1 0 −1 −2 −3 −4 0
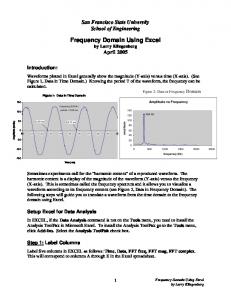
Fig. 3.
6. 7. 8. 9. 10. 11. 12. 13. 14.
20
40
60 Time (sec)
80
100
120
Noise-free and noise-added impulse response of 2-DOF system
Measure impulse response data from angle sensor, θ(n, L, τ2 ) (n = 1, · · · , N ). Calculate DFT, Y (k, L, τ1 ) with y(n, L, τ1 ) and Y (k, L, τ2 ) with y(n, L, τ2 ). Calculate DFT, Θ(k, L, τ1 ) with θ(n, L, τ1 ) and Θ(k, L, τ2 ) with θ(n, L, τ2 ). Calculate refining vectors, W (k, L, τ1 ) and W (k, L, τ2 ) from difference of Fourier spectrums, ∆Y (k, L, τ1 , τ2 ) and the integer, k ∗ (τ1 ) and k ∗ (τ2 ). Calculate refined Fourier spectrum, YW (k, L, τ1 ) and YW (k, L, τ2 ). Calculate sj (τ1 ) from YW (k, L, τ1 ) and sj (τ2 ) from YW (k, L, τ2 ). Calculate ci (τ1 ) with H(τ1 ) and Θ(k ∗ (τ1 )) with respect to YW (k, L, τ1 ). Calculate ci (τ2 ) with H(τ2 ) and Θ(k ∗ (τ2 )) with respect to YW (k, L, τ2 ). Substitute sj (τ1 ), sj (τ2 ) and ci (τ1 ), ci (τ2 ) into Eq. (16) and identify equivalent modal mass and modal stiffness, k1 , m1 .
C. Example of refining with Fourier spectrum difference An example of the proposed noise reduction approach is given using 2-DOF mass-spring system as shown in Fig. 2.. The impulse input force is given at mass of m2 and the impulse response data are measured by collocated displacement sensor. The numerical parameters of the example are k1 = k2 = 1, m1 = m2 = 1, and the first and second modal frequencies of this model are ω1 = 0.6180(rad/s) and ω2 = 1.6180(rad/s), respectively. The first and second value of variable stiffness is kv = 0.0 and kv = 0.8, respectively. Using two impulse response corresponding to the two variable stiffness, the refining vector was calculated with Eq. (25) to refine the Fourier spectrum of the first impulse response with kv = 0.0 We added both random and periodic noise whose natural frequency is 0.2(Hz) to original data. The
6 American Institute of Aeronautics and Astronautics
1.2 Original spctrum Refined spectrum
Fourier amplitude
1
Periodic noise
0.8 0.6 0.4 0.2 0 −0.2 0
Fig. 4.
0.1
0.2 0.3 Frequency (Hz)
0.4
0.5
Refined Fourier spectrum and its original spectrum Table 1.
Parameters for numerical examples.
Gyro parameters: Moment of inertia, Ig (kgm2 ) Inertia of rotor, Ir (kgm2 ) Min. angular velocity, ωmin (rad/s) Max. angular velocity, ωmax (rad/s) Damping coefficient, cg (Nms) Spring constant, kg (Nm/rad) Mass of gyro, Mg (kg)
0.1600 1.5700 × 10⁻⁴ 63.690 636.94 4.0000 × 10⁻⁴ 0.1200 1.9900
Beam parameters: Length, L(m) Width, b(m) Thick, h(m) Density, ρ(kg/m3 ) Young’s modulus, E(N/m2 )
1.8000 1.5000 × 10⁻¹ 1.5700 × 10⁻³ 2.7000 × 10³ 7.0300 × 10¹⁰
signal-to-noise ratio is about 1 as shown in time history of Fig. 3.. We calculated DFT of noisy data, with ∆T = 1(sec), N = 256. Figure 4. shows results of DFT and its refined Fourier spectrum using Eq. (26). It is obvious that the peak of the periodic noise and the spectrum of the random noise in original Fourier spectrum were effectively reduced, whereas the peak of the real first mode at 0.0984(Hz) was kept. The frequency refining is thus useful for noise reduction in the specific case of low signal-to-noise ratio. It shold be noted that although the first mode was identified, the second mode cannot be identified, because the first mode is dominant at the location of the sensor.
III.
Numerical Examples
This section will demonstrate the use of the present self-identification in frequency domain especially for identification problem in presense of high-level measurement noise. Three specific cases will be examined: (1) random noise; (2) periodic noise (sinusoidal signal); and (3) random and multiple periodic noise. A. Numerical model The flexible cantilevered beam with AGD shown in Fig. 1. is taken here as numerical examples. Parameters in the numerical model are shown in Table. 1. These parameters were determined based on the experimental setup in our laboratory. The FE model of the adaptive gyroscopic damper system is constructed for measurement data such as the displacement, the angle of inclines and the eigenvalues. Assuming the Euler-Bernoulli beam, we use
7 American Institute of Aeronautics and Astronautics
Table 2.
H = Hmin
H = Hmax
−0.0011 ± 0.8632i −0.0002 ± 0.8825i −0.0000 ± 11.3658i −0.0000 ± 36.0729i
−0.0006 ± 0.8048i −0.0006 ± 0.9425i −0.0000 ± 11.3933i −0.0000 ± 36.0979i
Mode
Variable angular momentum, H(τ)
1 2 3 4
Fig. 5.
Exact eigen values of AGDS
0.1 Hmax 0.08 H
2
0.06 0.04
H1
δH
δτ
0.02 τ τ1 H 2 min 0 0 0.2 0.4 0.6 0.8 1 Control parameter of variable angular momentum, τ
Variable angular momentum changed by control parameter, fi .
elemental matrix as follows.
156 ρAl 22l Me = 420 54 −13l
22l 4l2 13l −3l2
54 13l 156 −22l
−13l −3l2 , Ke = EI −22l l3 2 4l
12 6l 6l 4l2 −12 −6l 6l 2l2
−12 6l −6l 2l2 . 12 −6l −6l 4l2
(27)
The beam is assumed uniform and has a rectangular section satisfying following equations as, ρA = ρbh, EI = bh3 /12, l = L/ne ,
(28)
In this analysis, the gyroscopic damper was approximated to a point mass, Mg at the tip of beam. Also, the moment of inertia around its attached element was neglected in the modeling. Table 2 gives the eigen values of first four modes calculated from the FE model of AGDS. B. Variable angular momentum for self-identification The control parameter, τ , is introduced to express the change of the variable angular momentum. Figure 5. shows the relation between the control parameter and the variable angular momentum. In this figure, τ1 , τ2 , δτ , H1 , H2 , δH, Hmin and Hmax are the initial control parameter, the post-changed control parameter, the change of control parameter, the initial angular momentum, the post-changed angular momentum, the minimum angular momentum and the maximum angular momentum, respectively. Then, the variable angular momentum is expressed as, H(τ ) = (1 − τ )Hmin + τ Hmax (0 ≤ τ ≤ 1),
(29)
where, Hmin is equal to H(0) and Hmax is equal to H(1), respectively. A set of the control parameters used in the identification is expressed as Cτ = {τ1 , τ2 }. By using Eq. (29), the set gives the initial angular momentum, H1 = H(τ1 ) and the post-changed one, H2 = H(τ2 ) to implement the identification algorithms. Figure 6. shows the relation between the control parameter and the angular momentum for the numerical model. The frequency resolution should be less than the change of the natural frequency caused by the variable parameters. For this numerical model, the required resolution can be determined based on the change of the first natural frequency from Fig. 6..
8 American Institute of Aeronautics and Astronautics
Change of 1st natural frequency (rad/s)
Fig. 6.
0.95 0.94 0.93 0.92 0.91 0.9 0.89 0.88 0 0.2 0.4 0.6 0.8 1 Change of control parameter,τ, for angular momentum
Relation between 1st natural frequency and control parameter, fi for variable angular momentum.
C. Identification results The set of control parameters is Cτ = {0, 1} since this set gives the maximum change of the angular momentum so that the required frequency resolution is not too small value. As shown in Fig. 6., the frequency resolution should be about 0.05(rad/s) at least. The 1200 data was measured at the time interval, 1(sec). Also, we added the zeros after the data so as to fit the data 2N . The resulting resolution is 0.0031(rad/s). For the evaluation of the performance by the proposed techniques, the non-dimensional error, ex is defined as, ep ≡ p/p∗ − 1,
(30)
where, p and p∗ are the identified parameters, mi and ki , and the corresponding true ones, m∗i and ki∗ , respectively. We will show three example self-identification with VMM from noisy data: (1) random noise; (2) periodic noise; and (3) random and multiple periodic noise. All examples treat significantly low signal-to-noise ratio data. Note that all examples treat the single-input and single-output (SISO) problem. The impulse input is given at the tip of beam and the output is measured at the same location. Note that the real part of the eigen value is not identified with proposed method, because the numerical model has no structural damping. 1. Identification from data with random noise The first example of the self-identification with the noise reduction approach is shown as follows. The signalto-noise ration is assumed to be about 0 dB. Before examining the proposed method, we examined the singular value of the Hankel matrix formed with impulse response data, which were measured from eight displacement sensors as follows.
� Y (k) Y (k + 1) · · · Y (k + 1198) H(k − 1) = , (31) Y (k + 1) Y (k + 2) · · · Y (k + 1199) Each response function, Y (k) was 8 × 1 matrix and accordingly, the Hankel matrix, Hrs of 16 rows by 1199 columns was analysed. Figure 7. shows the plot of all of the singular values. From the plot, the difficulty is expected to choose the correct singular values from the set of all non-zero ones. Accordingly, the noise separation using the SVD may be not effective in this case of high-level noise. Then, by using the proposed method, totally 100 times numerical experiments were performed to examine the identification accuracy with the noisy data. The average and deviations of the identification error were shown in Table 3. From the Table, not obvious advantage of the present approach was indicated in the results. This is because the data length is enough to identify the accurate eigen value from the Fourier spectrum without the refining. However, the Fourier spectrums with and without refining are clearly different as shown in Fig. 8..
9 American Institute of Aeronautics and Astronautics
Singular value of Hankel matrix
25
20
15
10
5
0
Fig. 7.
2
4
6
8 Order
10
12
14
16
Singular value of Hankel matrix of data with random noise
0.3 Refined spectrum Original spectrum
Fourier amplitude
0.25 0.2 0.15 0.1 0.05 0 −0.05 0
Fig. 8.
Table 3. error em1 e k1
0.1
0.2 0.3 Frequency (Hz)
0.4
0.5
Fourier spectrum of data with random noise
Identification error from data with random noise
Not refined Fourier spectrum
Refined Fourier spectrum
0.0147 ± 0.0703 0.0177 ± 0.0709
−0.0044 ± 0.1015 −0.0015 ± 0.1024
10 American Institute of Aeronautics and Astronautics
0.3 Refined spectrum Original spectrum
Fourier amplitude
0.25 0.2 0.15 0.1 0.05 0 −0.05 0
Fig. 9.
0.2 0.3 Frequency (Hz)
0.4
0.5
Fourier spectrum of data with periodic noise
Table 4. error
0.1
Identification error from data with periodic noise
Not refined Fourier spectrum
Refined Fourier spectrum
−1.0064 −0.9790
−0.0049 −0.0020
em1 e k1
2. Identification from data with periodic noise The second example using impulse response data disturbed by random noise (sinusoidal signal) demonstrates the use of the noise reduction approach wiht refining vector more clearly. Table 4 shows the non-dimensional error of the identification of the equivalent modal mass and stiffness from data with periodic noise whose frequency is 0.1(Hz). Obvious advantage of the present approach was indicated in the results. Without refining, the correct peak of the system fundamental mode is not easily detected. On the other hand, the incorrect peak of the periodic noise was reduced as shown in Fig. 9.. 3. Identification from data with random and multiple periodic noise Final example treats the identification of the equivalent modal mass and stiffness from the data with random and multiple periodic noise, whose frequencies are 0.1(Hz) and 0.2(Hz). The fundamental frequency is larger than first periodic noise and less than second one. Figure 10. shows that the both random and two periodic noise are clearly reduced by the refining vector.
0.3 Refined spectrum Original spectrum
Fourier amplitude
0.25 0.2 0.15 0.1 0.05 0 −0.05 0
Fig. 10.
0.1
0.2 0.3 Frequency (Hz)
0.4
0.5
Fourier spectrum of data with random and two periodic noises
11 American Institute of Aeronautics and Astronautics
Table 5. error em1 e k1
Identification error from data with random and two periodic noises
Not refined Fourier spectrum
Refined Fourier spectrum
−0.9958 ± 0.0205 −0.9742 ± 0.0145
−0.0037 ± 0.1454 −0.0008 ± 0.1468
We performed totally 100 times numerical experiments to examine the identification accuracy with the noisy data. Table 5 shows the non-dimensional error of the identification. The accurate identification results were obtained with refined spectrum, whereas the error without refining were significantly large. The present approach is thus useful to effectively reduce the effect of the noise and accordingly, the identification of the real system mode is easely detected.
IV.
Conclusions
The frequency domain self-identification method with noise reduction approach using the variable structural parameters was proposed. To reduce the measurement noise, we proposed the noise reduction approach by using the difference between the two Fourier spectrums, where each spectrum is corresponding to the different variable angular momentum. Because the Fourier spectrum corresponding to the measurement noise can be assumed to be constant, the difference between the two spectrums has no spectrum corresponding to the measurement noise. As a result, multiplying the difference between the Fourier spectrums to the two Fourier spectrums reduces the measurement noise of them, and the equivalent modal parameters are identified accordingly. Numerical examples for the frequency domain self-identification of the adaptive gyroscopic damper system were demonstrated to show the feasibility of the proposed method. The impulse response data of the system disturbed by the random, periodic, and both random and periodic noises were treated as the measurement data, where sinusoidal signals were used as the periodic noises. The results indicated that the random and periodic measurement noise were effectively reduced by the two Fourier spectrums changed by the variable angular momentum, and the accurate identification of the equivalent modal parameters was realized.
References 1
Wada, B. K., “Adaptive Structures: An Overview,” J. Spacecraft and Rockets, Vol.27, No.3, 1990, pp. 330-337. 2 Senba, A. and Furuya, H., “System identification of Adaptive Gyroscopic Damper System Using Sensitivity Analysis,” Trans. Japan Soc. Aero. Space Sci., Vol. 47, No. 155, 2004, pp. 30-37. 3 Onoda, J., Endo, T., Tamaoki, H. and Watanabe, N., “Vibration Suppression by Variable-Stiffness Members,” AIAA J., Vol.29, No. 6, 1991, pp. 977-983. 4 Carlson, J. D., Catanzarite, D. M. and St. Clair, K. A., “ Commercial Magneto-Rheological Fluid Devaices,” Int. J. of Modern Physics B, Vol.10, No. 23, 24, 1996, pp. 2857-2865. 5 Furuya, H. and Kobori, A., “Suppression of Multiple Modes Vibration of Flexible Structures with Adaptive Gyroscopic Damper System,” 10th Int. Conf. on Adaptive Structures and Technologies, Technomic Publishing, 1999, pp. 127-134. 6 Ho, B. L. and Kalman, R. E., “Effective Construction of Linear State-Variable Models from Input/output Functions,” Regelungstechnik, Vol. 14, No. 12, 1966, pp. 545-548. 7 Juang, J. and Pappa, R. S., “An Eigensystem Realization algorithms for Modal Parameters Identification and Model Reduction,” J. of Guidance, Control and Dynamics, Vol. 8, No. 5, 1985, pp. 620-627. 8 Moonen, M., Moor, B. D., Vandenberghe, L. and Vandewalle, J., “ On and Off-line Identification of Linear State-space Models,” Int. J. Control, Vol. 49, No. 1, 1989, pp. 219-232. 9 Verhaegen, M. and Dewilde, P., “Subspace Model Identification Part 1. The output-errorstate-space Model Identification Class of Algorithm,” Int. J. Control, Vol. 56, No. 5, 1992, pp. 1187-1210. 10 Overschee, P. V. and Moor, B. D., “N4SID: Subspace algorithms for the identification of combined deterministicstochastic system,” Automatica, Vol. 30, No. 1, 1994, pp. 75-93. 11 Ljung, L. “System Identification-Theory for the User, (Second Edition, Chapter 10), Englewood Cliffs, N.J., Prentice-Hall, 1999. 12 Furuya, H. and Senba, A. “Self-identification with Adaptive Gyroscopic Damper System Using Sensitivity Analyses,” 44th AIAA/ASME/ASCE/AHS/ASC Structures, Structural Dynamics and Material Conf., AIAA Paper 2003-1723, 2003. 13 Senba, A. and Furuya, H. “Variable Matrices Method for Self-identification of Adaptive Gyroscopic Structure Systems,” 45th AIAA/ASME/ASCE/AHS/ASC Structures, Structural Dynamics and Material Conf., AIAA Paper 2004-1980, 2004.
12 American Institute of Aeronautics and Astronautics