Statistical Energy Analysis, in the case of rain-on-the-roof ex- citation, the covariance matrix of modal responses is diago- nal, and, consequently, also the power ...
FREQUENCY RESPONSE FUNCTION VERSUS OUTPUT-ONLY MODAL TESTING IDENTIFICATION
A. Sestieri
and
Dipartimento di Meccanica e Aeronautica
Dipartimento di Energetica
Universita` di Roma “La Sapienza”
Universita` de L’Aquila
Via Eudossiana 18, I 00184 Rome, Italy
Localita` Monteluco, I 67040 Roio Poggio (AQ), Italy
ABSTRACT The identification of modal parameters from frequency and time domains have now reached a high degree of maturity. Several issues have been considered on their for and against, on the possibility of using ambient excitation for large (civil) structures, on the difficulty of identifying scaled modes from output-only data, on the quality of identified parameters when using data derived from either domain. However, a strict comparison between these two techniques was not completely performed, especially when one has the choice of using both of them, as it is typical when testing lab structures. Moreover the identification of coincident modes is a task that cannot be fulfilled by SIMO methods: actually only polyreference or MIMO methods are recognized of this possibility and it is important to state whether only-output tests can provide some information on the subject. In this paper a comparison between FRF and output-only techniques, when applied to a lab structure, is performed: scaled modes are provided for both methods and an estimate on the quality of results assessed.
1
W. D’Ambrogio
INTRODUCTION
Maybe it appears superfluous and old fashioned to speak still about identification of modal parameters, especially in this conference where the subject was dealt so deeply and for so many years. Maybe, but this contribution intends to focus on a subject that, yet widely discussed and assessed, still deserves some attention for a full comprehension: we are speaking about the comparison between FRF methods and output-only methods for modal parameters estimation. It should be clear to everybody involved in modal analysis that the methods that identify the modal parameters from some elements of the FRF matrix require a simultaneous measurement of both excitation and response. From the FRF matrix the modal parameters can be identified using any of the available techniques in the frequency domain (single or multi modes estimation, circle fit, line fit, etc.), or, less usually, in
the time domain (CE: Complex Exponential and LSCE: LeastSquare Complex Exponential, PRCE: Polyreference Complex Exponential [1]). It should also be quite clear that the chance of applying and measuring the desired excitation becomes quite hard when the structure is very large, such as a building or a bridge, and it is about 30 years that suitable techniques were proposed to deal with the problem of modal identification when the excitation (input) cannot be measured or is not available. The first basic and fundamental works in this area are due to S. Ibrahim (ITD: Ibrahim Time Domain [2,3]) and to the application of ARMA models [4,5]. Quite soon they were followed by the ERA: Eigensystem Realisation Algorithm [6]. All these methods are time-domain methods, where only the output is available, while the excitation is provided, but not measured, by any natural, ambient excitation such as the wind on a bridge, traffic, earthquakes etc. It is even possible to stress that, in general, until the 90’s, time and frequency domain identification methods implied in turn the use of output data only or the use of a FRF data, determined from measurement of both input and output. Advantages and disadvantages of any of these methods were often discussed: they will not be specifically presented here because complete and useful references can be found in the IMAC Proceedings as well as in many books, e.g. [7]. Maybe it is just the case of recalling that, usually, time domain methods, yet particularly appropriate to identify close modes, were not considered particularly efficient in estimating the modal damping, they do not provide directly scaled modes, and, particularly, they were felt as more mathematical and less intuitive than the frequency methods. Therefore, whenever possible, those involved with lab or mechanical structures continue to use frequency domain techniques while only those involved with large structures become real fans of time domain techniques. Recently this scenario begun to change or will change in the future because of efficient techniques developed with outputonly data in the frequency domain: we refer specifically to the FDD technique: Frequency Domain Decomposition [8] and
EFDD: Enhanced Frequency Domain Decomposition [9]. Apparently there are not particular reasons to think that outputonly data are necessary or convenient to identify the modal parameters of lab and/or mechanical structures. However there are situations where this is the case or, simply, the use of output-only data can be more convenient. A simple example is the case of the identification of the modal parameters of tyres, that, when not loaded, present coincident modes: although MIMO or polyreference techniques can be appropriately used to recognize the existence of coincident modes, output-only methods seem to have this chance also, providing this information simpler and faster: however this possibility has not yet been assessed clearly. Another and definite reason to use output-only data would be the simplicity of conducting a modal test, provided that the minor efforts devoted to it does not affect the quality of the identified parameters. These are conditions that we met in tests appropriately performed. Although it does not mean that in the future this will be the technique that we will use more, for the same reason it will not drive us in the direction of avoiding output-only tests. The basic ideas of these techniques will be recalled hereafter, and the application to a lab structure (a simple plate) will be shown, by comparing results obtained by circle and line fits with those available from output-only data. Other tests, under development, are performed on a tyre, trying to reach some useful information on the argument of coincident modes. The possibility of obtaining scaled modes is also discussed and a comparison of scaled modes obtained from standard FRF measurements and output-only data is presented.
2
FREQUENCY DOMAIN DECOMPOSITION: FDD
The vibration response of a linear system can be obtained as the superposition of its normal modes as: {w(t)} = [Φ] {q(t)}
(1)
where [Φ] is the matrix of the system eigenvectors and {q(t)} the vector of modal coordinates. For a random stationary process, the covariance matrix of responses is: � � [Rw (τ )] = E {w(t)}{w(t + τ )}T = i h E [Φ] {q(t)}{q(t + τ )}T [Φ]T Since modeshapes are independent of the random process, one can also write h i [Rw (τ )] = [Φ] E {w(t)}{w(t + τ )}T [Φ]T = [Φ] [Rq (τ )] [Φ]T (2) where [Rq (τ )] is the covariance matrix of the modal coordinates. The Fourier transform of covariance is the power spectral density, so that, by Fourier transforming, one obtains: [Sw (f )] = [Φ] [Sq (f )] [Φ]T
(3)
If one now assumes the the excitation is uncorrelated, as in the case of an ambient random excitation or, as typical in Statistical Energy Analysis, in the case of rain-on-the-roof excitation, the covariance matrix of modal responses is diagonal, and, consequently, also the power spectral density of the modal responses [Sq (f )] is diagonal. Moreover, since the diagonal terms of the spectral density matrix are the auto spectral density terms, they are intrinsically real and positive. If one now performs the singular value decomposition of a general matrix [A], one has: [A] = [U] [`Σ ] [V]T ` where [`Σ ] is the diagonal matrix of singular values, while [U] ` and [V] are orthogonal matrices whose columns are called left and right singular vectors. They are the eigenvectors of [A] [A]T and [A]T [A], respectively. If [A] is square and symmetric, it is of course [U] = [V], so that we have: [A] = [U] [`Σ ] [U]T `
(4)
By comparing the expression of the singular value decomposition (4) with equation (3) and considering that [Sq (f )] is diagonal, one could stress that, if [Φ] would be orthogonal, the SVD of the measured response spectral matrix [Sw ] at a frequency line f would permit to identify the modal matrix [Φ] as the matrix of singular vectors [U], so that it would be possible to determine the whole modal matrix from a single spectral line. Unfortunately, [Φ] is not generally orthogonal ([Φ]T [Φ] 6= [`I ]). However, in this case, by considering the ` spectral line where a single mode is dominant, a good estimate of a modeshape can be determined by the singular vector corresponding, for the analyzed frequency, to the highest singular value (σ1 ). In fact, one can write explicitly the SVD by isolating the largest singular value as: [A] = {U1 }σ1 {U1 }T +
m X {Ui }σi {Ui }T
(5)
i=2
while, by isolating the r-th mode, from equation (3) one obtains: m X {Φi }Sqi (fi ){Φi }T (6) [Sw (f )] = {Φr }Sqr (fr ){Φr }T + i=1,i6=r
A comparison between these last two relationships shows that, when neglecting the sums, the singular vector corresponding to the first singular value (the largest) is certainly a good approximation for the r-th mode in that the effect of the adjacent modes is minimum. Of course, by this procedure the identified modes are not correctly scaled - the mass matrix of the system is unknown and the scaling factors are dependent on the unknown (unmeasured) excitation - so that an appropriate scaling procedure must be developed to obtain correctly scaled modeshapes and, more specifically, modeshapes scaled to unit modal mass matrix. A specific procedure to obtain this goal is described in section 4.
3
THE ENHANCED FREQUENCY DOMAIN DECOMPOSITION (EFDD)
The FDD is generally a good approach to estimate natural frequencies and modeshapes but cannot be used to identify the modal damping. The EFDD provides this information and a better estimate of the previous modal parameters. It performs a detailed analysis in the neighborhood of a natural frequency identified by the FDD, by means of a suitable use of the MAC that identifies, for each mode, a single degree of freedom spectral density of the response and puts to zero the rest of the response. In this way the spectral response of a single degree of freedom is obtained so that it can be transformed back to the time domain and the modal parameters of such single DOF system determined by simple operations. A suitable frequency interval for the analysis of each single mode, identified by the FDD, is determined by using an appropriate MAC threshold value. In the neighborhood of a picked frequency corresponding to an FDD identified modeshape, a MAC is computed between the reference vector and the singular vectors in the selected range. If the largest MAC value of this vector is above the threshold MAC value, the corresponding singular value is considered in the response of that modal coordinate, while the others are put to zero. To improve the modes estimate, the singular vectors are weighted by the MAC values determined above. At this point damping and natural frequency of that mode are estimated by inverse transforming the single DoF spectral bell into the time domain, which provides a single DoF correlation function, by a simple regression analysis. This correlation function is an almost damped harmonic response, so that the natural frequency can be estimated by the harmonic period and the damping by the log decrement of this damped signal.
4
SCALING OF OPERATIONAL MODESHAPES
Few proposals have been made recently to scale appropriately the determined modeshapes identified from output-only data. The most simple and advantageous seem to be those based on the sensitivity of the modal parameters, particularly eigenvalues, to lumped mass changes on the tested structure. This approach requires an additional test but it is apparent that it permits to have good results, provided that the applied mass(es) are exactly known, by measuring simply the natural frequency shifts between the original structure and the mass-modified one. The approach followed in this work refers explicitly to a recent proposal by Parloo et al. [10]. Although the method used is exactly the method proposed in that paper, the derivation of the scaling formula is slightly different. In fact an undamped (or very lightly damped) system with real modes is considered here. However the approach can be quite easily generalized to provide the same formulas presented in [10]. For an undamped discrete system, the eigenvalue problem is given by: ([K] − λ [M]){Ψ} = 0.
The sensitivity of the system eigenvalues to a parameter variation (specifically, here, a lumped mass variation located at DoF k, that must be a DoF where the response was originally measured) can be determined from the previous equation as: � � ∂ [K] ∂ [M] ∂{Ψ} ∂λ −λ − [M] {Ψ}+([K]−λ [M]) =0 ∂mk ∂mk ∂mk ∂mk
The derivative of the stiffness matrix is obviously zero. Premultiplying by {Ψ}T , the second term on the right hand side is identically zero for the symmetry of the mass and stiffness matrices, so that one has: −λ{Ψ}T
∂ [M] ∂λ {Ψ} − ({Ψ}T [M] {Ψ} = 0 ∂mk ∂mk
(7)
By assuming now that only a single mass is varied at DoF k and that the normalization condition {Ψ}T [M] {Ψ} = bi (bi = 1 for unit modal mass) is used, one obtains: 2
λi Ψi,k ∂λi =− ∂mk bi
(8)
where λi = ωi2 for undamped systems (real modes). Usually in output-only modal analysis the identified modes {Φ} are not scaled, so that we can relate the unscaled modes to those ({Ψ}) scaled to bi by the following relationship: {Ψ}i = αi {Φ}i
(9)
so that, by substituting it into equation (8) and passing from the derivatives to the finite differences, one finally obtains (compare [10]): s −bi ∆λi αi = (10) λi Ψ2i,k ∆mk This is a first order approximation in that differential quantities are substituted by finite differences, that could be affected by (more or less significant) changes in the modeshapes. If instead of a unique mass variation at a single DoF, the mass is varied at a set of DoFs N , the previous equation simply corrects into: s −ai ∆λi αi = (11) P 2 λi N k=1 Ψi,k ∆mk
Finally if the modes are to be normalized to unit modal mass (bi = 1) the unknown scaling factor is obtained as: s s −(∆ωi )2 −2∆ωi αi = (12) ' PN PN 2 2 ωi k=1 Ψ2i,k ∆mk ωi k=1 Ψi,k ∆mk being ∂ωi2 /∂mk = 2ωi ∂ωi /∂mk .
By the previous expressions it is possible to obtain any wished scaling of the modeshapes identified from the output-only experiment by performing a second test where some mass(es) is added on the measured DoFs. The mass variation (either add or removal) creates a shift on the natural frequencies of the system. The estimate of such shift, together with the knowledge of the original modal parameters is sufficient to yield the scale factor αi . Of course the mass variation must be small enough to permit a first order approximation while it should be appropriately located to permit a significant measurable shift of the natural frequencies. This is actually a critical point, possibly the real weakness of the method, because small differences in the shift estimation can lead to significant errors in the determination of the scaled factor. This consideration allows to state that mass variations at different DoFs would allow better estimates than a single variation, provided that they are still sufficiently small to stress that the modeshapes are not significantly changed by these new mass variations (see also [11]). Therefore the method must be appropriately optimized, by performing a careful analysis on the mass distribution and location(s).
5
ments, the plate was loaded by discrete masses, equal to the accelerometers’ mass (7 gr) lumped at the 20 measurement positions. (With this added masses the weight of the plate becomes 0.94 kg). When performing each set of measurements, the accelerometers were appropriately located and the corresponding masses removed. To obtain free support conditions the plate was suspended through a wire, leading to rigid body modes within the first 3 Hz, while the first natural frequency of the free plate ranges around 80 Hz.
17
18
19
20
13
14
15
16
9
10
11
12
5
6
7
8
1
2
3
4
RESULTS AND COMPARISONS
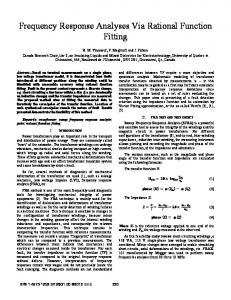
To test the features and accuracy of output-only methods, two sets of tests are performed: the first one on a simple freesupported plate, the second on an automotive tyre. The first test on the plate is aimed to perform a complete comparison between the modal parameters identified from traditional FRF data - a SIMO method - where a single excitation (hammer impulse) and a set of responses (accelerations) were measured, and those determined from output-only data when applying an uncorrelated random excitation along the plate (type-rainon-the-roof force applied for about 15 seconds). The modal parameters extracted from the FRF measurements were determined by using the ICATS code (Imperial College) while, for the output-only data, the ART&MIS (SVS) code (FDD and EFDD) was used. The comparison was aimed to establish both the accuracy of the identified parameters as well as the simplicity and rapidity in performing the tests. The plate was chosen because it is a very simple structure, and the tests are well controllable and easy to perform. For the same reason, some conclusions can go lightly astray. The second test on the tyre, yet under development, is aimed to analyze the features of the output-only method on a more complex mechanical structure, trying to enlightening the possibility of determining double modes. This analysis is not yet concluded and results will be presented soon in the future. The plate considered is a rectangular aluminum plate, size 0.3 × 0.34 × 0.003 m, whose total weight is 0.8 kg. The edge dimensions of the plate were chosen similar to have close modes. For both the tests the response was measured on a grid of 20 points, uniformly distributed (figure 1). Since only 5 equal accelerometers were used together in performing the test, to avoid resonance shifts during each set of measure-
Figure 1: Flexural tested plate
For the SIMO test, an impact excitation was provided by a hammer with a rubber tip and the drive point was appropriately chosen to avoid nodal points (point 16 of the structure shown in figure 1). With this excitation a significant FRF was determined until 600 Hz, in which range 7 modes are observed. The modal parameters were extracted by using a simple circle-fit code, providing the modal parameters shown in table 1. TABLE 1: Modal parameters identified from FRFs Mode n. 1 2 3 4 5 6 7
Nat. freq. fn [Hz] 81.0 118.4 163.9 201.5 218.3 346.3 423.8
Damping ηn % 2.41 1.71 1.44 0.99 0.86 0.57 0.65
For the output-only test, a reference node at location 21 (figure 1) was used for all the measurement sets - 4 accelerations simultaneously measured and moved for each of the 5 sets, plus the reference accelerometer, kept fixed at node 21. The excitation used was made by an uncorrelated series of impulses applied across the surface of the plate for 15 seconds.
TABLE 2: Modal parameters identified from output-only measurements Mode n. 1 2 3 4 5 6 7
Nat. freq. fn [Hz] 80.5 118.2 163.8 201.4 218.1 345.5 423.5
Damping δn % 1.25 0.90 0.75 0.50 0.45 0.31 0.35
TABLE 3: Diagonal elements of the MAC between ICATS modes and ART&MIS modes 1 0.983
5.1
2 0.950
3 0.983
Mode 4 0.948
5 0.919
6 0.974
7 0.944
Scaled modes
The modeshapes obtained from ICATS are normalized to unit modal mass, while those from ART&MIS are unscaled. To perform a normalization to unit mass the procedure exposed in section 4 is followed. The need to extend the results of that section to complex modes was not necessary, considering the small amount of damping and the effective dominance of the real part of the modes with respect to the imaginary part. Two different tests were performed to check the validity of the method in different situations. Initially 3 equal masses of 10 gr were located at different nodes of the plate (3,9,15). The
1 0.8 MAC
These measurements need, in summary, a definite lower attention than the SIMO test and lead to much simpler and faster test conditions. Of course this advantage increases with the structure’s dimensions and anytime an exact estimate of the applied force is required. The use of the FDD and EFDD permitted to identify the modal parameters: table 2 provides the estimated natural frequencies and dampings. They may be compared with those determined from the SIMO method: it can be observed that, while the natural frequencies match quite perfectly, the dampings determined from the FRF are almost double than those determined from the output-only approach. This is not in fact an error, because the ICATS code uses a model with structural damping (ηn ) while in ART&MIS a viscous model (δn ) is assumed: for low values of damping, the first is almost double than the second. A comparison between the identified modes was obtained by performing a MAC between the two sets of modeshapes. The results of this MAC are shown in figure 2 and the diagonal terms of the MAC matrix are presented in table 3. There is no doubt about the very good agreement between the identified modes. Also a visual inspection of the relative modeshapes confirms this agreement and the coincidence of the nodal lines.
0.6 0.4 0.2 0 1 2 3 4 5 6 7
1
2
3
4
5
6
7
Figure 2: MAC between ICATS and ART&MIS identified modeshapes
choice for the mass weights was made after checking that lighter masses led to too small shifts of the natural frequencies, that would imply a large influence of random errors on the estimate of such shifts, leading to significant errors when computing the normalization factor. On the contrary, larger masses would have changed significantly the vibration modes and diminished the validity of the sensitivity approach. The second test considered only a single mass of 27 gr located at point 16. (This second test was more critical because the chosen point would not be too close to a nodal line, thus jeopardizing the possibility of scaling that particular mode). Since the case with distributed masses was at the end more precise, only the results of this test are presented. In table 4 the original and modified frequencies for each mode are shown, together with the normalization factors α for each mode. In figure 3 the MAC between the original and modified modes are presented, confirming that, after the modification, they do not change significantly.
TABLE 4: Natural frequencies of original and modified structures, and normalization factor Mode n. 1 2 3 4 5 6 7
Original fn 80.5 118.2 163.8 201.04 218.1 345.5 423.5
Modified fn 80.23 114.05 162.7 196.7 215.4 339.7 414.4
Scaling factor α 2.36 2.05 2.63 2.22 2.72 2.31 1.98
By applying the determined normalization factor the outputonly modes are normalized to unit mass and can be compared with those determined from ICATS. To this aim the norm of the eigenvectors was computed and compared by considering their ratio. They are presented in table 5. As it can be observed the ratio is not exactly 1, and errors range from
As well, EFDD behaved quite well in estimating the modal damping of the plate, but it is still hard to stress how it behaves for coupled modes or for high modal overlap, when even the FRF techniques become less precise.
MAC
1
0.5
ACKNOWLEDGEMENTS
0 1 2 3 4 5 6 7
1
2
3
4
5
6
Although we are good friends with Rune Brincker and we must thank SVS for providing a full license of ART&MIS for research activity at the University of Rome, we are not financially supported by SVS. Therefore our positive comments on outputonly modal identification and ART&EMIS are actually sincere.
7
Figure 3: MAC between the modeshapes of the original and modified structures REFERENCES
TABLE 5: Norm ratio between identified modes scaled to unit modal mass 1 0.995
2 0.924
3 0.979
Mode 4 0.960
5 1.027
6 1.007
7 0.951
0.1% to 8%, after a careful choice of the mass weight and location points. This shows a high sensitivity of the method to the frequency shifts and their estimate, thus requiring a detailed analysis of the proposed procedure. The method in fact needs an accurate estimate of the natural frequencies of both the original structure and the modified one.
6
CONCLUSIONS
A comparison between modal parameters identified from traditional FRF measurements and from output-only measurements on standard lab structures was carried out, showing that the second approach can be performed usually more simply and fast than the first one. The accuracy of results (including damping) is also very good, at least when dealing with simple structures that do not present too close modes, as in the test performed on the plate. The more significant test on the tyre is not yet concluded so that general assessments can not be done: certainly it is a prerogative of time domain methods to recognize the existence of coincident or very closed modes, but this possibility has not yet been analyzed with the frequency domain techniques (FDD and EFDD) of output-only methods. In any case, especially for closely spaced modes, output-only methods seems to have an advantage on the other traditional modal testing techniques: it is possible to use moving loads which is sometimes a very efficient type of loading. In fact: • moving the load over a reasonable part of the structure it is possible to excite all the modes; • this is a very good multiple-input excitation: it is in principle an infinite input applied to an infinite number of points.
1. Brown D.L., Allemang R.J., Zimmerman R., Mergeay M., Parameter estimation techniques for modal analysis, SAE Technical Paper Series, n. 790221, 1979. 2. Vold H., Rocklin G.T. The numerical implementation of a multi-input modal estimation method for minicomputers, Proc. 1st IMAC, Orlando (Fla), 1982. 3. Ibrahim S.R., Mikulcik E.C. The experimental determination of vibration parameters from time responses, The Shock and Vibration Bulletin vol. 46(5), 187-196, 1976. 4. Ibrahim S.R., Mikulcik E.C. A method for the direct identification of vibration parameters from the free response, The Shock and Vibration Bulletin vol. 47(4), 183-198, 1977. 5. Gersh W., Luo S. Discrete time series synthesis of randomly excited structural system response, J. of Acoustical Society of America, vol. 51(1), 402-408, 1972. 6. Gersh W. On the achievable accuracy of structural system parameter estimates, J. Sound and Vibration, vol. 34(1), 63-79, 1974. 7. Juang J.N., Pappa R.S. An eigensystem realization algorithm for modal parameter identification and model reduction, J. of Guidance, Control and Dynamics, vol. 8(5), 620-627, 1985. 8. Brincker R., Zhang L., Andersen P. Modal identification of output-only systems using frequency domain decomposition, Proc. European COST F3 Conf. on System Identification and Structural Health Monitoring, Madrid (Spain), 2000. 9. Brincker R., Zhang L., Andersen P. Modal identification from ambient response using frequency domain decomposition, Proc. 18th IMAC, S. Antonio (Texas), 2000. 10. Parloo E., Verboven P., Guillaume P., Van Overmeire M. Sensitivity-based operational mode shape normalization, Mechanical Systems and Signal Processing, vol. 16(5), 757-767, 2002. 11. Brincker R., Andersen P. A way of getting scaled modes shapes in output-only modal testing, 21th IMAC, Orlando (Fla), 2003.


![enjoy Dialogue compliments of Duke Ce - Duke People [PDF]](https://m.moam.info/img/260x300/enjoy-dialogue-compliments-of-duke-ce-duke-people-_64cfaca1098a9ed3728b46e0.jpg)


