Department of Mechanical and Aerospace Engineering ... models are developed using Timoshenko beams .... 12000, and 16000) rpm for the solid holder free.
FREQUENCY RESPONSE PREDICTION FOR ROTATING TOOLHOLDER-SPINDLE ASSEMBLIES Chihung Cheng, G. Scott Duncan, and Tony L. Schmitz Department of Mechanical and Aerospace Engineering University of Florida, Gainesville, FL, USA
Conventionally, the tool point FRF is measured at zero speed and is presumed to remain constant at different spindle speeds. However, researchers have reported FRF shifts at higher spindle speeds, which are typically ascribed to gyroscopic or other effects. In this paper, we present an approach for predicting rotating tool point FRFs by coupling FRFs of the spindlemachine substructure (identified using a simple geometry standard holder and inverse receptance coupling techniques [1]) to models of the tool-holder substructure. The tool-holder models are developed using Timoshenko beams including gyroscopic effects [2]. Experimental identification of the spindlemachine FRF at speed poses a number of challenges. These include runout, variations in the spindle thermal state, and noise. In this work, a time-domain technique for runout removal is presented. Tool point predictions and experimental validations are provided for a commercially-available spindle using various tool blank-holder combinations. RUNOUT SIGNAL FILTERING Runout of the measurement surface during rotating FRF measurements leads to unwanted
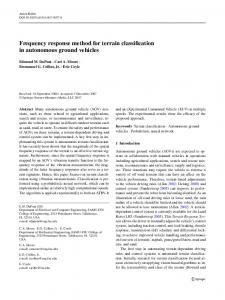
content at the spindle rotation frequency. Contributors include spindle axis of rotation errors from bearing wear or misalignment, as well as the target surface itself. The runout magnitude exerts considerable influence on the FRF by producing false frequency content. Therefore, runout effects must be removed prior to converting the data to the frequency domain. The technique implemented here is to numerically remove the runout signal by applying a time domain filter to the recorded data. A laser tachometer was used to segment the vibration signal into numerous single revolution sections. The sections prior to the hammer impact are selected to construct an average runout signal that is subtracted from the recorded data. This sequence is repeated over 50 separates files (impacts) and the results averaged to reduce the noise level. Figure 1 shows the original and filtered signals. The target was excited at t = 0.05 s. 5 original filtered
4 3 Voltage (V)
INTRODUCTION High-speed machining (HSM) is an important process for discrete part manufacturing because it can provide high material removal rates together with good surface finish and part accuracy. To realize these benefits, stability lobe diagrams, which define regions of stable cutting as a function of spindle speed and axial depth of cut, can be applied. Computation of these diagrams requires that the dynamics of the cutting system (the tool-holder-spindle-machine assembly) as reflected at the tool point be known. However, due to the diversity of available tools and holders, it is time consuming to perform impact testing, where a modal hammer is used to excite the tool point and the vibration response is measured using an appropriate transducer, on each combination.
2 1 0 -1 -2 0
0.05
0.1 Time (s)
0.15
0.2
Figure 1: Time domain vibration signal filtering SPEED-DEPENDENT FRF Due to a number of sources (e.g., gyroscopic effects, bearings stiffness variation, mass unbalance, thermal changes, surface contact effects), the natural frequencies of the toolholder-spindle are known to vary as a function of spindle speed. Figure 2 shows the varying FRFs at three selected spindle speeds for a 19 mm diameter, 77 mm overhang carbide tool blank
clamped in a shrink fit tool holder. To minimize thermal effects, all measurements were taken after a 40 min. stabilization period. Real (m/N)
1
x 10
-6
I II
0
-2
Imag (m/N)
x 10
OD (mm) 63.3 52.7
ID (mm) 44.6 0
Length (mm) 62.8 16.3
The notation for the structural receptances is: R: single structure receptance matrix RS: subassembly receptance matrix G: full assembly receptance matrix GS: partial assembly receptance matrix
-1
1
Table 1: Standard holder substructure dimensions.
-6
0 0 rpm 10000 rpm 16000 rpm
-1 -2
0
500
1000 1500 Frequency (Hz)
2000
2500
Figure 2: FRF speed dependence for a tool blank-shrink fit holder-spindle assembly. ANALYTICAL TOOL TIP RESPONSE
Each receptance matrix is composed of four receptance elements H (displacement to force), L (displacement to moment), N (rotation to force), and P (rotation to moment). The standard holder-spindle assembly displacement to force receptances are obtained by placing the sensor at coordinate 4 and the exciting the structure at the coordinates 4 ( H 44 )
In industrial applications, high-speed milling machines are typically equipped with a tool magazine that contains a number of tools-holder combinations. To reduce measurement time, it is preferred to predict the tool tip FRF rather than performing an impact test on each assembly.
and 4a ( H 44 a ). L44 is determined by first order
Receptance Coupling Sunstructure Analysis (RCSA) was used in this study to couple spindle base receptances (identified experimentally at speed) to tool-holder models (based on Timoshenko beam theory).
where S is the distance between 4 and 4a (25.4 mm). By reciprocity, L44 = N 44 . P44 is synthesized as:
A simple geometry steel “standard holder” (Figure 2, Table 1) was used to determine the spindle base receptances, R6 a 6 a . The first subscript for this 2x2 matrix indicates the sensor location while the latter indicates the hammer impact location. 4
4a 5
5a 6
6a
finite difference:
L44 =
H 44 − H 44 a , S
(1)
2
L N L P44 = 44 44 = 44 . H 44 H 44
(2)
The standard holder-spindle receptance matrix is then:
⎡H G44 = ⎢ 44 ⎣ N 44
assembly
L44 ⎤ . P44 ⎥⎦
(3)
Given G44 , the spindle base receptance matrix
R6 a 6 a is obtained by decoupling the extended holder:
S
R6 a 6 a = RS 46 (RS 44 − G44 ) RS 64 − RS 66 , (4) −1
I
II
Extended holder
Spindle-holder base
Figure 3: Standard holder geometry
where the extended holder receptances are determined from beam models.
RS 44 = R44 − R45 ( R55 + R5 a 5 a ) −1 R54 −1
RS 66 = R66 − R65a ( R55 + R5 a 5 a ) R5 a 6
(5) (6)
RS 46 = R45 ( R55 + R5 a 5 a ) −1 R5 a 6
(7)
RS 64 = R65a ( R55 + R5 a 5 a ) −1 R54
(8)
Real (m/N)
1
x 10
-7
0.5 0
5 5a
-0.5
3 3a
-1
5 Imag (m/N)
EXPERIMENTAL RESULTS To validate the FRF predictions, experiments were conducted using a simply geometry solid holder (Figure 6 and Table 2). This holder meets the assumption of the rigidly connected beam sections. 6 6a
4 4a
1 2 2a x 10
-8
0 -5
0 rpm 9000 rpm 12000 rpm
-10 -15
0
500
1000 1500 Frequency (Hz)
2000
2500
I
II
III
IV
V
Figure 4: Standard holder H 44 results at various spindle speeds.
Figure 6: Solid holder geometry and coordinates.
Due to the speed dependence, the standard holder measurements are performed at multiple speeds within the spindle speed range of interest. See Fig. 4.
Table 2: Solid holder substructure dimensions. OD (mm) ID (mm) Length (mm) 22.0 0 11.2 I 33.3 0 13.5 II 41.3 0 13.2 III 47.4 0 11.6 IV 52.6 0 13.1 V
Encoder Laser Tachometer
Figure 7 shows a comparison between FRF measurements and predictions at {10000, 12000, and 16000) rpm for the solid holder free end. Good agreement is observed. The zero rpm measurement is also shown to identify the changes in the FRF. 1 Real (m/N)
EXPERIMENTAL SETUP Figure 5 shows the FRF measurement setup for the standard holder. Measurements were performed on a Mikron UCP 600 Vario milling machine equipped with a Step Tec 20000 rpm, 16 kW spindle. A Lion Precision C1-C capacitance probe was used to record the vibration response and a PCB 086B03 impact hammer was used to excite the system. A TTI LT-880 laser tachometer was used to record the once per revolution signal for runout filtering. A MLI MetalMax 6.0 data acquisition system was used for data collection.
x 10
-7
0 measured 10000 rpm measured 12000 rpm measured 16000 rpm predicted 10000 rpm predicted 12000 rpm predicted 16000 rpm measured 0 rpm
-1 -2
Imag (m/N)
1
Capacitance Probe
Figure 5: Standard holder rotating FRF measurement setup.
-7
0 -1 -2 -3
Standard Holder
x 10
300
600
900 1200 Frequency (Hz)
1500
1800
Figure 7: Solid holder FRF prediction and measurement at {10000, 12000, and 16000} rpm.
Table 3: Collet holder with 12.7 mm diameter carbide blank. Here, I represents the tool overhang section and II to V represent the extended holder sections. OD (mm) ID (mm) Length(mm) 12.7 0 127.0 I 62.7 0 25.5 II 42.0 12.7 20.6 III 42.0 35.1 11.5 IV 42.0 0 34.0 V
Real (m/N)
2
x 10
-5
0 -1
1 Imag (m/N)
Real (m/N)
x 10
-6
0.5 0 -0.5 -1
5
x 10
-7
0 measured 10000rpm predicted 10000rpm measured 0rpm
-5 -10 -15
500
1000 1500 Frequency (Hz)
2000
2500
Figure 9: FRF for collet holder with 25.4 mm diameter carbide blank. Again, the RCSA approach provides reasonable predictions. Changes in the measured and predicted rotating FRFs relative to the zero rpm measurements are observed.
1
-2 x 10
-5
0 measured 10000rpm predicted 10000rpm measured 0rpm
-1 -2 -3
500
1000 1500 Frequency (Hz)
2000
2500
Figure 8: FRF for collet holder with 12.7 mm diameter carbide blank. Table 4: Collet holder with 25.4 mm diameter carbide blank
I II III IV V
1
Imag (m/N)
To further verify the approach, two 152.4 mm carbide tool blanks (12.7 mm and 25.4 mm diameters) were inserted in a Regofix collet holder. The overhang length was 127 mm in both cases. The dimensions of the tool-holder combinations are listed in Tables 3 and 4. The spindle speed was 10000 rpm.
OD (mm) 25.4 62.7 42.0 42.0 42.0
ID (mm) 0 0 25.4 35.1 0
Length (mm) 127.0 25.5 20.6 11.5 34.0
CONCLUSIONS This paper describes the application of Receptance Coupling Substructure Analysis (RCSA) to frequency response predictions for rotating tool-holder-spindle assemblies. Standard holder measurements are performed at speed to identify changes in the spindle. Then the spindle FRFs are coupled to Timoshenko beam models of the tool and holder. To improve prediction quality, it was necessary to implement time domain filtering to remove runout and averaging to reduce noise. Experimental results show good agreement with prediction and identify the variation in frequency response with spindle speed for the spindle tested here. ACKNOWLEGEMENTS This work was supported by the National Science Foundation (DMI-0238019) and TechSolve. REFERENCES 1. Schmitz, T., and Duncan, G.S., 2005, ThreeComponent Receptance Coupling Substructure Analysis for Tool Point Dynamics Prediction, Journal of Manufacturing Science and Engineering, 127/4: 781-790. 2. Nelson, H.D., 1980, A Finite Rotating Shaft Element Using Timoshenko Beam Theory, Journal of Mechanical Design, 102: 793-803.