The test for sufficient homogeneity was performed according to ISO 13528:20054 and the International. Harmonized Protocol for the Proficiency Testing of ...
PROFICIENCY TEST ON THE DETERMINATION OF PCDD/FS AND PCBS IN GRASS MEAL Kotz A1, Malisch R1, Wahl K1, Hädrich J1, Bitomsky N1, Adamovic K1, Gerteisen I1, Leswal S1, Podestat U1, Schächtele J1, Stumpf C1, Tritschler R1, Winterhalter H1 1
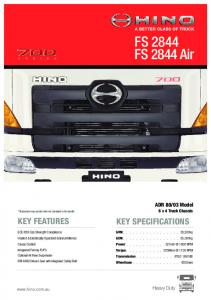
European Union Reference Laboratory (EU-RL) for Dioxins and PCBs in Feed and Food, State Institute for Chemical and Veterinary Analysis (CVUA), Freiburg, Germany Introduction The European Union Reference Laboratory (EU-RL) for Dioxins and PCBs in Feed and Food, Freiburg, Germany, organizes proficiency tests (PTs) for National Reference Laboratories (NRLs) of EU member states, and in addition also for official laboratories of these countries periodically twice a year. Besides the organization of PTs for PCDD/Fs and PCBs in different food matrices, the EU-RL for Dioxins and PCBs organized two interlaboratory studies on extraction methods for PCDD/Fs and PCBs in mineral feed additives in 2006 and 20071,2. From these interlaboratory studies and further tests at the EU-RL recommendations were drawn for the extraction of mineral feed additives and problematic premixtures and compound feed. Between February and April 2011, a PT on the determination of PCDD/Fs, dioxin-like PCBs (DL-PCBs) and six indicator PCBs (non dioxin-like PCBs (NDL-PCBs)) in grass meal was organized by the European Union Reference Laboratory (EU-RL) for Dioxins and PCBs in Feed and Food. The PCDD/F and PCB concentrations of the naturally contaminated PT sample lay in the range of established EU maximum and action levels for PCDD/Fs and DL-PCBs and discussed levels for NDL-PCBs. Materials and Methods Structure of the study The PT comprised the determination of PCDD/Fs, dioxin-like PCBs and non dioxin-like PCBs (six indicator PCBs) in one sample of grass meal. The study was open for participation of National Reference Laboratories (NRLs) of EU member states and official laboratories applying GC/MS-methods and/or bioanalytical screening methods for PCDD/Fs and dioxin-like PCBs and any kind of method for PCBs. 84 laboratories reported results for at least one of the required sum parameters. 52 laboratories reported results for PCDD/Fs and DL-PCBs and 68 for indicator PCBs. 10 laboratories reported results using CALUX bioassay. Test material The grass meal sample has been prepared from regular market feed. There was no fortification of the sample with the analytes of interest. The WHO-PCDD/F-PCB-TEQ, WHO-PCDD/F-TEQ and WHO-PCB-TEQ concentrations in the sample are in the range of action and maximum levels defined for feed materials of plant origin3, the concentrations of sum indicator PCBs are in the range of discussed levels (figure 1). 20
Maximum level
WHO-TEQ [ng/kg product (12% moisture content)
Action level Proposed maximum level
3
15
2
10
1
5
0
Indicator PCB [µg/kg product (12% miosture content)
4
0 WHO-PCDD/F-PCB- WHO-PCDD/F-TEQ TEQ
WHO-PCB-TEQ
Sum Indicator PCBs
Figure 1: Comparison of legal limits defined for feed materials of plant origin with levels in PT test sample
Organohalogen Compounds
Vol. 73, 2166-2169 (2011)
2166
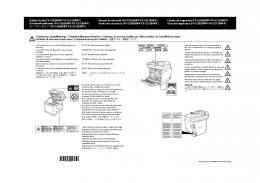
Test for sufficient homogeneity The test for sufficient homogeneity was performed according to ISO 13528:20054 and the International Harmonized Protocol for the Proficiency Testing of Analytical Chemistry Laboratories5. The test was performed for the sum parameters WHO-PCDD/F-PCB-TEQ, WHO-PCDD/F-TEQ, WHO-PCB-TEQ and the sum of six indicator PCBs. The test material showed sufficient homogeneity for this proficiency test. GC/MS measurement:
Grass meal sample
- PCDD/F - PTV injector: Injection of 5 µl (solvent split) - GC separation: 95%-Dimethyl-5%-diphenyl-polysiloxane - HRMS: Resolution 10'000
Extraction Large multi-layer silica column Gel permation chromatography Multi-layer silica column Florisil column n-Heptane fraction
Toluene fraction
Carbon column for PCB
Carbon column for PCDD/F
n-Hexane fraction
n-Hexane/toluene fraction
Toluene fraction
Toluene fraction
Indicator PCBs
Mono-ortho-PCBs
Non-ortho-PCBs
Multi-layer silica column
- PCB: - SSL injector: Injection of 1 µl splitless - GC separation: HT-8 PCB - HRMS: Resolution 10'000
PCDD/Fs
Analytes Participants were requested to determine the following analytes and sum parameters: 17 2,3,7,8-substituted PCDD/Fs WHO-PCDD/F-TEQ (using WHO1998-TEF) 12 dioxin-like PCBs WHO-PCB-TEQ (using WHO1998-TEF) WHO-PCDD/F-PCB-TEQ (using WHO1998-TEF) Six indicator PCBs: PCB #28, 52, 101, 138, 153, 180 Total-TEQ, PCDD/F-TEQ, PCB-TEQ (bioassay) All results had to be reported on product basis relative to a feedingstuff with a moisture content of 12 % in ng/kg. Results and Discussion Determination of the assigned values The determination of the assigned values was performed according to International Harmonized Protocol for the Proficiency Testing of Analytical Chemistry Laboratories5 by estimating of the assigned value as the consensus of participants’ results (using only GC/MS and GC/ECD results). The assigned value was calculated for WHOPCDD/F-PCB-TEQ, WHO-PCDD/F-TEQ, WHO-PCB-TEQ, the sum of six indicator PCBs and individual PCDD/F and PCB congeners. Table 1: Assigned values for WHO-PCDD/F-PCB-TEQ, WHO-PCDD/F-TEQ, WHO-PCB-TEQ and sum of six indicator PCBs in grass meal (results in ng/kg product, 12% moisture content): Analyte
WHO-PCDD/F-PCB-TEQ upper bound WHO-PCDD/F-TEQ upper bound WHO-PCB-TEQ upper bound Sum Indicator PCBs upper bound
Organohalogen Compounds
Assigned value (Huber robust mean) ng/kg product (12% moisture content) [outliers removed] 2.19 2.01 0.17 7720
Vol. 73, 2166-2169 (2011)
Median ng/kg product (12% moisture content) [all values] 2.15 1.98 0.17 7810
2167
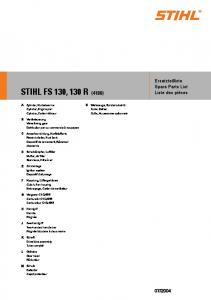
Congener pattern and contribution to WHO-TEQ 2,3,4,7,8-PeCDF and 2,3,7,8-TCDF were the most abundant congeners and showed the highest contribution to the WHO-PCDD/F-TEQ with 74 % and 15 % respectively. PCB 126 and 156 contributed 44 % and 37 % to the WHO-PCB-TEQ. Regarding the indicator PCBs, the higher chlorinated PCBs 138, 153 and 180 contributed more than 80% to the total sum of six indicator PCBs. Scoring of results Conversion of participants' results into z-scores: z =(x - xa) / σp xa: assigned value x: participants result σp: target deviation (fitness-for-purpose-based "standard deviation for proficiency assessment") For conversion of the participants’ results into z-scores, a target deviation σp of 10 % for WHO-PCDD/F-TEQ, WHO-PCB-TEQ and WHO-PCDD/F-PCB-TEQ, of 15 % for the sum of six indicator PCBs (PCB #28, 52, 101, 138, 153, 180) and of 20% for evaluated individual PCDD/F and PCB congeners was applied. Acceptable zscores were between - 2 and + 2. Not acceptable z-scores were outside the range of - 3 to + 3. The distribution of z-scores for WHO-PCDD/F-PCB-TEQ, WHO-PCDD/F-TEQ, WHO-PCB-TEQ and sum of indicator PCBs for all participating laboratories (except bioassay results) is illustrated in the following figures 2 and 3.
Grass meal (1101-GM) WHO-PCDD/F-PCB-TEQ upper bound (reported)
Grass meal (1101-GM) WHO-PCDD/F-TEQ upper bound (reported) Consensus value: 2.01 ng/kg product (12% moisture content)
5
5
4
4
3
3
2
2
1 0 42 2
5 7 5 3 62 4 6 7
2 1 7 6 28 11 27 33 4 0 3 8 18
10 72
9 6 5 44 16 26 29 6 3 23 8 3
4
19 4 8 39 32 5 9 50 74 3 4 37
3
20 67 5 2 31 4 1 15 58 5 5 49 3 0 7 3
6
1
-1
Z-score (σ = 10 %)
Z-score (σ = 10 %)
Consensus value: 2.19 ng/kg product (12% moisture content)
1 0 36 42 86 2
-2
-2
-3
-3
-4
-4
-5
57 53 2 8 4 6 7 6 2 21 11 76 2 7 10 18 3 8 4 0 30 33 65 9 7 2 8 3 4 8 16 29 23 26 6 3 4 4 19
4 3 9 32 37 50 5 9 7 4 3 3 4 52 67 20 15 4 1 31 1 55 58 49 2 2 6 7 3
-1
-5 Laboratory code
Laboratory code
Figure 2: Z-scores for WHO-PCDD/F-PCB-TEQ and WHO-PCDD/F-TEQ (upper bound), Grass meal PT 2011 Grass meal (1101-GM) Sum Indicator PCBs upper bound reported
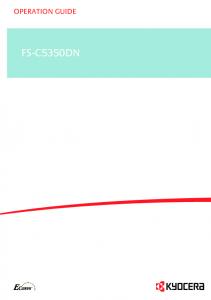
Grass meal (1101-GM) WHO-PCB-TEQ upper bound (reported)
Consensus value: 7716 ng/kg product (12% moisture content)
5
5
4
4
3
3
2
2
1 0 6 2 31 2 7 6 5 3
4 3 3 4 4 21
7
41 72 67 40 16 29 39 5 8 6 3 59
9 2 3 26 38 5 7 32 19 3 4 20 11 7 3 4 6 5 0 18 2 7 6 5 10 83 4 9 52 74 4 8 5 5
-1
3 37 6
28 15 4 2 30
1 36
Z-score (σ = 15 %)
Z-score (σ = 10 %)
Consensus value: 0.17 ng/kg product (12% moisture content)
1 0 16 2 3 84 28 4 5 4 5 6 61 79 4 2 43 10 19 9 3 8 7 3 5 14 64 46 3 9 55 5 4 72 5 5 9 12 8 5 21 29 81 34 4 16 3 18 2 6 62 8 2 2 0 50 4 4 31 40 3 2 7 3 33 1 13 2 7 8 57 7 1 17 3 6 7 76 5 2 58 49 8 3 75 6 9 6 66 3 0 15
-1
-2
-2
-3
-3
-4
-4
-5
-5 Laboratory code
Laboratory code
Figure 3: Z-scores for WHO-PCB-TEQ and sum of 6 indicator PCBs (upper bound), Grass meal PT 2011 Table 2 shows the percentage of laboratories reporting results for the WHO-PCDD/F-PCB-TEQ, WHOPCDD/F-TEQ, WHO-PCB-TEQ and sum of indicator PCBs inside/outside the range of ± 2 and ± 3 z-scores.
Organohalogen Compounds
Vol. 73, 2166-2169 (2011)
2168
Table 2: Percentage of laboratories’ results in the range of ± 2 and ± 3 z-scores for TEQ and sum of indicator PCBs z-score z < -3 -23 z>3
WHO-PCDD/F-PCB-TEQ 2% 2% 82 % 6% 8%
WHO-PCDD/F-TEQ 6% 2% 80 % 7% 6%
WHO-PCB-TEQ 6% 2% 63 % 4% 25 %
Sum of 6 indicator PCBs 5% 3% 82 % 5% 6%
The evaluation of the reported results of all participating laboratories (except bioassay results) showed: - 63 - 82 % of all participants reported results for sum parameters with a z-score within the range of ± 2, 70 90 % in the range of ± 3 z-scores - Lowest percentages of participants’ results within the range of ± 2/± 3 z-scores were found for WHO-PCBTEQ possibly due to the considerably lower levels compared to WHO-PCDD/F-TEQ. - The differences between upper and lower bound results for all sum parameters were mostly below 10 % for all results, higher deviations could be observed for some WHO-PCB-TEQ results. The comparison of the z-score distribution for WHO-PCDD/F-PCB-, WHO-PCDD/F-, WHO-PCB-TEQ and the sum of six indicator PCBs showed considerably more laboratories with z-scores > 2 and > 3 for WHO-PCBTEQ than for WHO-PCDD/F-TEQ and WHO-PCDD/F-PCB-TEQ (due to the high contribution of WHOPCDD/F-TEQ). For WHO-PCDD/F-PCB-TEQ, WHO-PCDD/F-TEQ and sum of six indicator PCBs results of participants showed a similar and rather symmetric distribution of z-scores. Results of bioanalytical screening methods 10 laboratories reported results using CALUX bioassay, 7 laboratories reported results for the Total-TEQ (sum of PCDD/F-TEQ and PCB-TEQ) and 3 laboratories also for PCDD/F-TEQ and PCB-TEQ separately. Besides the comparison of the reported TEQ-value derived from bioanalytical screening methods with the assigned value, main criteria for evaluation of the results of bioanalytical screening methods is the identification of compliance of the samples. Therefore laboratories were requested to assess the analytical results and report, if the sample was compliant or not. 80 % of participating laboratories using bioassays reported the test sample (with WHO-PCDD/F-PCB-TEQ considerably above the established maximum level) to be suspected to be non-compliant. Conclusions More than 80 % of participating laboratories reported results within ± 2 z-scores of the assigned value for TEQ results and the sum of six indicator PCBs, except for WHO-PCB-TEQ (63 %). Therefore the grass meal used in the PT was suitable to demonstrate the ability of participating NRLs and official laboratories to analyze PCDD/Fs, dioxin-like PCBs and indicator PCBs in a feed material of plant origin in the relevant concentration range. 80 % of laboratories reporting results using a bioanalytical screening methods correctly identified the sample as suspected to be non-compliant. Acknowledgements We would like to thank the European Commission for the financial support of the work of the European Union Reference Laboratory for Dioxins and PCBs in Feed and Food, Freiburg, Germany. References 1. Kotz A, Malisch R, Hädrich J, Adamovic K, Gerteisen I, Tritschler R, Winterhalter H, 2007. Organohalogen Compd 69, 130-133 2. Kotz A, Malisch R, Hädrich J, Adamovic K, Gerteisen I, Tritschler R, Winterhalter H, 2008. Organohalogen Compd 70, 902-905 3. Commission Directive 2006/13/EC of 3 February 2006 (OJ L 32, 4.2.2006, p. 44–53) 4. ISO 13528:2005, International Organization for Standardization 5. M. Thompson, S.L.R. Ellison, R. Wood, 2006. Pure Appl. Chem. Vol. 78, No. 1, pp-145-196
Organohalogen Compounds
Vol. 73, 2166-2169 (2011)
2169