Full-Reference Image Quality Assessment Measure Based on Color Distortion Zianou Ahmed Seghir1() and Fella Hachouf2 1
University Khenchela, Faculty. ST, ICOSI Lab., BP 1252 El Houria, 40004 Khenchela, Algeria 2 Laboratoire d’Automatique et de Robotique, Université Constantine1, Algeria
[email protected]
Abstract. The purpose of this paper is to introduce a new method for image quality assessment (IQA). The method adopted here is assumed to be Full-reference measure. Color images that are corrupted with different kinds of distortions are assessed by applying a color distorted algorithm on each color component separately. This approach use especially YIQ color space in computation. Gradient operator was successfully introduced to compute gradient image from the luminance channel of images. In this paper, we propose an alternative technique to evaluate image quality. The main difference between the new proposed method and the gradient magnitude similarity deviation (GMSD) method is the usage of color component for the detection of distortion. Experimental comparisons demonstrate the effectiveness of the proposed method. Keywords: Gradient similarity · Quality assessment · Test image · Color distortion · Color space
1
Introduction
Over the past decade, image quality assessment methods based objective methods have grown significantly to tackle problems of image assessment. The challenge of these problems is to construct an algorithm that can automatically predict perceived quality of image. There is no doubt that the subjective test is the most accurate measure for quality assessment because it reflects the true human perception. On the other hand, it is time consuming and expensive. There are three kinds of measures that are used for objective image quality assessment, full-reference (FR), reduced-reference (RR) and noreference (NR). In this paper, the discussion is confined to FR metrics, where the reference images are available. There has been extensive work on objective image quality assessment. The most popular method for full reference image quality assessment is the Structural Similarity Index [2] (SSIM). It contains three parts: Luminance Comparison, Contrast Comparison and Structure Comparison. However, it fails in measuring the badly blurred © IFIP International Federation for Information Processing 2015 A. Amine et al. (Eds.): CIIA 2015, IFIP AICT 456, pp. 66–77, 2015. DOI: 10.1007/978-3-319-19578-0_6
Full-Reference Image Quality Assessment Measure Based on Color Distortion
67
images [3]. In [4], an approach based on edge-region information, distorted and displaced pixels (ERDDM) is developed. Initially, the test and reference images are divided into blocks of 11×11 pixels, and then distorted and displaced pixels are calculated which can be used to compute the global error. In [6], DTex metric is proposed with consideration of the texture masking effect and contrast sensitivity function. In [17], it was shown that the masking effect and the visibility threshold can be combined with structure, luminance and contrast comparison to create the image quality measure (gradient similarity measure (GSM)). Most Apparent Distortion (MAD) designed in [23, 24] yields two quality scores, i.e., visibility-weighted error and the differences in log-Gabor subbands statistics. The proposed measure in [13] applies phase congruency [15] to image quality measure. This measure differs in their correlations with the subjective quality and carrying out times. Gradient magnitude similarity deviation (GMSD) is proposed [14], where the pixel-wise gradient magnitude similarity (GMS) is used to capture image local quality, and the standard deviation of the overall GMS map is computed as the final image quality index. The gradient images are sensitive to image distortions, whereas different local structures in a distorted image suffer different degrees of degradations. This motivates us to investigate the use of global variation of gradient based local quality map for overall image quality prediction. In fact, color deformation cannot be well differentiated by gradient. In addition, the gradient is computed from the luminance channel of images. Therefore, to make the image quality assessment measures own the ability to deal with color distortions, chrominance information should be taken into consideration. The aim of this paper is to improve the GMSD to take color distortion in consideration. As a result, we use a proposed gradient operator and YIQ color space [1] to produce gradient image and color distortion from the reference and test images, respectively. The rest of the paper is organized as follows. In Section 2, our proposed image quality measure is defined. In section 3, performance of the proposed method is compared with others measures using images with different types of distortion. We finish by the conclusion.
2
Proposed Method
Before introducing the proposed measure notion, some useful concepts must be visited. The reference and test images are represented by , and , respectively. The proposed method uses gradient similarity and Color distortion to form map. In addition, all variables used in the proposed method are defined next: Ref: reference image. Dis: test image. M × N : the image size. G1: gradient image of Ref. G2 : gradient image of Dis. G_map: Gradient similarity map.
68
Z. Ahmed Seghir and F. Hachouf
CFI_map and CFQ_map : chromatic features. C1, C2: positive constants. : Gradient similarity based Color distortion measure. 2.1
Gradient Similarity
In order to reflect the differences between Ref and Dis at the local level, we compute image gradient of the reference and test images. Different operators are used to compute the image gradient, such as the Sobel operator [7], the Prewitt operator [7] and the Scharr operator [8], and in this paper a new gradient operator is proposed, which shows very favorable outcome. It defines as: Gx
Mask
4 3 4
0 0 0
Gy 4 3 /11 4
4 111 0 4
3 0 3
4 0 /11 4
This later consists of a pair of 3×3 convolution kernels and is used for detecting vertical and horizontal edges in images. The partial derivatives Gx and Gy of an image are computed as: (1) Also, the gradient operators (G) of the reference and test images are computed. As a result, the G2 and G1 of the test and reference images are produced, respectively. The gradient similarity is computed in proposed method and hence the Gradient map ( _ ) is formed as 2
_
2.2
.
(2)
Color Space Transformation
The color distortion cannot be differentiating by gradient. Hence, to make the image quality assessment measures possess the ability to deal with color distortions, special considerations are given to chrominance information. As a result, these formulas approximate the conversion between the RGB color space and YIQ [1] 0.299 0.596 0.212
0.587 0.275 0.528
0.144 0.321 0.311
(3)
Full-Reference Image Quality Assessment Measure Based on Color Distortion
69
Let I1 (I2) and Q1 (Q2) be the I and Q chromatic channels of the reference and distorted images respectively. Similar to the definitions of CFI_map and CFQ_map, the similarity between chromatic features is defined as follows: 2 .
_ _
2
(4)
.
The similarity between the chrominance components (color distortion map) is simply defined as: _
2.3
_
.
_
(5)
Global Error
Finally, the gradient similarity based Color distortion map (GSCD_map) is expressed as: _
_
.
_
(6)
The total gradient similarity based Color distortion measure (GSCDM) is defined as the standard deviation of the GSCD map: 1 .
_
,
(7)
Where 1 .
_
,
(8)
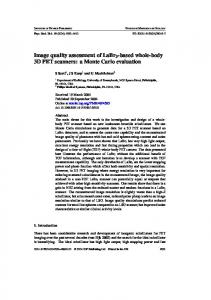
Flowchart depicting computation of the proposed measure is shown in Fig. 1.
3
Results
In order to evaluate the accuracy of the proposed method; we follow the standard performance assessment procedures utilized in the video quality expert’s group (VQEG) FR-TV Phase II test [5]. The objective and subjective scores [5], are fitted with the logistic function. Five parameters non-linear mapping (θ1, θ2, θ3, θ4 and θ5) are utilized to change the set of quality ratings by the objective quality measures to a set of the predicted Difference Mean Opinion Score (DMOS/MOS) values denoted DMOSP/MOSP. In equation (9), the logistic regression function is introduced which is employed for the nonlinear regression.
70
Z. Ahmed Seghir and F. Hachouf
Fig. 1. Image quality assessment method
1 2
1 exp
(9)
Where VQR is the value of the objective method and θ1, θ2, θ3, θ4, θ5 are selected for the most excellent fit. In this test, four metrics are used [26]: the Root mean square prediction error (RMSE), the Spearman rank-order correlations coefficient (ROCC), Kendall rankorder correlation coefficient (KROCC) and The Pearson linear correlation coefficient (CC). ROCC and KROCC evaluate the prediction monotonicity. CC and RMSE assess the prediction accuracy. ROCC, KROCC and CC are better with values closer to 1 or -1. Thus, RMSE is better when its values are small. The first index CC (Pearson linear correlation coefficient) is defined by:
Full-Reference Image Quality Assessment Measure Based on Color Distortion
∑ ( DMOS (i ) − DMOS )( DMOS (i ) − DMOS ) ∑ ( DMOS (i ) − DMOS ) ∑ ( DMOS (i ) − DMOS
71
n
CC =
p
i =1
p
2
p
p
(10)
)2
Where the index i denotes the image sample and n denotes the number of samples. The second index is the Spearman rank-order correlations coefficient (ROCC); it is defined by: ROCC = 1 −
6
∑ ( DMOS (i ) − DMOS
p
(i )) 2
(11)
n ( n − 1) 2
The third index is Kendall rank-order correlation coefficient (KROCC) [25]. It is designed to capture the association between two ordinal variables. Its estimate can be expressed as follows: ∑
∑
(12)
1
where: 1
0
0
0
1
0
and 1 0
0 0
1
0
The forth one is the Root mean square prediction error (RMSE) between subjective (DMOS) and objective (DMOSP) scores. It is defined by: RMSE =
1 n 2 ∑ (DMOS (i) − DMOS p (i ) ) n i =1
(13)
To judge the performance of the proposed approach, four kinds of databases are used: TID2008 database [9], CSIQ database [10], LIVE database [11] and TID2013 database [12]. The characteristics of these four databases are summarized in table 3. The performance of GSCD metric is compared with PSNR, SSIM [2,16], Multiscale-SSIM (MS-SSIM) [18,16], Visual Singal-to-Noise Ratio (VSNR) [19,16], Visual Information Fidelity (VIF) [20,16], Information Fidelity Criterion (IFC) [21,16], Noise Quality Measure (NQM) [22, 16], DTex [6], GSM [17], MAD [23,24], ERDDM [4], GSMD [14] and FSIM [13]. A comparative study of Sobel, Perwitt, Scharr and proposed operator is presented in Table 1 (TID2008 database is used in this experience), from which proposed operator could accomplish better performance than the other three. Furthermore, the choice
72
Z. Ahmed Seghir and F. Hachouf
of YIQ color space needs to be proved. To this end, we run the proposed method with different four color spaces. The results are summarized in table 2 (TID2008 database is used in this experience). Table 1. ROCC and KROCC values using four gradient operators
Gradient operator ROCC KROCC
Sobel 0.8983 0.7143
Perwitt 0.8996 0.7171
Scharr 0.8963 0.7104
Proposed operator 0.9000 0.7175
Table 2. ROCC and KROCC values using four color spaces
Color space ROCC KROCC
Lab 0.7684 0.5789
ycbcr 0.8937 0.7110
HSV 0.2983 0.2125
YIQ 0.9000 0.7175
The classification of the performance of all measures according to their ROCC values is presented in Table 8 reveal the reliability of the GSCD. Tables 4, 5, 6 and 7 show the obtained results. The top three measures for each assessment measure are highlighted in bold. We can see that the top methods are mostly GSCD, GMSD, FSIM and MAD. GSCD correlates much better with the subjective results than the other measures. Looking at the curves (Fig.2), the GSCD values are very close to DMOS and MOS, proving the efficiency of this measure. 8
8
6
6
5
5
4
4
3
3
2
2
1
1
0
0
0.05
0.1
0.15 0.2 GSCD
0.25
0.3
TID2013 Fitting with logistic function
7
TID2008 Fitting with logistic function
MOS
MOS
7
0
0.35
120
0
0.05
0.1
0.15 0.2 GSCD
0.25
0.3
0.35
1 0.9
LIVE Fitting with logistic function
100
0.8 80
0.7 0.6 DMOS
DMOS
60
40
0.5 0.4 0.3
20
0.2
CSIQ Fitting with logistic function
0 0.1 -20
0
0.05
0.1
0.15 0.2 GSCD
0.25
0.3
0.35
0
0
0.05
0.1
0.15 0.2 GSCD
0.25
0.3
0.35
Fig. 2. Scatter plots of subjective scores versus scores from the proposed scheme on IQA databases
Full-Reference Image Quality Assessment Measure Based on Color Distortion
73
Moreover, an interesting result is obtained from the comparison of the GSCD with GMSD, FSIM and MAD in Tables 5 (TID2008 database). The values of ROOC are close to 1; this means that GSCD has a similar performance as the methods or earlier works. Results clearly indicate that our GSCD measure performs quite well and is competitive with other IQA measures. In addition, to compare the efficiency of different models, the average execution time required an image of size 512×384 is calculated (the image is taken from TID2008 database). All metrics were run on a TOSHIBA Satetillete T130-11U notebook with Intel Core U4100
[email protected] GHz and 3G RAM. The software platform used to run all metrics was MATLAB R2007a (7.4.0). Table 8 shows the required time in seconds per image. It is shown in Table 9 that the proposed measure takes more time than the PSNR, the GMSD, and the SSIM and it is faster than the Fsim. VIF, VSNR, IFC, MS-SSIM, GSM, MAD, DCTex, NQM and ERDDM also take much longer processing time than the proposed method. Moreover, we adjusted the parameters based on a dataset of TID2008 database. The adjusting measure was that the parameters values giving to a higher ROCC would be chosen. As a result, the parameters required in the proposed method were set as: C1= 100, C2=2050. Table 3. Four databases and their characteristics
Database TID2008 CSIQ LIVE TID2013
Source Images 25 30 29 25
Distorted Images 1700 866 779 3000
Distortion Types 17 6 5 25
Image Type color color color color
Observers 838 35 161 971
Table 4. Performance comparison for image quality assessment measures on live database
Method PSNR SSIM MS-SSIM VSNR VIF IFC NQM ERDDM DCTex GSM MAD Fsim GMSD GSCD
ROCC 0.8756 0.9479 0.9513 0.9280 0.9632 0.9259 0.9086 0.9496 0.9483 0.9554 0.9669 0.9645 0.9603 0.9596
KROCC 0.6865 0.7963 0.8044 0.7625 0.8270 0.7579 0.7413 0.8128 0.8066 0.8131 0.8421 0.8363 0.8271 0.8222
CC 0.8723 0.9449 0.9409 0.9237 0.9598 0.9268 0.9122 0.9619 0.9443 0.9437 0.9674 0.9613 0.9603 0.9538
RMSE 13.3597 8.9454 9.2593 10.4694 7.6670 10.2643 11.1926 6.3204 8.9897 9.0376 6.9235 7.5296 7.622 8.2074
74
Z. Ahmed Seghir and F. Hachouf
Table 5. Performance comparison for image quality assessment measures on TID2008 database
Method PSNR SSIM MS-SSIM VSNR VIF IFC NQM ERDDM DCTex GSM MAD Fsim GMSD GSCD
ROCC 0.5794 0.7749 0.8542 0.7049 0.7496 0.5675 0.6243 0.5961 0.4973 0.8554 0.8340 0.8840 0.8907 0.9000
KROCC 0.4210 0.5768 0.6568 0.5345 0.5868 0.4236 0.4608 0.4411 0.4095 0.6651 0.6445 0.6991 0.7094 0.7175
CC 0.5726 0.7710 0.8451 0.6823 0.8090 0.7340 0.6142 0.6685 0.5605 0.8462 0.8306 0.8762 0.8788 0.8830
RMSE 1.1003 0.8546 0.7173 0.9810 0.7888 0.9113 1.0590 0.998 1.1113 0.7151 0.7474 0.6468 0.6404 0.629
Table 6. Performance comparison for image quality assessment measures on TID2013 database
Method PSNR SSIM MS-SSIM VSNR VIF IFC NQM ERDDM DCTex GSM MAD Fsim GMSD GSCD
ROCC 0.6396 0.7417 0.7859 0.6812 0.6769 0.5389 0.6432 0.5623 0.5863 0.7946 0.7807 0.8510 0.8044 0.8681
KROCC 0.4698 0.5588 0.6047 0.5084 0.5147 0.3939 0.474 0.4124 0.4573 0.6255 0.6035 0.6665 0.6343 0.6855
CC 0.669 0.7895 0.8329 0.7402 0.7720 0.5538 0.6858 0.6352 0.6495 0.8464 0.8267 0.8769 0.859 0.8819
RMSE 0.9214 0.7608 0.6861 0.8392 0.7880 1.0322 0.9023 1.230 0.9425 0.6603 0.6975 0.5959 0.6346 0.5844
Table 7. Performance comparison for image quality assessment measures on CSIQ database
Method PSNR SSIM MS-SSIM VSNR VIF IFC NQM
ROCC 0.8005 0.8756 0.9133 0.8104 0.9195 0.7671 0.7402
KROCC 0.5984 0.6907 0.7393 0.6237 0.7537 0.5897 0.5638
CC 0.7998 0.8612 0.8990 0.7993 0.9277 0.8384 0.7433
RMSE 0.1576 0.1334 0.1150 0.1578 0.0980 0.1431 0.1756
Full-Reference Image Quality Assessment Measure Based on Color Distortion
75
Table 7. (Continued)
ERDDM DCTex GSM MAD Fsim GMSD GSCD
0.8626 0.8042 0.9126 0.9467 0.9310 0.957 0.9602
0.6781 0.6420 0.7403 0.7970 0.7690 0.8133 0.8194
0.8295 0.7915 0.8979 0.9502 0.9192 0.9541 0.9578
0.1466 0.1605 0.1156 0.0818 0.1034 0.0786 0.0755
Table 8. Ranking of IQA metrics’ performance on four databases
Method PSNR SSIM MS-SSIM VSNR VIF IFC NQM ERDDM DCTex GSM MAD Fsim GMSD GSCD
Live 14 10 7 11 2 12 13 8 9 6 1 3 4 5
TID2008 12 7 5 9 8 13 10 11 14 4 6 3 2 1
TID2013 11 7 5 8 9 14 10 13 12 4 6 2 3 1
CSIQ 12 8 6 10 5 13 14 9 11 7 3 4 2 1
Table 9. Running time of the competing IQA models
Method PSNR SSIM MS-SSIM VSNR VIF IFC NQM
4
Time (second) 0.0493 0.1917 1.1304 1.5018 5.1429 4.6738 1.8846
Method ERDDM DCTex GSM MAD Fsim GMSD GSCD
Time (second) 9.6089 0.5327 1.4003 15.6235 2.4990 0.1602 0.4361
Conclusion
This paper describes an efficient method for image quality assessment. Its main feature is that this new method uses the gradient similarity and color distorted measure. The reference and test images are transformed respectively using color distorted and
76
Z. Ahmed Seghir and F. Hachouf
gradient mask. The difference between the reference and test images is computed using simple function. A comparative study has been carried in this work. The obtained results are competitive with the previous works. Future works following this study will include the use of others characteristics to assess image quality.
References 1. Yang, C., Kwok, S.H.: Efficient gamut clipping for color image processing using LHS and YIQ. Opt. Eng. 42(3), 701–711 (2003) 2. Wang, Z., Bovik, A.C., Sheikh, H.R., Simocelli, E.P.: Image quality assessment: From error measurement to structural similarity. IEEE Trans. Image Processing 13(4), 600–612 (2004) 3. Guan-Hao, C., Chun-Ling, Y., Sheng-Li, X.: Gradient-based structural similarity for image quality assessment. In: Proc. ICIP 2006, pp. 2929–2932 (2006) 4. Ahmed Seghir, Z., Hachouf, F.: Edge-region information measure based on deformed and displaced pixel for Image Quality Assessment. Signal Processing: Image Communication 26(8-9), 534–549 (2011) 5. Final VQEG report on the validation of objective quality metrics for video quality assessment: http://www.its.bldrdoc.gov/vqeg/projects/frtv_phaseI/ 6. Zhang, F., Ma, L., Li, S.: Practical image quality metric applied to image coding. IEEE Trans. Multimedia 13, 615–624 (2011) 7. Jain, R., Kasturi, R., Schunck, B.G.: Machine Vision. McGraw-Hill, NewYork (1995) 8. Jähne, B., Haubecker, H., Geibler, P.: Handbook of Computer Vision and Applications. Academic, New York (1999) 9. Ponomarenko, N., Egiazarian, K.: Tampere Image Database, TID 2008, http://www.ponomarenko.info/tid2008.htm 10. Larson, C., Chandler, D.M.: Categorical Image Quality (CSIQ) Database 2009, http://vision.okstate.edu/csiq 11. Sheikh, H.R., Seshadrinathan, K., Moorthy, A.K., Wang, Z., Bovik, A.C., Cormack, L.K.: Image and Video Quality Assessment Research at LIVE 2004 (2004), http://live.ece.utexas.edu/research/quality 12. Ponomarenko, N., et al.: Color image database TID2013: Peculiarities and preliminary results. In: Proc. 4th Eur. Workshop Vis. Inf. Process., pp. 106–111 (June 2013) 13. Zhang, L., Zhang, L., Mou, X., Zhang, D.: FSIM: A feature similarity index for image quality assessment. IEEE Transactions on Image Processing 20(8), 1–26 (2011) 14. Xue, W., Zhang, L., Mou, X., Bovik, A.C.: Gradient Magnitude Similarity Deviation: A Highly Efficient Perceptual Image Quality Index. Presented at IEEE Transactions on Image Processing, 684–695 (2014) 15. Kovesi, P.: Image features from phase congruency. Videre: Journal of Computer Vision Research 1(3), 1–26 (1999) 16. Gaubatz, M.: Metrix MUX Visual Quality Assessment Package: MSE, PSNR, SSIM, MSSIM, VSNR, VIF, VIFP, UQI, IFC, NQM, WSNR, SNR 17. http://foulard.ece.cornell.edu/gaubatz/metrix_mux/ 18. Liu, A., Lin, W., Narwaria, M.: Image quality assessment based on gradient similarity. IEEE Transactions on Image Processing 21(4), 1500–1512 (2012)
Full-Reference Image Quality Assessment Measure Based on Color Distortion
77
19. Wang, Z., Simoncelli, E.P., Bovik, A.C.: Multi-scale structural similarity for image quality assessment. In: Proc. IEEE Asilomar Conf. Signals, Syst., Comput., Pacific Grove, CA, pp. 1398–1402 (November 2003) 20. Chandler, D.M., Hemami, S.S.: VSNR: A wavelet-based visual signal-to-noise-ratio for natural images. IEEE Trans. Image Process. 16(9), 2284–2298 (2007) 21. Sheikh, H.R., Bovik, A.C.: Image information and visual quality. IEEE Trans. Image Process. 15(2), 430–444 (2006) 22. Sheikh, H.R., Bovik, A.C., de Veciana, G.: An information fidelity criterion for image quality assessment using natural scene statistics. IEEE Trans. on Image Processing 14(12), 2117–2128 (2005) 23. Damera-Venkata, N., Kite, T.D., Geisler, W.S., Evans, B.L., Bovik, A.C.: Image quality assessment based on degradation model. IEEE Trans. on Image Processing 9(4), 636–650 (2000) 24. Larson, E.C., Chandler, D.M.: Most apparent distortion: Full-reference image quality assessment and the role of strategy. J. Electron. Imaging 19(1), 011006:1–011006:21 (2010) 25. Larson, E., Chandler, D.: Full-Reference Image Quality Assessment and the Role of Strategy: The Most Apparent Distortion, http://vision.okstate.edu/mad/ 26. Chok, N.S.: Pearson’s Versus Spearman’s and Kendall’s Correlation Coefficients for Continuous Data. Master’s Thesis, University of Pittsburgh (2010) 27. Wang, Z., Li, Q.: Information content weighting for perceptual image quality assessment. IEEE Trans. Image Process. 20(5), 1185–1198 (2011)