IEEE JOURNAL OF SELECTED TOPICS IN SIGNAL PROCESSING, VOL. 8, NO. 3, JUNE 2014
377
Objective Quality Assessment for Image Retargeting Based on Perceptual Geometric Distortion and Information Loss Chih-Chung Hsu, Chia-Wen Lin, Senior Member, IEEE, Yuming Fang, and Weisi Lin, Senior Member, IEEE
Abstract—Image retargeting techniques aim to obtain retargeted images with different sizes or aspect ratios for various display screens. Various content-aware image retargeting algorithms have been proposed recently. However, there is still no effective objective metric for visual quality assessment of retargeted images. In this paper, we propose a novel full-reference objective metric for assessing visual quality of a retargeted image based on perceptual geometric distortion and information loss. The proposed metric measures the geometric distortion of a retargeted image based on the local variance of SIFT flow vector fields of the image. Furthermore, a visual saliency map is derived to characterize human perception of the geometric distortion. Besides, the information loss in the retargeted image, which is estimated based on the saliency map, is also taken into account in the proposed metric. Subjective tests are conducted to evaluate the performance of the proposed metric. Our experimental results show the good consistency between the proposed objective metric and the subjective rankings. Index Terms—Geometric distortion, image retargeting, quality assessment, quality evaluation, SIFT flow.
T
I. INTRODUCTION
HE heterogeneity of end devices has imposed new demands, one of which is that images should be resized for different display resolutions on various devices. A traditional approach to resizing images for different display screens is to scale images by uniformly down-sampling. However, this method may result in poor viewing experience as some salient objects turn to be too small. Image cropping is another traditional image resizing method by preserving the Regions of Interest (ROIs) for images. The drawback of this method is that the context information may get lost.
Manuscript received August 31, 2013; revised January 27, 2014; accepted March 06, 2014. Date of publication March 14, 2014; date of current version May 13, 2014. This work was supported in part by the National Science Council, Taiwan, under Grant NSC101-2221-E-007-121-MY3. The guest editor coordinating the review of this manuscript and approving it for publication was Prof. Alan C. Bovik. C.-C. Hsu is with the Department of Electrical Engineering, National Tsing Hua University, Hsinchu 100084, Taiwan. C.-W. Lin is with the Department of Electrical Engineering and the Institute of Communications Engineering, National Tsing Hua University, Hsinchu 100084, Taiwan (e-mail:
[email protected]). Y. Fang is with the School of Information Technology, Jiangxi University of Finance and Economics, Nanchang 330013, China. W. Lin is with the Division of Computer Communications, School of Computer Engineering, Nanyang Technological University, Singapore 639798. Color versions of one or more of the figures in this paper are available online at http://ieeexplore.ieee.org. Digital Object Identifier 10.1109/JSTSP.2014.2311884
To overcome the problems with the image scaling and cropping, some advanced content-aware image/video retargeting algorithms have been proposed recently [1]–[7]. The popular image retargeting algorithm seam carving was proposed by Avidan et al. [1]. Guo et al. [2] designed an image retargeting algorithm based on saliency-based mesh parameterization. Wang et al. [3] presented an image retargeting algorithm by combining a saliency map and a gradient map. Wolf et al. [4] introduced a linear system to design an image retargeting algorithm. Recently, Rubinstein et al. [5] showed that a multi-operator retargeting algorithm that combines the seam carving, scaling and cropping operators to resize an image, can obtain better results than those using only a single operator. In [6] and [7], temporal information is further taken into account to ensure the temporal consistency between consecutive frames of a video in video retargeting. Due to the rapid growth of image retargeting applications, visual quality assessment for retargeted images become important. In [8], Rubinstein et al. conducted a user study to compare the retargeting results from a number of existing image retargeting algorithms and established a benchmark of 37 test images with subjective paired comparisons, namely RetargetMe dataset [9]. However, this subjective evaluation method is timeconsuming, laborious and expensive. Thus, an objective assessment metric aiming at automatic visual quality assessment of retargeted images is desirable. Image quality assessment algorithms are generally divided into two categories: double-ended and single-ended [10]. Double-ended metrics require the original image as the reference image to assess the visual quality of the distorted image. It can be further divided into two subclasses: one is the full-reference (FR) metrics which need the complete reference image, and the other is the reduced-reference (RR) metrics which only need part of the reference image. On the contrary, single-ended metrics need no reference image and thus are called no-reference (NR) ones. Traditional visual quality assessment methods usually calculate the similarity between the reference and distorted images to evaluate the visual quality of the distorted image. These objective metrics include MSE (mean squared error), PSNR (Peak Signal-to-Noise Ratio) and so on [10], [11]. These traditional methods are simple and straightforward, but cannot predict the visual quality accurately as the human being. Existing studies have shown that the human being’s perception of natural scenes is much more complicated than the simple statistics used in the
1932-4553 © 2014 IEEE. Personal use is permitted, but republication/redistribution requires IEEE permission. See http://www.ieee.org/publications_standards/publications/rights/index.html for more information.
378
IEEE JOURNAL OF SELECTED TOPICS IN SIGNAL PROCESSING, VOL. 8, NO. 3, JUNE 2014
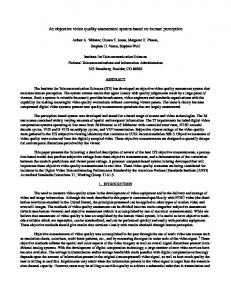
Fig. 1. Typical distortions due to image retargeting: (a) the original image; (b)-(e) retargeted images with various spatial geometric distortion and information loss.
traditional visual quality assessment methods [10]. To better evaluate the visual quality of a distorted images, quite a few perception-based metrics have been proposed, such as the structure similarity (SSIM) metric based on the human visual sensitivity to image structures [11], [12]. Recently, some studies have shown that the eye-tracking data can be used for image retargeting quality assessment [13], [14]. Castillo et al. claimed that the artifacts of retargeted images may not be noticed in the areas outside the regions of interest and the eye-tracking data can be used to improve the prediction capabilities of the image distance metrics [13]. Chamaret et al. proposed a metric to assess the visual quality of a retargeted video based on the following four factors: the ability to keep the visually interesting areas (from eye-tracking data), the temporal coherence of the cropping window, the temporal coherence of its size and the capability to be close to an optimal zoom factor [14]. In [15], Liu et al. proposed an objective metric for quality assessment of image retargeting algorithms based on the global geometric structures and local pixel correspondence. In [16], the authors conducted a large-scale subjective study to assess the visual qualities of retargeted images and built a publicly available dataset containing 171 retargeted images obtained from 57 source images associated with their mean opinion scores (MOS) [17]. Based on the subjective MOS values, the authors further proposed to fuse five objective metrics suggested in [8], including the earth mover’s distance (EMD) [18], the bidirectional similarity [19], Edge histogram [20], and SIFT-flow [21] using a monotonic logistic function. However, the performance of the fused metric is still not satisfactory as reported in [16]. The method proposed in [22] creates an SSIM [12] quality map that indicates at each spatial location of the reference image how the structural information is preserved in the retargeted image. A saliency map is generated as a spatially varying weighting factor of the SSIM map to estimate the visual quality of a retargeted image. Most of the conventional quality assessment metrics require that the sizes of reference image and distorted image should be the same. However, the retargeted images usually have different sizes with the original image due to non-homogeneous resizing. Various metrics used in [8] can be used to assess the quality between two corresponding images with different sizes. However, these metrics are not designed for assessing quality of content-
aware image retargeting that resizes an image in a non-uniform way. Furthermore, as illustrated in Fig. 1, image retargeting usually leads to two kinds of distortions: geometric deformation and information loss. For example, Fig. 1(b)–Fig. 1(d) show some typical types of spatial geometric distortions including distorted lines/edges [see Fig. 1(b) and Fig. 1(c)] and the distorted shapes of a retargeted object [see Fig. 1(d)] due to non-uniform resizing. Besides, Fig. 1(e) shows the significantly reduced size (i.e., information loss) and aspect ratio change of the salience object (the lady). It is, however, difficult to fully quantify such kinds of geometric distortions and information loss using existing visual quality metrics [10]–[12], [16], [18]–[22]. Therefore, the objective quality assessment metric for image retargeting calls for new, careful investigations to capture such kinds of distortions. In this paper, we propose a novel FR objective quality metric to assess the visual quality of a retargeted image. Our goal is to measure human perception of image retargeting impairments using a practical objective metric. While modeling the human perception to retargeting distortions is still a very difficult and challenging problem, we approach the problem in a practical way: converting perceptual impairments in image retargeting into measurable features. We find that geometric distortion and information loss are the two major types of distortions that affect the perceptual visual quality of a retargeted image the most. Based on the finding, our method measures the amounts of perceptual geometric distortion and information loss in a retargeted image based on dense correspondence estimation (e.g., SIFT flow in [21]), and further utilizes a visual saliency map to quantify human perception of the geometric distortion and information loss. The contribution of the proposed method is three-fold: (i) we propose a novel perceptual geometric distortion metric based on the local variance of the SIFT-flow vector filed between the original image and its retargeted version; (ii) we propose a novel metric to quantify the information loss of a retargeted image which, to the best of our knowledge, was never addressed before; and (iii) we propose a method to fuse the above two metrics to derive the final quality metric for image retargeting. Compared with the preliminary conference version of this paper [30], the paper has been significantly extended in the following aspects: (i) In this paper, we proposes a new adaptive
HSU et al.: OBJECTIVE QUALITY ASSESSMENT FOR IMAGE RETARGETING
379
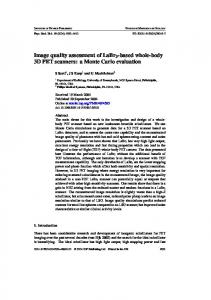
Fig. 2. Block diagram of the proposed quality assessment method. The upper part shows the key modules for evaluating perceptual geometric distortion (PGD), and the lower part shows the key modules for saliency loss ratio estimation.
fusion scheme to automatically determine the weights between the two metrics: perceptual quality distortion and salient information loss, which effectively improves the performance of the proposed metric. (ii) This paper provides in-depth analyses and interpretations about the experimental results to offer good insights about the proposed method to make it a useful tool for quality assessment and algorithm development in image retargeting applications. (iii) We have added the complexity analysis of the proposed method. The rest of this paper is organized as follows. Section II gives an overview of the proposed method. In Section III and IV, we describe the details of the proposed two metrics. Section V describes how to combine the two proposed metrics to obtain the final quality metric. Section VI presents the experimental results. The final section concludes the paper. II. OVERVIEW OF THE PROPOSED QUALITY METRIC Advanced content-aware image retargeting schemes perform non-uniform scaling in nature such that, under a size budget, visually important content is preserved as much as possible, while non-important content can be trimmed more. Such non-uniform scaling, however, often leads to severe local geometric distortions, such as distorted lines, shapes or textures, which can be visually very annoying. Therefore, to assess the visual quality of a retargeted image objectively, human perception on both types of distortions, information loss and geometrical distortion, need to be well characterized by an objective quality metric. Traditional quality metrics such as MSE, PSNR, and SSIM, however, cannot do a good job in assessing the visual quality of a retargeted image because they cannot well capture the geometrical distortion as well as measure the information loss. As reported in [8], the current quality metrics cannot achieve consistent results with subjective evaluation. The proposed method aims to systematically address the above problem by taking into account simultaneously perceptual geometric distortion and information loss so as to make the accuracy of objective quality assessment close to that of subjective evaluation. Fig. 2 shows the block diagram of the proposed
method. First, to measure the perceptual geometric distortion (PGD), a pixel-wise dense correspondence map between the original image and its retargeted version is established such that the change on a shape or a structure caused by image retargeting can be identified via measuring the local variance of the correspondence vectors. We adopt the SIFT flow estimation scheme proposed in [21], which is kind of generalized optical flow estimation, to establish the correspondence map between the original and retargeted images. Then, a visual saliency map (VSM) is derived based on the model proposed in [25] to determine the weights of patch-wise geometric distortions based on the visual importance of these patches. Furthermore, a local confidence map (LCM) based on the matching residue of SIFT flow vector filed is generated to control the PGD weight of each patch. The second metric, information loss, represents the ratio of the salient content discarded by the retargeting process. Our method measures the information loss caused by retargeting by estimating the saliency loss ratio (SLR), which is the ratio of the amount of saliency value lost in retargeting to the total saliency value of the original image. To this end, the saliency map of the original image is warped to the size of retargeted image based on the pixel correspondences provided by the SIFT flow map, as depicted in the lower part of Fig. 2. The pixel-wise saliency values in the warped (retargeted) saliency map are summed up to obtain the preserved saliency value. As a result, the SLR can be obtained accordingly. In the following section, the method for measuring perceptual geometric distortion and information loss shall be elaborated. III. PERCEPTUAL GEOMETRIC DISTORTION ANALYSIS To estimate the perceptual geometric distortion, our method needs to generate two maps: the dense correspondence map and the saliency map. As mentioned above, we adopt SIFT flow [21] to establish the dense correspondence map between two images even if they are slightly dissimilar to each other, since SIFT flow can effectively overcome the matching problem caused by content change in retargeting. Let and respectively denote
380
IEEE JOURNAL OF SELECTED TOPICS IN SIGNAL PROCESSING, VOL. 8, NO. 3, JUNE 2014
Fig. 3. Illustration of the relationship between geometric distortion and SIFT flow map: (a) the original image; (b) the retargeted image; (c) two patch-level variance maps of SIFT flow vectors; (d) the estimated SIFT flow map between (a) and (b); (e) the filtered SIFT flow map; and (f) the local variance map of the filtered SIFT Local variance map of (e).
the original image and the retargeted image, the SIFT flow map between and is obtained by minimizing the following objective function [21]:
(1) denotes the SIFT flow vector of pixel , and where respectively denote the threshold values for selecting only those differences of pixels and differences of flow magnitudes smaller than the two thresholds to be included in the computation, and are the weights for the second and third terms, and represent the horizontal and vertical components of a SIFT flow vector, and denotes the coordinate of the neighbor set of . To evaluate the distortion of a retargeted image, our metric generates three maps: geometric distortion map (GDM), visual saliency map (VSM), and local confidence map (LCM). As illustrated in Fig. 3, our method first estimates the SIFT flow map between the original image and its retargeted version. The SIFT flow map is then partitioned into overlapping patches of size 10 10, where two horizontally (vertically) neighboring patches are overlapped with each other by 2 pixels in width (height). For each patch in the SIFT flow map, the GDM, VSM, and LCM are calculated and combined to obtain the quality metric PGD. The higher the PGD is, the poorer the quality of the retargeted image becomes. Geometric Distortion Map (GDM). The aim of the proposed GDM is to measure the local geometric distortion in a retargeted image, such as a twisted line or a distorted shape of an object. Such local geometric distortion usually leads to local variations in the estimated correspondence vectors between the original and retargeted images. Since SIFT flow offers promising estimates of correspondences between two images, the geometric distortion
can be measured by computing the variance of SIFT flow vectors in a local patch. Assume the original image is resized from to . Let and denote the horizontal and vertical components of SIFT flow vector of patch , the GDM can be obtained by computing
(2) where and respectively represent the ratios of the width and height of the retargeted image to that of the original image , where , , and denotes the variance function. In (2), when an image is downscaled more in one dimension, the variance in that dimension will be weighted more. Fig. 3(a) and Fig. 3(b) illustrate two patches with different levels of geometric distortion and their corresponding patchlevel variance tables of SIFT flow vectors. We can observe that the geometric distortion of is significantly severer than that of . Besides, Fig. 3(c) shows the patch-level variance of SIFT flow vectors in is much larger than that in , indicating that the local variance of SIFT flow image can well capture the geometric distortion. Although SIFT flow can provide fairly good estimates of dense correspondences with discriminating features between two images, it may still result in quite a few mismatches for those correspondences with weak gradient features. These mismatches mostly appear in the estimated SIFT flow map as isolated noises, as illustrated in Fig. 3(d), which will reduce the accuracy of geometric distortion estimation. To remove such speckle noise in the SIFT flow map prior to patch-based local variance analysis, we adopt the anisotropic diffusion filter proposed in [22] which iteratively calculates the output image as follows:
(3)
HSU et al.: OBJECTIVE QUALITY ASSESSMENT FOR IMAGE RETARGETING
381
Fig. 4. An example of the LCM, VSM, and GDM maps.
where represents the gradient of SIFT flow map, and stand for the smoothness and sharpness functions, respectively, is either 4 or 8 for 4- or 8-connected neighbors, and denotes the neighboring pixels of pixel . Since anisotropic diffusion filter is used to detect significant defects like large isolated speckle noise and suppress ingnorable defect. Besides removing small isolated noises (say, less than 2 2) to improve the reliability of the SIFT flow map, thanks to the sharpness function used, the anisotropic diffusion filter can also highlight the regions with large local variance in the SIFT flow map, making it easier to extract these region. Fig. 3(e) illustrates the filtered version of Fig. 3(d), showing that much noise has been removed and high-variance regions have been enhanced. Local Confidence Map (LCM). Note that SIFT flow estimation is not always accurate, which can degrade the accuracy of the propose geometric distortion metric. To address this problem, we propose to use LCM to measure the pixel-wise confidence level of a patch in GDM based on the residue image , where denotes the original image and the reconstructed image de-warped from the retargeted image using the estimated SIFT flow map. By de-warping the retargeted image back to the original image, we can evaluate the SIFT-flow based prediction residue to obtain the LCM of patch as follows:
(4) where denotes the patch size, denotes the SIFT flow vector of pixel , is the corresponding pixel location after the SIFT flow-based compensation, is the de-warped image based on , and is a small positive value to avoid the divided-by-zero error. It is clear that if a correspondence between two images is perfectly matched, the residue will be small. As a result, a large value in indicates a mismatch in SIFT flow, meaning that the geometric distortion estimated
based on such a mismatch vector is unreliable. We can therefore use the residue image to measure the confidence level of geometric distortion estimation. Visual Sensitivity Map (VSM). After deriving the GDM map that captures the local geometric distortion of individual patches, to better characterize the human visual perception of the geometric distortion, the distortion values of patches need to be properly weighted based on the visual importance of patches. To this end, we use the VSM to determine the weight value of a patch in the GDM. There exist several visual sensitivity/ saliency models which can be used to derive the VSM, such as the Just-Noticeable-Difference (JND) model proposed in [24] and the frequency domain-based visual attention model in [25]. We choose to use the visual saliency model in [25] to calculate the saliency map of the original image. The VSM of patch can then be estimated as follows: (5) denotes the patch size. where Finally, the perceptual geometric distortion of a retargeted image can be obtained by combining the GDM, LCM, and VSM indices as follow: (6) represents the number of the patches in the SIFT flow where map. Note, before the combination, these three patch-level indices are all normalized into the range of [0,1] based on the minimal and maximal index values among the patches in an image. Fig. 4 illustrates the GDM, LCM, and VSM of the five retargeted versions of a test image. In this example, the SHIFT-map [26] and Multi-operator [5] schemes lead to relatively higher local variance on the left boundary of their GDM maps due to inaccurate SIFT flow estimation in the smooth background (the sky) and textured background (the sea and
382
IEEE JOURNAL OF SELECTED TOPICS IN SIGNAL PROCESSING, VOL. 8, NO. 3, JUNE 2014
Fig. 5. Comparison of two retargeted images (400 336) in terms of their perceptual geometric distortion and information loss rate: (a) Original image (300 336) and the retargeted images using (b) Multi-operator ( , ), (c) Shift-map ( , , (d) Uniform scaling , ), (e) Seam carving ( , ). (
Fig. 6. Flow diagram of the proposed information loss estimation scheme. (a) The original image and (b) the retargeted image are first used to estimate the SIFT flow map. Then, (c) the saliency map of the original image is warped to obtain (d) the saliency map of the retargeted image. Consequently, the performance metric, saliency loss ratio (SLR), is obtained by calculating the ratio between the trimmed amount of saliency in the retargeted image and that of the original image.
seashore). However, there is no visually significant distortions in the two retargeted images obtained by SHIFT-map and Multi-operator. The LCM can successfully suppress such kind of false detection of distortion due to SIFT flow mismatches. Besides, the VSM gives salient regions higher weights to emphasize these regions. IV. INFORMATION LOSS ESTIMATION In addition to geometric distortion, the other major distortion caused by image retargeting is information loss. It is therefore desirable to develop another metric to measure the information loss due to retargeting for accurately assessing the visual quality of a retargeted image. For example, as shown in Fig. 5, the PGD values of the two retargeted images in Fig. 5(c) and Fig. 5(e) are 0.44 and 0.33, respectively, meaning that Fig. 5(c) obtained by shift-map has larger geometric distortion due to the missing parts of the peacock. However, apparently shift-map preserves significantly more salient information compared to seam carving. Besides, the PGD values of Fig. 5(b) and Fig. 5(d) are close to each other (0.14 and 0.15), whereas their SLR values are 0.16 and 0.24. Fig. 5(b) looks visually much better then Fig. 5(d) as Fig. 5(b) preserves more information in the salient object. Therefore, while assessing the quality of a retargeted image, the information loss due to retargeting should also be taken into account. To measure the information loss caused by image retargeting, we propose to use the saliency loss ratio (SLR) that is
the ratio between the sums of saliency values of the images after and before retargeting. Ideally, if we have the saliency maps of the original image and its retargeted version, the information loss can be easily measured by comparing these two maps. Since we already have the saliency map of the original image when estimating the VSM by (5), we only need the saliency map of the retargeted image. However, directly estimating the saliency map of the retargeted image from the retargeted image itself may not achieve good accuracy because the content of the retargeted image has been significantly reduced, implying the relative importance of pixels may be changed significantly. Instead, as shown in Fig. 6, we propose to derive the preserved saliency map of the retargeted image by warping the saliency map of the original image based on the SIFT flow map between the original and retargeted images that has been obtained by (1) in estimating the geometric distortion. Consequently, the SLR metric can be obtained by calculating the ratio between the trimmed amount of saliency in the retargeted image and that of the original image as elaborated below. Let and denote the saliency maps of the original and retargeted images, respectively. We adopt the SIFT flow map estimated by (1) previously to warp the saliency map of the original image to the retargeted image to estimate the retargeted saliency map as follows: (7)
HSU et al.: OBJECTIVE QUALITY ASSESSMENT FOR IMAGE RETARGETING
383
may lead to a noisy saliency map, small salient regions should not be considered while counting . In our experiments, only those salient regions having a size of larger than 200 pixels are counted into . VI. EXPERIMENTAL RESULTS
Fig. 7. (a), (d) Input images, (b), (e) the detected saliency maps, and (c), (f) The results of the connected-component labeling on (b), (e), respectively.
where represents the warped pixel-wise saliency map based on the SIFT flow vector of pixel . As a result, the size of is the same as that of the retargeted image. Note, may have a few holes which can be filled using interpolation or inpainting. Consequently, the SLR can be estimated as follows: (8) where the value of
falls in the range of [0,1].
V. FUSION OF PGD AND SLR Finally, the retargeting quality index tracting the normalized overall distortion
is defined as subfrom unity: (9)
is a weighted sum of the proposed PGD and SLR where indices, which falls in the range of [0,1], and is used to control the weights for SLR and PGD indices. To determine the value of , we use a heuristic approach. Note, human perception is sensitive to the information loss (i.e., the SLR metric), when there is a strongly dominating salient object(s). For example, Fig. 7 illustrates two saliency maps detected for two different images: Fig. 7(d) that contains a dominating salient object and Fig. 7(a) that has no dominating salient object, showing that a saliency map may contain several isolated salient regions if there is no dominating salience object in the input image. A saliency map containing too many isolated salient regions usually implies that the image has no dominating salient objects or it is not reliable. In this case, the SLR metric will be less important and its weight should be discounted. To achieve adaptive weighting of PGD and SLR, we first perform connected component labeling on the detected saliency map and then count the number of connected salient regions, as shown in Fig. 7(c) and Fig. 7(f), for example. As a result, we use the number of connected salient regions in the detected saliency map to control the weight in (9) as follows: if otherwise
In our experiments, we evaluate the accuracy of the proposed objective quality metric on the datasets provided in the RetargetMe dataset [9], and another dataset with 35 images selected from [1], [5], [17], in terms of the consistency of the proposed metric with the subjective evaluation results for the datasets. Note that the subjective evaluation results of the RetargetMe dataset are taken from [9], and the subjective tests for the second dataset were performed by ourselves. All the datasets, codes, saliency maps, and subjective rankings used in this paper can be found in our project page [29]. Generally, human beings’ eyes are sensitive to salient regions of images. Content-aware image retargeting algorithms tend to preserve important regions and trim visually unimportant regions when resizing an image. Since the perceived quality of a retargeted image is mainly determined by the geometric distortion and information loss, the original images are presented to the subjects as the reference images in the experiment. For the RetargetMe dataset we compared all the eight retargeting schemes used in [9], whereas for the second dataset, since we did not have all the implementations of the eight schemes, we chose five of them to perform the evaluations: Multi-Operator [5], Seam Carving [1], Warping [2], Shift-Maps [26], and Uniform Scaling. The retargeting algorithms change the resolution of the source images in one dimension (either in width or in height) only. In this experiment, we focus on the reduction in image sizes by a reasonable resizing scale (say, 25%) to generate the retargeted images. Subjective paired comparisons are used as ground-truths to evaluate the accuracy of the objective quality metrics. To obtain the subjective paired comparison data, the subjects are shown two retargeted images (in a random order) at a time, side by side, and are asked to simply choose the one they prefer. For each image, the retargeted images obtained from different retargeting algorithms are ranked in pairs subjectively and objectively. The objective ranking is performed using four metrics: the proposed metric, the metric proposed in [15], SIFT flow [21], and EMD [18]. The correlation between the subjective paired rankings and the objective paired rankings based on a quality metric is used to measure the consistency between the subjective and objective results, indicating the ability of each metric in quantifying the human perception on the visual quality of a retargeted image. Similar to that proposed in [8], we use the Kendall distance [27] to measure the correlation between the subjective rankings and the objective rankings by a quality metric as follows: (11)
(10)
is the total number of connected salient regions in where a saliency map, and is a normalization factor, where empirically. Considering the inaccuracy of the saliency detector
and where is the total number of pairs for comparison, respectively represent the numbers of concordant pairs and discordant pairs between the subjective ranking and the objective ranking. Notice that in case of perfect agreement between
384
IEEE JOURNAL OF SELECTED TOPICS IN SIGNAL PROCESSING, VOL. 8, NO. 3, JUNE 2014
Fig. 8. Three example images from the RetargetMe dataset [9]. The types of the images (a), (b), and (c) are “lines/edges and geometric”, “face/people and foreground”, and “geometric structure and texture”.
RANK CORRELATION
TABLE I OBJECTIVE AND SUBJECTIVE MEASURES FOR THE RETARGETME DATASET [9]. (a) Complete rank correlation ( is unlimited); (b) Rank correlation with respect to the three highest rank results OF
the ranking and objective rankings, and is case of perfect disagreement. In the case that , the subjective and objective rankings are considered independent. A. Performance Evaluation on the RetargetMe Dataset [9] We first evaluate the accuracy of the proposed metric on the RetargetMe dataset containing 37 images with subjective paired comparison results [8], [9]. The resized images obtained by eight retargeting schemes were subjectively evaluated by 38 subjects in a paired comparison manner. That is, a subject compared two retargeted images of an image obtained by two different methods and voted for the better quality one. Note that the 37 images in the dataset are classified into the following attributes: lines/edges (25), faces/people (15), texture (6), foreground objects (18), geometric structures (16), and symmetry (6), where the numbers in the parenthesis indicate the number
of test images in individual classes. One image may be associated with multiple attributes, as illustrated in the three examples in Fig. 8. The proposed metric is compared with the other three metrics, including SIFT flow, EMD, and the metric proposed in [15]. Because both our proposed metric and the metric proposed in [15] require the saliency maps of test images to evaluate the retargeting performance, we implemented two image saliency detection methods proposed in [28] and [25] to generate the saliency maps of individual test images. Table I compares the rank correlation values, measured by the Kendall distance defined in (11), between the compared metrics and the subjective ranking for individual attribute classes, and the mean and standard deviation of the rank correlation, and the -value and linear correlation-coefficient (LCC). In Table I, we follow the experiment setting suggested in [8] to test the complete ranking correlation (the
HSU et al.: OBJECTIVE QUALITY ASSESSMENT FOR IMAGE RETARGETING
385
Fig. 9. Extreme cases in the RetargetMe dataset. (a)–(c): the three images with the most consistent subject paired comparison results from different subjects; (d)–(f): the image with the most diverse subjective paired rankings.
rankings for all the five methods for each test image are used in the calculation of correlation values) and the top 3 ranking correlation (only the rankings for the three top ranked retargeting methods for each test image are used in the calculation of correlation values) for the performance comparison. Since the top 3 ranking results in much more reliable results (i.e., the subjective rankings are more confident and consistent), the correlation values between the subjective and objective rankings are higher than that in the complete ranking results. We do not put the -value and the LCC value in Table I(b) because LCC and -value with top-3 ranking only do not provide meaningful statistical value. All the results show that the proposed PGD+SLR metric significantly outperforms the other metrics. In the complete ranking comparison, our metric achieves more than 64.5% improvement over the other metrics, while in the top 3 ranking comparison, our metric achieves more than 62.5% improvement. Note, the rank correlation value for the texture-class images is the lowest because the SIFT flow estimation for an image with lots of textures may obtain partially unreliable SIFT flow map due to mismatches in texture regions. Note, the RetargetMe dataset in [8], [9] contains quite a few images for which the visual qualities of their retargeted images are not easy to judge subjectively because these images have no obvious salient content or their retargeted versions do not have significant geometric distortions. Therefore, these test images do not provide good discriminating power when used in evaluating the accuracy of objective quality metrics by rank correlation. For example, Fig. 9 illustrates some extreme examples in RetargetMe: the three test image with the most consistent subjective paired rankings [see Fig. 9(a)–Fig. 9(c)] and the three with the most diverse rankings [see Fig. 9(d)–Fig. 9(f)]. Because the test images in Fig. 9(a)–Fig. 9(c) all contain dominant salient objects, the geometric distortions and information losses in its retargeted images can be easily identified, making the subjective paired rankings from different subjects rather consistent. On the contrary, most of the retargeted images of the test images shown in Fig. 9(d)–Fig. 9(f) have similar visual qualities subjectively, leading to rather diverse paired comparison results. For example, as shown in Fig. 10, all the retargeted images of the image shown in Fig. 9(d) obtained by different methods seem to have similar visual quality subjectively. As a result, the subjects might give an unconfident and unreliable ranking of two compared images, thereby reducing the rank correlation between the
Fig. 10. (a) The test image with the most inconsistent subjective paired rankings in the RetargetMe dataset [also see Fig. 9(d)] and (b)–(f) its retargeted versions using five different retargeting methods. The visual qualities of the retargeted images in (b)–(f) look similar subjectively, thereby leading to diverse subjective paired rankings.
Fig. 11. Comparison of rank correlation values between the subjective and objective paired rankings using three objective quality metrics for the Top ( , 10, 15, and 37) images with the most consistent subjective paired comparison results in the RetargetMe dataset.
subjective evaluations and the objective metrics. Fig. 11 compares the rank correlation values between the subjective and objective paired rankings using three objective quality metrics for the Top ( , 10, 15, and 37) images with the most consistent subjective paired comparison results in the RetargetMe dataset. It shows that removing those test images with unreliable subjective rankings from RetargetMe would effectively increase the rank correlation between the subjective and objective test results and can increase the discrminating power of the dataset for evaluating the actual accuracy of objective quality metrics B. Evaluation on the Second Dataset With More Consistent Subjective Rankings To build a dataset with better discriminating power in performance evaluation of quality metrics for image retargeting, as
386
IEEE JOURNAL OF SELECTED TOPICS IN SIGNAL PROCESSING, VOL. 8, NO. 3, JUNE 2014
Fig. 12. The proposed additional image dataset containing 35 test images selected from [1], [5], and [17], based on the consistency of their subjective paired comparison results.
Fig. 13. Individual rank correlation values between the proposed PGD, SLR, and PGD+SLR metrics and the subjective test results for the 35 test images in the second dataset.
illustrated in Fig. 12, we collect 35 images from the test images provided in [1], [5], and [17]. The second dataset fully covers the dataset in [17] and therefore [17] can be regarded as a subset of the second dataset. We evaluate the subjective visual quality on five selected image retargeting algorithms used in [8], therefore the number of comparison pairs for all the 35 images is 350. We invite 30 subjects to do the subjective test and each subject votes for 140 image pairs and thus each image pair is voted by 12 subjects (times). The subjects include 30 males and 5 females, who were 25 years old on average. The test device includes a full-HD 24-inch LCD display with color temperature 6500 K. Before the test, each subject was shown with some example images to learn about the typical types of retargeting artifacts. Similar to the subjective test procedure described in [8], the original image (on the top of the screen) and two retargeted images (unlabeled and placed in a random order on the bottom) obtained by two different retargeting schemes are shown to a subject. The subject is asked to vote for the retargeted image with relatively better visual quality according to the reference image. Fig. 13 shows the rank correlation values for individual test images using the proposed PGD, SLR and the PGD+SLR metrics based on this dataset. Since five retargeting schemes are compared for this dataset, there are totally 10 paired comparisons for each test image. The results show that the proposed PGD+SLR metric achieves 0.8 or more rank correlation with the subjective results for 20 out of 35 test images. Moreover, the combined PGD+SLR metric achieves (for 22 images) and even outperforms (for 8 images) the best rank correlation of using
the PGD metric and the SLR metric solely for 30 out of the 35 test images (86%), indicating that, compared to PGD and SLR metrics, the combined PGD+SLR metric can better match the human perception of visual quality most of the time. Table II shows the average rank correlation measured by the Kendall distance and the standard deviation of correlation over 35 test images. The results show that correlation value between the rankings using the proposed PGD+SLR metric and the subjective rankings is 0.69, corresponding to an average precision of 84.5% and an average error rate of 15.5%, which is a very promising result. Compared to the other metrics where the second best is EMD with a rank correlation value of 0.36 (corresponding to an average precision rate of 68% and an average error rate of 32%), the proposed metric is significantly more consistent with the subjective results, showing that the proposed metric outperforms the others in terms of the ability in characterizing the human perception of visual quality. In addition, the standard deviation of correlation of the proposed metric is also close to the lowest, meaning that its performance is rather stable. Fig. 14 compares the performances of the adaptive fusion scheme in (9) and (10) and fixed weighting scheme, where the blue lines indicate the rank correlation values with varying from 0 to 1 with a step-size of 0.1. The result shows that the proposed adaptive fusion scheme outperforms the fixed weighting scheme with various weighting values because different images may need different weighting values as discussed in Section IV. Note, an additional advantage of the proposed metric is that it can localize the geometric distortions on a retargeted image since the proposed PGD metric is based on the local variance of
HSU et al.: OBJECTIVE QUALITY ASSESSMENT FOR IMAGE RETARGETING
387
TABLE II RANK CORRELATION OF OBJECTIVE AND SUBJECTIVE MEASURES FOR THE ADDITIONAL DATASET
Fig. 14. Rank correlation value versus the weight value weights between SLR and PGD.
for controlling the
SIFT flow vector field. As indicated in red in Fig. 15, the multioperator algorithm presents relatively fewer geometric distortion in the retargeted image compared to the others. In contrast, the seam carving and warping schemes leads to severer geometric distortion on the salient objects. Therefore, our proposed metric not only evaluates the amount of geometric distortion in a retargeted image, but also provides a tool to localize the geometric distortion, which is useful in analyzing the characteristics of a retargeting scheme for further improvement. C. Computational Complexity Our method takes about 115 seconds for assessing an image (retargeted from 768 512 to 576 512) on a quad-core (Intel i7) personal computer with 16 GB RAM using Matlab without any code optimization. In our method, the SIFT flow estimation, saliency map estimation, and rest operations consume about 85%, 12%, 3% of the computation, respectively. The complexity of the most dominating operation SIFT flow estimation for an image for one iteration is [21]. The other operations are of complexity. Note, the SIFT flow estimation can be replaced with the fast dense correspondence matching scheme proposed in [31] which was reported to be much faster than SIFT flow while achieving comparable accuracy, or with the method proposed in [32].
Fig. 15. (a) The original image, and the visualized perceptual distortion maps obtained from (b) multi-operator method, (c) seam carving, (d) Shift-map, and , 0.42, 0.8, (e) warping method. Their overall quality indices are and 0.65, respectively.
D. Limitations Our method also has its limitations. First, the accuracy of the SIFT flow map has significant impact on the accuracies of the PGD and SLR metrics. For some images with lots of repeated texture patterns or very smooth areas, the SIFT flow estimation may not work well for some parts of the images as it may find incorrect correspondences in these parts. Usually, the inaccuracy of SIFT flow for smooth areas does not have much impact on the accuracy of the proposed metric since the geometric distortion and information loss are visually less significant in smooth areas. But for textured regions, the inaccuracy does matter. For the 10 highly textured images in the two datasets consisting of
388
IEEE JOURNAL OF SELECTED TOPICS IN SIGNAL PROCESSING, VOL. 8, NO. 3, JUNE 2014
72 test images, the rank correlation values are all below the average. Besides, unreliable saliency maps will reduce the accuracies of PGD (due to unreliable VSM) and SLR metrics. VII. CONCLUSIONS In this paper, we proposed a novel objective metric for visual quality assessment of retargeted images; the proposed approach is among the initial attempts in this much meaningful and less-investigated area of research in visual quality evaluation as most of the existing methodologies in perceptual visual quality metrics cannot successfully apply in this context because of the non-uniform content changes in retargeted images. The main contribution of the proposed metric lies in that the perceptual geometric distortion and information loss are taken into account simultaneously, thereby better characterizing the human perception on the visual quality of a retargeted image compared with existing metrics. We have proposed a FR method for measuring the geometric distortion of a retargeted image based on the local variation in the SIFT flow image estimated from the original and retargeted images. Note that a FR method in retargeting cases are different from one in general visual quality evaluation developed so far, since the reference image available here is with a different size and significant content change compared with the image(s) being evaluated. Furthermore, a visual saliency map is derived to characterize human perception of the geometric distortion. Based on the estimated SIFT flow image and saliency map, we have also proposed a method for measuring the information loss due to image retargeting. Our experiments show that the superior performance of the proposed metric in terms of the consistency with subjective evaluation results, compared with the relevant existing metrics. The experimental results have confirmed a performance leap from the relevant state-of-the-art techniques in the area. REFERENCES [1] S. Avidan and A. Shamir, “Seam carving for content-aware image resizing,” ACM Trans. Graphics, vol. 26, no. 3, pp. 10:1–10:9, 2007. [2] Y. Guo, F. Liu, J. Shi, Z.-H. Zhou, and M. Gleicher, “Image retargeting using mesh parameterization,” IEEE Trans. Multimedia, vol. 11, no. 5, pp. 856–867, Aug. 2009. [3] Y.-S. Wang, C.-L. Tai, O. Sorkin, and T.-Y. Lee, “Optimized scaleand-stretch for image resizing,” ACM Trans. Graphics, vol. 27, no. 5, pp. 118:1–118:8, 2008. [4] L. Wolf, M. Guttmann, and D. Cohen-Or, “Non-homogeneous content-driven video retargeting,” in Proc. Int. Conf. Comput. Vis., Rio de Janeiro, Brazil, Oct. 2007, pp. 1–6. [5] M. Rubinstein, A. Shamir, and S. Avidan, “Multi-operator media retargeting,” ACM Trans. Graphics, vol. 28, no. 3, pp. 23 :1–23:11, 2009. [6] T.-C. Yen, C.-M. Tsai, and C.-W. Lin, “Maintaining temporal coherence in video retargeting using mosaic-guided scaling,” IEEE Trans. Image Process., vol. 20, no. 8, pp. 2339–2351, Aug. 2011. [7] B. Li, L. Duan, J. Wang, R. Ji, C.-W. Lin, and W. Gao, “Spatiotemporal grid flows for video retargeting,” IEEE Trans. Image Process., vol. 23, no. 4, pp. 1615–1628, Apr. 2014. [8] M. Rubinstein, D. Gutierrez, O. Sorkine, and A. Shamir, “A comparative study of image retargeting,” ACM Trans. Graphics, vol. 29, no. 6, pp. 160:1–160:9, 2010. [9] RetargetMe Benchmark [Online]. Available: http:// http://people.csail. mit.edu/mrub/retargetme/index.html [10] W. Lin and C.-C. Jay Kuo, “Perceptual visual quality metrics: A survey,” J. Vis. Commun. Image Represent., vol. 22, no. 4, pp. 297–312, May 2011.
[11] Z. Wang and A. C. Bovik, “Mean squared error: Love it or leave it?—A new look at fidelity measures,” IEEE Signal Process. Mag., vol. 26, no. 1, pp. 98–117, Jan. 2009. [12] Z. Wang, A. C. Bovik, H. R. Sheikh, and E. P. Simoncelli, “Image quality assessment: From error visibility to structural similarity,” IEEE Trans. Image Process., vol. 13, no. 4, pp. 600–612, Apr. 2004. [13] S. Castillo, T. Judd, and D. Gutierrez, “Using eye-tracking to assess different image retargeting methods,” in Proc. ACM SIGGRAPH Symp. Appl. Percept. Graphics Vis. (APGV), 2011, pp. 7–14. [14] C. Chamaret, O. L. Meur, P. Guillotel, and J.-C. Chevet, “How to measure a relevance of a retargeting approach,” in Proc. Workshop Media Retargeting, Eur. Conf. Comput. Vis., 2011. [15] Y.-J. Liu, X. Liu, Y.-M. Xuan, W.-F. Chen, and X.-L. Fu, “Image retargeting quality assessment,” Comput. Graphics Forum, vol. 30, no. 2, pp. 583–592, 2011. [16] L. Ma, W. Lin, C. Deng, and K.-N. Ngan, “Image retargeting quality assessment: A study of subjective and objective metrics,” IEEE J. Sel. Topics Signal Process., vol. 6, no. 5, pp. 626–639, Oct. 2012. [17] Image Retargeting Subjective Database [Online]. Available: http:// ivp.ee.cuhk.edu.hk/projects/demo/retargeting/index.html [18] O. Pele and M. Werman, “Fast and robust earth mover’s distances,” in Proc. Int. Conf. Comput. Vis., Oct. 2009, pp. 460–467. [19] D. Simakov, Y. Caspi, E. Shechtman, and M. Irani, “Summarizing visual data using bidirectional similarity,” in Proc. IEEE Conf. Comput. Vis. Pattern Recognit., Anchorage, AK, USA, Jun. 2008, pp. 1–8. [20] B. S. Manjunath, J. R. Ohm, V. V. Vasudevan, and A. Yamada, “Color and texture descriptors,” IEEE Trans. Circuits. Syst. Video Technol., vol. 11, no. 6, pp. 703–715, Jun. 2001. [21] C. Liu, J. Yuen, and A. Torralba, “SIFT flow: Dense correspondence across scenes and its applications,” IEEE Trans. Pattern Anal. Mach. Intell., vol. 33, no. 5, pp. 978–994, May 2011. [22] Y. Fang, K. Zeng, Z. Wang, W. Lin, Z. Fang, and C.-W. Lin, “Objective quality assessment for image retargeting based on structural similarity,” IEEE J. Emerg. Sel. Topics Circuits Syst., vol. 3, no. 1, pp. 95–105, Mar. 2014. [23] S.-M. Chao and D.-M. Tsai, “An anisotropic diffusion-based defect detection for low-contrast glass substrates,” J. Image Vis. Comput., vol. 26, no. 2, pp. 187–200, Feb. 2008. [24] X. K. Yang, W. Lin, Z. K. Lu, E. P. Ong, and S. S. Yao, “Just noticeable distortion model and its applications in video coding,” Signal Process.: Image Commun., vol. 20, no. 7, pp. 662–680, Jun. 2005. [25] Y. Fang, W. Lin, Z. Chen, and C.-W. Lin, “Saliency detection in the compressed domain for adaptive image retargeting,” IEEE Trans. Image Process., vol. 21, no. 9, pp. 3888–3901, Sep. 2012. [26] Y. Pritch, E. Kav-Venaki, and S. Peleg, “Shift-map image editing,” in Proc. Int. Conf. Comput. Vis., Kyoto, Japan, Oct. 2009, pp. 151–158. [27] M. G. Kendall, “A new measure of rank correlation,” Biometrika, pp. 81–93, 1938. [28] L. Itti, “Automatic foveation for video compression using a neurobiological model of visual attention,” IEEE Trans. Image Process., vol. 13, no. 10, pp. 1304–1318, Oct. 2004. [29] NTHU Image/Video Retargeting Quality Assessment Project, [Online]. Available: http://www.ee.nthu.edu.tw/cwlin/Retargeting_Quality/index.html [30] C.-C. Hsu, C.-W. Lin, Y. Fang, and W. Lin, “Objective quality assessment for image retargeting based on perceptual distortion and information loss,” in Proc. Visual Commun. Image Process., Sarawak, Malaysia, Nov. 2013. [31] J. Kim, C. Liu, F. Sha, and K. Grauman, “Deformable spatial pyramid matching for fast dense correspondences,” in Proc. IEEE Conf. Comput. Vis. Pattern Recognit., Portland, OR, USA, Jun, 2013, pp. 2307–2314. [32] Y. HaCohen, E. Shechtman, D. B. Goldman, and D. Lischinski, “Nonrigid dense correspondence with applications for image enhancement,” ACM Trans. Graphics, vol. 30, no. 4, p. :70:1−70:9, 2011.
Chih-Chung Hsu received his B.S. degree in Information management from Ling-Tung University of Science and Technology and M.S. degree in Electrical Engineering (EE) from National Yunlin University of Science and Technology, Taiwan, in 2004 and 2007, respectively. He is currently a Ph.D. candidate in the Department of EE on National Tsing Hua University. His research interests mainly lie in computer vision, image/video processing, and image protection/watermarking. He received a top 10% paper award from the IEEE International Workshop on Multimedia Signal Processing (MMSP) in 2013.
HSU et al.: OBJECTIVE QUALITY ASSESSMENT FOR IMAGE RETARGETING
Chia-Wen Lin (S’94–M’00–SM’04) received his Ph.D. degree in electrical engineering from National Tsing Hua University (NTHU), Hsinchu, Taiwan, in 2000. He is currently an Associate Professor with the Department of Electrical Engineering and the Institute of Communications Engineering, NTHU. He was with the Department of Computer Science and Information Engineering, National Chung Cheng University, Taiwan, during 2000–2007. Prior to that, he worked for the Information and Communications Research Labs, Industrial Technology Research Institute, Hsinchu, Taiwan, during 1992–2000. His research interests include image/video processing and video networking. Dr. Lin has served as an Associate Editor of the IEEE TRANSACTIONS ON CIRCUITS AND SYSTEMS FOR VIDEO TECHNOLOGY, the IEEE TRANSACTIONS ON MULTIMEDIA, the IEEE MULTIMEDIA, and the Journal of Visual Communication and Image Representation. He is also an Area Editor of EURASIP Signal Processing: Image Communication. He also serves as a member of the Steering Committee of the IEEE TRANSACTIONS ON MULTIMEDIA. He is currently Chair of the Multimedia Systems and Applications Technical Committee of the IEEE Circuits and Systems Society. He served as Technical Program Co-Chair of the IEEE International Conference on Multimedia & Expo (ICME) in 2010, and Special Session Co-Chair of IEEE ICME in 2009. He is Distinguished Lecturer of Asia-Pacific Signal and Information Processing Association (APSIPA). His paper won the Young Investigator Award presented by VCIP 2005. He received the Young Investigator Awards presented by National Science Council, Taiwan, in 2006.
Yuming Fang received the B.E. degree from Sichuan University, Sichuan, China, the M.S. degree from Beijing University of Technology, Beijing, China, and the Ph.D. degree in computer engineering from Nanyang Technological University (NTU), Singapore, in February 2013. He is currently a lecturer in the School of Information Technology, Jiangxi University of Finance and Economics, Nanchang, China. He was a visiting Ph.D. student with National Tsing Hua University, Taiwan, from October 2011 to January 2012, and University of Waterloo, Canada, from September 2012 to December 2012. He was a Postdoc Research Fellow in the IRCCyN lab, Poly-Tech’ Nantes and University Nantes, Nantes, France, University of Waterloo, and NTU, Singapore. His research interests include visual attention modeling, visual quality assessment, image retargeting, computer vision, and 3-D image/video processing. Dr. Fang was a Secretary for HHME 2013 and a Special Session Organizer for IEEE VCIP 2013.
389
Weisi Lin (M’92–SM’98) received his Ph.D. from King’s College London. He was the Lab Head and Acting Department Manager for Media Processing, in Institute for Infocomm Research, Singapore. Currently, he is the Associate Chair (Graduate Studies) in Computer Engineering, Nanyang Technological University, Singapore. His research areas include image processing, perceptual multimedia modeling and evaluation, and video compression. He published 270 refereed papers in international journals and conferences. He has been on the editorial boards of IEEE TRANSACTIONS ON MULTIMEDIA, IEEE SIGNAL PROCESSING LETTERS, and Journal of Visual Communication and Image Representation. He currently chairs the IEEE MMTC IG on Quality-ofExperience. He has been elected as an APSIPA Distinguished Lecturer (2012/3). He is the Lead Technical-Program Chair for Pacific-Rim Conference on Multimedia (PCM) 2012 and International Workshop on Quality of Multimedia Experience (QoMEX) 2014, and a Technical-Program Chair for IEEE International Conference on Multimedia and Expo (ICME) 2013. He is a fellow of Institution of Engineering Technology, and an Honorary Fellow, Singapore Institute of Engineering Technologists.