between modified plasticity index and undrained shear strength. Key words: regional soils, Atterberg limits , functional relationships, compaction characteristics, ...
IOSR Journal of Mechanical and Civil Engineering (IOSR-JMCE) e-ISSN: 2278-1684,p-ISSN: 2320-334X, Volume 11, Issue 3 Ver. IV (May- Jun. 2014), PP 109-115 www.iosrjournals.org
Functional Correlations between Compaction Characteristics, Un-drained Shear Strength and Atterberg Limits N. Vijayakumar Raju 1, M. Srimurali 2 , K. Nagendra Prasad 3 1
Research Scholar, Department of Civil Engineering, SVU College of Engineering, Tirupati, India 2 Professor, Department of Civil Engineering, SVU College of Engineering, Tirupati, India 3 Professor, Department of Civil Engineering, SVU College of Engineering, Tirupati, India
Abstract: Undrained shear strength is one of the useful parameters in order to take engineering decisions. Most often the bearing capacity is estimated based on undrained shear strength to make conservative estimates. Some laboratory tests needed to obtain these values are expensive and time consuming, while soil properties like moisture content and Atterberg limits can be performed faster and cheaper. Many empirical formulae are available to estimate the undrained shear strength for fine grained soils like clay or silt. Determining of undrained shear strength and compressibility parameters in laboratory are really tedious and time consuming. Therefore, a correlation between undrained shear strength and Atterberg limits is useful for restraint of testing number and costs. However, a limited effort is made to understand whether such a relationship is possible in case of soils of Tirupati region of Andhra Pradesh. It is noticed that the there exists a definite relationship between modified plasticity index and undrained shear strength. Key words: regional soils, Atterberg limits , functional relationships, compaction characteristics, undrained shear strength
I.
Introduction
Most practical situations necessitate an engineer to characterize and determine engineering properties of materials intended for practical use. Manufactured and synthetic materials satisfy the specifications prescribed, within allowable limits. The inherent nature and diversity of geological processes involved in the soil formation are majorly responsible for the wide variety of soil states. Innovative approaches are needed to predict the soil behavior from simple properties that are obtained in routine soil investigations. These approaches help engineers to verify the test results independently and to use design parameters in preliminary calculations. Many empirical formulae are available to estimate the undrained shear strength for fine grained soils like clay or silt. Determining the undrained shear strength and compressibility parameters in laboratory are really tedious and time consuming. Therefore, a correlation between undrained shear strength and Atterberg limits is useful for restraint of testing number and costs. However, a limited effort is made to understand weather such a relationship is possible in case of soils of Tirupati region of Andhra Pradesh.
II.
Background information
Nagaraj et al (2012) brings out re-examination of undrained strength at Atterberg limits. The study underlines the uniqueness of strength at liquid limit or plastic limit, which is nothing but water holding capacity of different state of consistencies, is not tenable. The concept that plasticity index of soils can be defined as a range of water contents producing a 100-fold variation in undrained shear strength has been experimentally verified with the help of a large number of tests on soils of diverse nature. This has led to the redefinition of the plastic limit as the water content at which undrained shear strength is around 170 kN/m2. Undrained shear strength of a soil at the liquid limit can be considered to be around 1.7 kN/m2. Accordingly, both the liquid limit and the plastic limit have been determined in the present work by a single consistent method, i.e., the Swedish fall cone method. The undrained shear strength-water content relationship has been found to be log-linear for a wide range of water contents beginning from lower than the plastic limit to higher than the liquid limit. This resulted in the formulation of an expression for predicting undrained shear strength of a remolded soil at any water content based solely on its liquid limit and plastic limit (Sharma & Bora, P. 2003). The undrained shear strength of remolded soils is of concern in certain geotechnical engineering applications. Several methods for determining this parameter exist, including the laboratory vane test. This study proposes a new method to estimate the undrained shear strength, particularly at the plastic and liquid limits. For 30 inorganic soil samples of different plasticity levels, we determined the Atterberg limits, then performed a series of reverse extrusion tests at different water contents. The plastic and liquid limits are derived from the linear relationship between the logarithm of the extrusion pressure and water content. The tests show that the average undrained shear strength determined from the extrusion pressures at the plastic limit is about 180 kPa, whereas the average undrained shear strength at the liquid limit is 2.3 kPa. We show that the undrained shear strength of remolded www.iosrjournals.org
109 | Page
Functional Correlations between Compaction Characteristics, Un-drained Shear Strength and Atterberg Limits soils at any water content can be estimated from the Atterberg limits alone. Although the laboratory vane test provides a reasonable undrained shear strength value at the plastic limit, it overestimates the undrained shear strength at the liquid limit and thus, care must be taken when the laboratory vane test is used to determine undrained shear strengths at water contents near the liquid limit (Kayabali et al, 2010). The results of Neelu Das et al (2013 ) indicate that the rate of decrease of undrained shear strength of high liquid limit soils at higher water content is less compared to that at lower water content. An empirical correlation is presented that relates the unsaturated state of compacted soils to the unconfined shear strength (Fernando et al, 2011). In retrospect, the works relate to assessing the undrained strengths at consistency limits such as liquid limit and plastic limit. However, attempts to determine the relationship between undrained strength and Atterberg limits of compacted soils are limited. Accordingly a limited a limited effort is made to understand weather such a relationship is possible in case of soils Tirupati region of Andhra Pradesh Experimental Investigation A series of experiments are conducted on five different soils under consideration to assess the basic properties of soils inured to develop possible interrelationship with the engineering properties so that the results could be applied to engineering applications. The following tests have been conducted on soil samples in accordance with IS Code of practice. Basic Properties Compaction properties Strength Characteristics
III.
Grain size distribution
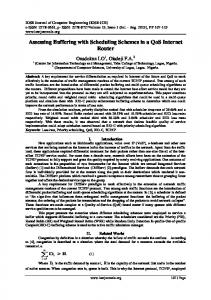
The soil samples have been collected from the surroundings of Tirupati town. The samples have been air dried and sieved through 4.75mm sieve and kept in bins for further testing. The basic soil properties are presented in Table 1 and grain size distribution for the samples tested are presented Figure 1. It may be seen from the Table that soil are classified as per IS 1498-1970 as SC to CH with the plasticity index ranging from 10-40. The fine fraction ranges from 20-90 representing wide variation inherent to the soil properties encountered in the region. The degree of expansion is of the order of 30%, which falls under low degree of swelling as per IS 1498-1970. The gradation curves are also seen to be distantly placed bringing out inherent variation in texture of the soils. Table 1 Basic Properties of Soil Value Sl.No
1 2 3 4 5 6 7 8 9 10 11
Description
Gravel (%) Sand (%) Silt + Clay (%) Liquid Limit (%) Plastic Limit (%) Plasticity Index (%) IS Classification Free Swell Index (%) Degree of Expansion Maximum Dry Density (kN/m3) Optimum Moisture Content (%)
Damineedu
Byragipatted a
Perumalla Palli
Sripuram
Tiruchanur Road
18.50 63.20 18.30 30 20 10 SC 25 Low 18.40 9.00
0.20 8.20 91.60 54 18 36 CH 30 Low 17.20 16.00
2.00 10.50 87.50 40 18 22 CI 30 Low 17.40 14.00
3.20 45.40 51.40 55 17 38 CH 30 Low 17.30 16.00
15.30 43.10 41.60 56 15 41 SC 35 Low 17.60 12.00
www.iosrjournals.org
110 | Page
Functional Correlations between Compaction Characteristics, Un-drained Shear Strength and Atterberg Limits
Figure 1 Gradation Curve for Different Soils
IV.
Consistency limits
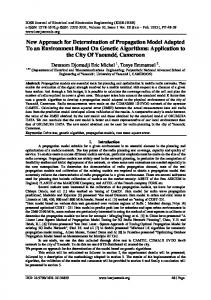
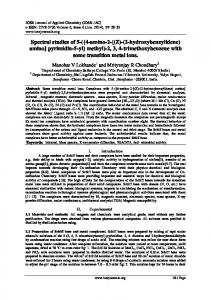
The Atterberg limits of soils are used for the purpose of classification of cohesive soil materials for engineering purposes. The Atterberg limits are widely related to the shear strength, bearing capacity, compressibility, swelling potential and specific surface of soils. The plastic limits assume a lot of importance to obtain information on soil mechanical behaviour. The critical state soil mechanics theory suggests that when soil is in the plastic consistency range, the clay particles, each of which is surrounded by a water film, slide over each other when soil is deformed. The theory suggests that there exists a line, termed the critical state line, which describes the conditions when soil is undergoing pure shear (e.g. molding without a change in volume) during loading. Soil that is prepared for either the liquid limit or plastic limit test is in such a condition, and hence may be described by a point on the critical state line. The plastic limits and indices derived from them are used especially in soil engineering as a measure of soil mechanical properties and soil strength. Despite experimental evidence of the relationship between soil consistency and soil compressibility , the plastic limits are not used in soil compaction research to the same extent as they are used in foundation engineering. An attempt is therefore made to examine the usefulness of Atterberg Limits in the assessment of undrained strength characteristics. The test results are presented in Table 1 & Figure 2. It may be seen from the figures that the soil samples under consideration locate above the A-line. This turns out that the soil samples considered are clayey soils The plasticity Index is found to be proportional to the respective liquid limit. The Atterberg limits are usually conducted for soil fraction passing 425 microns. The values thus obtained may not be true representation of the entire soil. The presence of coarse particles only dilutes the physcio-chemical potential of the soil proportionately (Srinivasa Muthy et al., 1987). Accordingly the modified liquid limit (wlm) and modified plasticity index (Ipm) are defined to analyse the test results. The modified liquid limit is defined as wlm =wl XF/100 and the modified plasticity index I pm=IpxF/100 where F is fraction passing through 425 microns. It is of interest to note that the samples are located above A-line and parallel to A-line when data are plotted on Modified Liquid Limit and Modified Plasticity Index axes ( figure 3) . This turns out that the Modified Liquid Limit is proportional to Modified Plasticity Index.
V.
Compaction characteristics
Soil compaction is widely used in geo-engineering and is important for the construction of roads, dams, landfills, airfields, foundations, hydraulic barriers, and ground improvements. Compaction is applied to the soil, with the purpose of finding optimum water content to maximise its dry density, and therefore, to decrease soil’s compressibility, increase its shearing strength, and in some cases, to reduce its permeability. Proper compaction of materials ensures the durability and stability of earthen constructions. A typical compaction curve presents different densification stages when the soil is compacted with the same apparent energy input but different water contents. The water content at the peak of the curve is called optimum water content (OWC) and represents the water content in which dry density is maximized for a given compaction energy. The compaction characteristics, if related to basic properties, the result relationships are useful in providing independent means of checking the test results and for use by practicing engineers in making preliminary estimates. The compaction test results are presented in Figures 4-6. The observations pertaining to each soil are mentioned as below: The variation in OMC is dependent on modified plasticity index. The rate of increase of density with molding pore fluid is flatter before dry side of optimum and the decrease in density is relatively rapid on the wet side of optimum. Because of variation of Specific Gravity, grain size distribution, the density seems to vary www.iosrjournals.org
111 | Page
Functional Correlations between Compaction Characteristics, Un-drained Shear Strength and Atterberg Limits considerably. The compaction curves are distantly placed indicating that the Maximum Dry Density changes as Modified Plasticity Index. Because of variation of Specific Gravity , grain size distribution, the density seems to vary considerably. The compaction curves are distantly placed indicating that the Maximum Dry Density changes as Modified Plasticity Index. Other Interrelationships It is of interest to find out the other possible interrelations in order to be useful in the application of practical situations. The compaction test results are re-plotted on modified plasticity Index and optimum moisture content and maximum dry density and modified plasticity index as shown in fugues 5-6. It may be observed that the optimum moisture content increases with the plasticity index and maximum dry density decreases with the modified plastic index. The following relationships are obtained.
OMC 0.233MPI 8.00 with a regression coefficient of 0.979 d max 0.035MPI 18.49 with a regression coefficient of 0.976 VI.
Strength Cahrecterisits
Undrained shear strength is one of the useful parameters in order to take engineering decisions. Most often the bearing capacity is estimated based on undrained shear strength to make conservative estimates. Some laboratory tests needed to obtain these values are expensive and time consuming, while soil properties like moisture content and Atterberg limits can be performed faster and cheaper. Many empirical formulae are available to estimate the undrained shear strength for fine grained soils like clay or silt. Determining of undrained shear strength and compressibility parameters in laboratory are really tedious and time consuming. Therefore, a correlation between undrained shear strength and Atterberg limits is useful for restraint of testing number and costs. However, a limited effort is made to understand weather such a relationship is possible in case of local soils. The test results are presented in figures 7-12. It may be noted that the un-drained strength has a relationship with the plasticity index in that the strength decreases as plasticity index increases. This turns out the consistency limits have influence on strength characteristics.
Figure 2 Location of samples in plasticity chart
Figure 3 Location of samples in modified plasticity chart
www.iosrjournals.org
112 | Page
Functional Correlations between Compaction Characteristics, Un-drained Shear Strength and Atterberg Limits
Figure 4 Copaction charecterisitcs of soils
Figure 5 Relatioship between optimum moisture content and modified plasticity index
Figure 6 Relatioship between maximum dry density and modified plasticity index VII Concluding Remarks The Atterberg consistency limits of soils are used for the purpose of classification of cohesive soil materials for engineering purposes. The Atterberg limits are widely related to the shear strength, bearing capacity, compressibility, swelling potential and specific surface of soils. The plastic limits assume a lot of importance to obtain information on soil mechanical behavior. Despite experimental evidence of the relationship between soil consistency and soil compressibility , the plastic limits are not used in soil compaction research to the same extent as they are used in foundation engineering. Accordingly, an attempt has been made to correlate the consistency limits to the compaction behavior. The following concluding remarks may be made based on the limited experimental study:
www.iosrjournals.org
113 | Page
Functional Correlations between Compaction Characteristics, Un-drained Shear Strength and Atterberg Limits
It is of interest to note that the samples are located above A-line and parallel to A-line when data are plotted on Modified Liquid Limit and Modified Plasticity Index axes. This turns out that the Modified Liquid Limit is proportional to Modified Plasticity Index The variation in OMC is dependent on modified plasticity index. The rate of increase of density with molding pore fluid is flatter before dry side of optimum and the decrease in density is relatively rapid on the wet side of optimum. Because of variation of Specific Gravity, grain size distribution, the density seems to vary considerably. The compaction curves are distantly placed indicating that the Maximum Dry Density changes as Modified Plasticity Index. The following relationships are obtained.
OMC 0.233MPI 8.00 with a regression coefficient of 0.979 d max 0.035MPI 18.49 with a regression coefficient of 0.976
The un-drained strength has a relationship with the plasticity index in that the Strength decreases as plasticity index increases. This turns out the consistency limits have influence on strength characteristics
References [1]. [2]. [3]. [4].
[5].
Fernando A. M. Marinho , Orlando M. Oliveira ( 2011) ´ Unconfined shear strength of compacted unsaturated plastic soils ´ Proceedings of the ICE - Geotechnical Engineering, Volume 165, Issue 2, September 2011 pages 97 –106. Kayabali, Kamil; Tufenkci, Osman Oguz (2010)´ Shear strength of remolded soils at consistency limits ´, Canadian Geotechnical Journal;Mar2010, Vol. 47 Issue 3, p259 Nagaraj,H.B.,Sridharan,A, Mallikarjuna,H.M. (2012) ´Reexamination of Undrained Strength at Atterberg Limitswater contents´,Geotch Geol Engg(2012),30 727-736 Neelu Das, Binu Sarma, Shashikant Singh and Bidyut Bikash Sutradhar (2013) ´ Comparison In Undrained Shear Strength Between Low And High Liquid Limit Soils´, International Journal of Engineering Research & Technology (IJERT) Vol. 2 Issue 1,1-6. Sharma, B. and Bora, P. (2003). ”Plastic Limit, Liquid Limit and Undrained Shear Strength of Soil—Reappraisal.” J. Geotech. Geoenviron. Eng., 129(8), 774–777.
Figure 7 Stress-strain relation in undrained shear
www.iosrjournals.org
114 | Page
Functional Correlations between Compaction Characteristics, Un-drained Shear Strength and Atterberg Limits Figure 8 Stress-strain relation in undrained shear
Figure 9 Stress-strain relation in undrained shear
Figure 10 Stress-strain relation in undrained shear
Figure 11 Stress-strain relation in undrained shear
Figure 12 Normalized underained strength relationship with plasticity index
www.iosrjournals.org
115 | Page