Plant Physiol. (1998) 118: 725–732
Update on Genomics
Functional Genomics in Plants1 David Bouchez and Herman Ho¨fte* Laboratoire de Biologie Cellulaire, Institut National de la Recherche Agronomique, Route de Saint-Cyr, 78026 Versailles cedex, France ever, computerized analyses are generally not sufficient to define gene function with a high level of confidence, and experimental confirmation is needed in most cases. Indirect information on cellular or developmental function can be obtained from spatial and temporal expression patterns; for example, the presence of mRNA and/or protein in different cell types, during development, during pathogen infection, or in different environments. The subcellular localization and posttranslational modifications of proteins can be informative as well. Knocking out or overexpressing the gene permits the gene sequence to be linked to a phenotype from which a cellular role or a role in development may be deduced. Finally, the fitness of plants carrying mutations or natural variants for the gene can be compared in different environments with wild-type plants to study the adaptive function. In this Update we provide a review of the ever-growing toolbox for the global study of gene function in plants, indicating the potential and the limitations of the different techniques. Where appropriate, we will also draw a parallel with the more advanced technologies in bacterial, yeast, and animal systems.
The sequencing of the first genome of a higher plant, Arabidopsis, is progressing at a rapid pace. As we are writing these words, almost one-third of the estimated 100 Mb is available in public databases, and with appropriate funding the complete genome sequence is predicted to be finished by the year 2001. Sequencing programs for other plant genomes such as rice are planned, and with new generations of more efficient sequencing machines (Marshall and Pennisi, 1998), the sequence of several other plant genomes may become available in the coming decade. In the wake of these sequencing efforts, plant research enters an exciting period in which genome-wide approaches are becoming an integral part of plant biology, with potentially highly rewarding but as yet unpredictable biotechnological applications. This is reflected by the current frenzy with which new agricultural biotechnical companies are being founded and the rate at which existing companies are investing in the development of tools to exploit and further expand this wealth of information. The term functional genomics can be referred to as the “development and application of global (genome-wide or system-wide) experimental approaches to assess gene function by making use of the information and reagents provided by structural genomics” (Hieter and Boguski, 1997). With these approaches the focus of the analysis is shifted from individual components to biological systems. It involves the use of high-throughput methods for the study of large numbers of genes (ideally the entire set) in parallel. Gene “function” can be considered from several points of view: it can mean biochemical function (e.g. protein kinase), cellular function (e.g. a role in a signal transduction pathway), developmental function (e.g. a role in pattern formation), or adaptive function (the contribution of the gene product to the fitness of the organism). Having identified a new sequence, the comparison with sequence databases is the simplest way to obtain (essentially biochemical) functional information. Currently, about 50% of newly identified genes show sequence similarity to previously described genes. How-
LARGE-SCALE SEQUENCING OF PLANT GENOMES ESTs A rapid way to establish an inventory of expressed genes is by determining partial sequences of cDNA called ESTs. In this approach, single-pass sequences of 300 to 500 bp are determined from one or both ends of randomly chosen cDNA clones. The sequences are sloppy and have a relatively high error rate, but they are sufficiently accurate to unambiguously identify the corresponding gene in most cases. Thousands of sequences can thus be determined with a limited investment. EST information is present in public databases for a variety of species, including a number of plants (Ho¨fte et al., 1993; Newman et al., 1994; Cooke et al., 1996; Yamamoto and Sasaki, 1997). A recent release (March 23, 1998) of the EST database of the National Center for Biotechnology Information (Table I) lists more than 39,000 Arabidopsis ESTs. Powerful programs for rapid sequence comparisons with databases are accessible via the Internet (Table I). The Institute for Genome Research (Table I) very conveniently has ordered overlapping ESTs into tentative contigs. It is difficult to know exactly how many different
1
This study was supported by grants from the BIOTECH program of the European Economic Community (nos. BIO4-CT950183 and BIO4-CT96-0689 to D.B.); from Groupemont de Recherche du Genome (contract nos. 9147A and 5-95 to D.B. and no. 10-95 to H.H.); and from Action Incitative Programme Institut National de la Recherche Agronomique (no. P176 to D.B. and H.H.). * Corresponding author; e-mail
[email protected]; fax 33– 1–30 – 83–30 –99.
Abbreviations: EST, expressed sequence tag; SAGE, serial analysis of gene expression. 725
726
Bouchez and Ho¨fte
Plant Physiol. Vol. 118, 1998
Table I. Useful websites for plant genomics National Center for Biotechnology Information EST database The Institute for Genome Research Arabidopsis database Arabidopsis ESTs Arabidopsis genome sequencing Intron prediction programs Arabidopsis stock centers Proteome databases Gene-expression databases
http://www.ncbi.nlm.nih.gov/dbEST/index.html http://www.tigr.org http://genome-www.stanford.edu/Arabidopsis/ http://http://www.cbc.med.umn.edu/ResearchProjects/Arabidopsis/ http://genome-www.stanford.edu/Arabidopsis/AGI/AGI_links.html GRAIL http://compbio.ornl.gov/tools/index.shtml NetPlantGene http://www.cbs.dtu.dk/services/NetGene2/ Nottingham http://nasc.nott.ac.uk/ Ohio http://aims.cps.msu.edu/aims/ General http://expasy.hcuge.ch/ch2d/2d-index.html Arabidopsis plasma membrane http://sphinx.rug.ac.be:8080/ Yeast http://cmgm.stanford.edu/pbrown/explore/index.html Arabidopsis http://www.inra.fr/Versailles/BIOCEL/Filtres
genes are represented by these ESTs, because cDNA clones frequently are truncated at the 59 end, and sequencing of 59 ends of cDNA clones often yields nonoverlapping sequences corresponding to the same mRNA. However, the fact that 56% of the predicted genes exactly matched an EST within 1.9 Mb of contiguous genomic sequence (Bevan et al., 1998) suggests that more than one-half of the total set of Arabidopsis genes is already represented by an EST. It should be noted that several companies possess large private EST databases for various crop plants (e.g. maize and soybean), the access to which can be negotiated on a caseby-case basis. While we await the complete genome sequence, EST databases have proven to be a tremendous resource for finding genes and for interspecies sequence comparison, and have provided markers for genetic and physical mapping and clones for expression analyses. The relative abundance of ESTs in libraries prepared from different organs and plants in different physiological conditions also provides preliminary information on expression patterns for the more abundant transcripts. Genomic Sequencing EST sequencing programs in Arabidopsis and rice have been extremely successful in the discovery of new genes. However, rare transcripts and transcripts of genes that are induced under specific conditions (e.g. biotic and abiotic stresses) are not represented in EST databases. The only sure way to gain access to the entire set of genes is to determine the complete genomic sequence. This sequence also provides information on the global structure of the genome, including the relative order of genes on the chromosomes, which is extremely valuable for positional cloning strategies. At present the genomes of rice and Arabidopsis, both model plant species with small, information-rich genomes, are being sequenced on the basis of coordinated multinational efforts. For the Arabidopsis Genome Initiative, specialized sequencing laboratories from the United States, Europe, and Japan are continuously releasing sequence data in public databases (Table I) annotated with the results from database searches and geneprediction algorithms (Rounsley et al., 1998).
The first results from the large-scale sequencing of a 1.9-Mb region (Bevan et al., 1998) confirmed that the Arabidopsis genome is extremely gene rich (one gene every 5 kb, on average) and poor in repeated elements such as retrotransposons. The total gene complement of Arabidopsis is estimated to be around 21,000 protein-coding genes. About one-half of the predicted genes on the 1.9-Mb segment can be assigned to a functional category based on similarity with known proteins. A major problem with genomic sequences is how to distinguish coding regions from noncoding intergenic sequences and introns. Comparisons with EST and cDNA sequences and sequence similarity to known coding sequences can be used to assign intron positions for many genes. However, for the genes that do not match sequences in the databases, the coding sequences need to be predicted from the genomic sequence. For the human genome, programs such as GRAIL (Table I) have been developed to predict the beginnings and ends of genes and intron positions with high reliability (Uberbacher and Mural, 1991). In plants splicing signals are still poorly defined, and in Arabidopsis introns are often very small; the average size is around 200 bp and on average six or seven introns are found per gene. A gene-prediction algorithm based on neuronal networks was developed for plant sequences. The program, NetPlantGene, which is freely available (Table I), allows for a reliable prediction of introns (Hebsgaard et al., 1996; Tolstrup et al., 1997). A better comprehension of splicing mechanisms in plants is needed to improve geneprediction algorithms in the future. FUNCTIONAL ANALYSIS OF PLANT GENES Gene Expression Knowing when and where a gene product (RNA and/or protein) is expressed can provide important clues to its biological function. The facility with which a highthroughput approach can be used for the study of gene expression depends largely on the level of regulation that is being addressed. Technologies have been developed for the parallel study of mRNA and protein levels in yeast, animals, and plants. Additionally, procedures for the systematic study of protein-protein interactions using two-hybrid
Functional Genomics in Plants screens (Fromont-Racine et al., 1997) are being developed for yeast and may be adopted for plant systems in the future. SAGE SAGE is a logical extension of EST sequencing. An inventory of transcripts is established based on very short cDNA sequence tags (9–11 bp) from the 39 part of mRNA molecules, concatenated, and cloned before sequencing (Velculescu et al., 1995). These short tags have proven sufficiently long to unambiguously identify corresponding genes in databases (Velculescu et al., 1997). Expression patterns for the different genes are reflected by the relative abundance of individual tags. SAGE patterns have been studied in human and in yeast (Polyak et al., 1997; Velculescu et al., 1997), but to our knowledge, the technique has not yet been applied to plants. A prerequisite for the identification of the tags is the availability of large sequence databases for the species under study. The technique is powerful but not very convenient for the comparison of many different samples and for the study of the rarer transcripts.
727
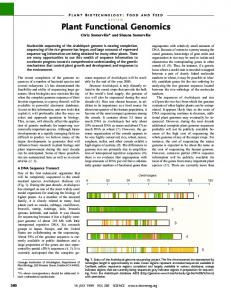
Chip in for DNA Chips An alternative approach for monitoring mRNA levels is based on hybridization techniques. A “reverse northern” technique is used, whereby DNA fragments or oligonucleotides corresponding to different genes or cDNAs are immobilized on a solid support and hybridized to probes prepared from total mRNA pools extracted from cells, tissues, or whole organisms and converted to cDNA (Fig. 1A). The hybridization signal for each individual spot can be quantified automatically, and in principle reflects the relative abundance of the corresponding mRNA in the total mRNA pool. The value of this approach is its propensity for miniaturization, allowing huge numbers of gene fragments to be analyzed in parallel. For example, DNA fragments corresponding to the entire set of more than 6400 yeast open reading frames could be contained on a single 18- 3 18-mm microscope slide (DeRisi et al., 1997). Different systems have been developed depending on the source of target DNA and the nature of the solid support and the detection system. The simplest system, Figure 1. High-density DNA arrays and the monitoring of mRNA levels for large numbers of genes in parallel. A, cDNAs or open reading frames (ORFs) identified in genomic sequences were PCR amplified and printed onto a solid support (microscope slides or nylon filters) using a gridding robot. Single-stranded cDNA probes were synthesized from total mRNA populations using reverse transcriptase in the presence of labeled nucleotides and hybridized to the DNA arrays. Hybridization signals were detected using a two-dimensional radioactivity detector such as a Phosphorimager or, for fluorescent probes, a modified confocal laser scanning microscope. The signals were quantified and processed using specialized software. The intensity of the hybridization signal is proportional to the abundance of the corresponding mRNA in the pool used to synthesize the probe. B, Sector of a yeast genome microarray. The total array was 18 3 18 mm and contained 6400 distinct, PCRamplified ORFs. Two probes labeled with different fluorochromes were mixed and hybridized, and the two colors were quantified simultaneously. (Adapted from DeRisi et al., 1997.)
728
Bouchez and Ho¨fte
which uses nylon filters in combination with radioactive probes, can be put to work with a minor investment. It requires a commercial, all-purpose gridding robot and a radioactivity detection system such as a Phosphorimager. Software for the detection and quantification of signals is commercially available. The system was tested out on some 800 partially sequenced cDNA clones in Arabidopsis, with reproducible results (Desprez et al., 1998). Filters with a density of up to 6144 cDNA on a 12- 3 8-cm surface have been made (H. Ho¨fte, unpublished data). The technique can be used to detect low-abundance mRNAs (down to 1:10,000 of the total mRNA population). A more sophisticated system uses DNA microarrays printed at a high density on pretreated glass slides (Schena et al., 1995; DeRisi et al., 1997). This system allows the use of fluorescent probes, and hybridization signals are detected using an adapted confocal laser microscope (Fig. 1B). The use of two different fluorophores allows the simultaneous detection of hybridization signals of two probes in a single hybridization experiment, resulting in highly reproducible data. The system has a high sensitivity: mRNAs of an abundance down to 1:100,000 can be reliably detected, which in yeast corresponds to approximately 0.15 mRNA molecules per cell. The major drawback of this technique is its cost and the requirement for a specialized arraying robot and scanner. Also, the arrays cannot be reused, which further increases cost. An alternative technology is referred to as DNA chips. It is based on a method to synthesize large amounts of different oligonucleotides in situ on a glass support using light-directed, solid-phase, combinatorial chemistry developed by Affymetrix (Santa Clara, CA). Oligonucleotides corresponding to the genes of interest are hybridized with fluorescent probes, and signals are detected using techniques similar to the ones used for the microarrays. A hallucinating experiment was described recently (Wodicka et al., 1997) in which 260,000 25-mers, corresponding to a nearly complete set of yeast genes, were synthesized in situ on four 1.28-cm2 grids. Each open reading frame predicted from the genomic sequence was represented by about 20 oligonucleotides to cancel out differences in hybridization behavior of different oligonucleotides and crosshybridization with related sequences. In addition, the hybridization value for each oligonucleotide was corrected for the hybridization value for a second, negative control oligonucleotide with an identical sequence except for a single base difference. The method showed a very high sensitivity and reliably detected a transcript present at one copy in 10 to 20 cells. The company is planning to market a human chip with elements representing 40,000 genes for expression analysis. DNA chips for the complete set of Arabidopsis genes may become possible in the not-toodistant future, provided appropriate funding is available for manufacturing the photolithographic masks. For the moment, the technology remains inaccessible to plant scientists in public laboratories. In the near future, genome-wide analysis of gene expression will become possible for plants. Several public laboratories are currently setting up systems for Arabidopsis (Desprez et al., 1998; S. Somerville, personal communica-
Plant Physiol. Vol. 118, 1998
tion), and a few companies are already offering highdensity filters or services including probe hybridization and data analysis with cDNA microarrays. What can be done with these techniques? First, they can be used to describe in a systematic way mRNA levels in different tissues in the course of development or in different environmental conditions. Such information can be stored in gene-expression databases that may be consulted just like sequence databases. Early versions of such databases exist for yeast and Arabidopsis (Table I). Second, global expression studies can be used to classify genes based on their spatial and kinetic expression patterns. For example, during the course of the diauxic shift of yeast cultures (from anaerobic to aerobic metabolism), classes of genes could be distinguished based on their induction or repression kinetics (DeRisi et al., 1997). New regulatory elements may be identified by comparing the regulatory sequences of genes of the same class. Third, the kinetics of changes in gene expression, combined with expression profiles of mutants for known regulatory genes, should allow the study of expression networks. For example, in yeast, changes in the expression of genes with known metabolic function were indicative of the metabolic reprogramming taking place during the diauxic shift. Along these same lines, expression profiles will be helpful in characterizing the defects in developmental mutants. Software tools to facilitate such comparisons need to be developed. Other techniques such as systematic, whole-mount in situ hybridization studies on various organs are required to obtain more precise information on cell-type-specific expression. Alternatively, as discussed below, “enhancer” or “gene-trap” lines can also provide information on celltype-specific gene expression. What about Proteins? Information on mRNA levels is not sufficient to obtain a complete picture of the way gene expression is regulated within the cell. Protein expression data are more informative, but are much more difficult to obtain in a parallel fashion. The term “proteome” was coined to refer to the total protein complement expressed by the genome. Twodimensional PAGE is for the moment the method of choice to study the abundance and posttranslational modifications of several hundred proteins in parallel (HumpherySmith and Blackstock, 1997). Recently, the resolution and reproducibility of the separation system was greatly improved, and algorithms for automatic spot quantification have been developed. Furthermore, protein spots on gels are now more easily identified with improved methods for N-terminal and internal microsequencing and, more importantly, with the use of MS techniques (Jungblut and Thiede, 1997). The latter are based on the ability to determine very accurately the molecular mass of fragments released upon protease treatment of minute amounts of protein excised from gels. Comparison with theoretical molecular mass predicted from sequences in protein databases allows for the attribution of a sequence to the protein fragments, provided that a complete, organism-specific protein database is available.
Functional Genomics in Plants Large two-dimensional-gel databases exist for Escherichia coli, yeast, and human. In plants more limited databases exist for maize, rice, and Arabidopsis. A database for plasma membrane proteins in Arabidopsis is under development (Table I), which not only provides information on abundance and posttranslational modification, but also on the intracellular localization of a subset of proteins. This approach can be extended to other organelles, and even multisubunit protein complexes, provided that efficient separation procedures are available. Among the various applications, the proteome approach has been used in yeast to study gene function through the generation of knockout or overexpression mutants and for the analysis of changes in protein profiles on twodimensional gels. In maize comparison of proteomes of lines nearly isogenic for the gene opaque2 allowed the identification of new targets for the encoded transcription factor (Damerval and Le Guilloux, 1998). In Arabidopsis twodimensional-gel profiles were used to characterize developmental mutants and allowed the hypothesis of the overproduction of cytokinins in one of the mutants, which was confirmed subsequently (Santoni et al., 1994). Despite its improvements, the technique remains limited, allowing for the monitoring of only a few thousand abundant proteins. Other techniques, possibly based on MS of complex mixtures of protein fragments, may be developed in the future for the study of total protein complements. Forward and Reverse Genetics in Plants Genetics relies on the study of variants, either found in natural populations or induced by mutagenesis. The analysis of the inheritance of this variation in mapping populations allows us to determine the number of genetic factors responsible for the observed variation and their relative position on the chromosomes. This variation can be discrete, as is generally the case for mutations, or continuous, as with most complex traits (especially those of agro-
729
nomic importance, such as yield and plant height), which are mostly controlled by large numbers of genes. Mutational approaches have been extremely successful in recent years for the study of the genetic and molecular bases for any trait in plant biology. Classic chemical/physical mutagenesis procedures allow us to reach saturation relatively easily (meaning a high probability of recovering a mutation in every gene in the genome). Access to the mutated genes is obtained using positional cloning strategies (i.e. cloning the gene based on its position on the genetic map). This strategy is facilitated in model species such as Arabidopsis, for which dense genetic maps with many visible and molecular genetic markers exist, and for which an almost complete physical map consisting of a collection of overlapping DNA fragments cloned in yeast artificial chromosomes or bacterial artificial chromosomes, has been constructed (Schmidt et al., 1995, 1997; Zachgo et al., 1996; Camilleri et al., 1998). The total genomic sequence will provide the ultimate physical map. With all of these tools, especially with the genomic sequence in hand, positional cloning strategies will be greatly accelerated, the limiting factors being the time and effort required for constituting the mapping population and the fine mapping of the mutant locus. New mapping strategies based on “mapping chips” will accelerate this aspect as well. Insertional Mutagenesis (Transposons/T-DNA) The use of insertional mutagenesis in principle provides a more rapid way to clone a mutated gene. DNA elements that are able to insert at random within chromosomes, such as transposons (Martienssen, 1998) or the T-DNA of Agrobacterium tumefaciens (Azpiroz-Leehan and Feldmann, 1997), can be used as mutagens to create loss-of-function mutations in plants. Because the sequence of the inserted element is known, the gene in which it is inserted can be easily recovered using various cloning or PCR-based strategies (Fig. 2).
Figure 2. Insertional mutagenesis. Insertion of a mobile DNA element within a gene disrupts gene activity at the transcriptional level, the translational level, or both. Inserts can be directly selected to use a selectable marker (e.g. conferring kanamycin or Basta resistance) harbored by the insertion sequence (transposon or T-DNA). The presence of a gene/enhancer trap with a reporter cassette allows the expression of the gene at the site of insertion to be monitored. Introns are indicated by gray boxes, exons by hatched boxes. Mutagenized populations can be screened by PCR using primers specific for the gene (black arrowheads) and for the insertion element (white arrowheads). The insertion site can be recovered by standard cloning procedures and by PCR using inverse PCR, tail PCR, etc.
730
Bouchez and Ho¨fte
The key parameters here, as in any mutagenesis strategy, are the level of saturation (i.e. the probability of having at least one insertion in any gene, which depends on the number of independent insertions in the population), the randomness of insertion of the element, and the number of insertions per line. For the Arabidopsis genome, we estimate that a collection of around 120,000 independent inserts is needed to provide a high level of saturation (95% chance of hitting any gene at least once). Various populations of mutagenized plants, either with heterologous transposons (mainly maize transposons such as Ac/Ds, En/Spm, or Mu) or the T-DNA of A. tumefaciens, have been produced in several plant species (Arabidopsis, petunia, snapdragon, tomato, maize, and rice). The level of saturation reached depends strongly on the size and organization of the genome. In addition, the insertional mutagen can be engineered with reporter cassettes (enhancer or gene traps) that will report on the expression of the chromosomal gene at the site of insertion (Martienssen, 1998). For example, reporter cassettes containing a minimal promoter (enhancer trap) close to the end of the insertion element can be cis-activated when inserted close to a transcriptional enhancer that will drive the expression of the reporter gene. Mutagenized populations can be screened for lines expressing the reporter gene in specific cell types or in specific environmental conditions. Genes with interesting expression patterns and their promoters can be isolated from such lines. Such lines can also be used to mark certain cell types for developmental studies (Sundaresan et al., 1995). Activation tagging, which is based on the use of an insertion element carrying a strong enhancer or promoter directing transcription into the region flanking the insertion, enables the isolation of gain-of-function mutations in which ectopic activation of a flanking gene promotes a mutant phenotype (Wilson et al., 1996). Such mutations are generally dominant or semidominant. The main advantage of transposon-based approaches is their relative facility in generating large populations of insertions and their ability to use the propensity of many transposable elements to transpose to linked sites, which makes it possible to remobilize the element for insertion in the vicinity of the starting insertion site. On the other hand, it is more difficult to achieve saturation with T-DNA insertional mutagenesis, but it results in fewer insertions (1–2 loci per line); insertions are stable, easy to maintain, and, as far as we know, do not show strong insertional biases (Azpiroz-Leehan and Feldmann, 1997). In Arabidopsis highly efficient in planta transformation techniques have been instrumental in generating large populations of T-DNA insertion lines while minimizing the effect of somaclonal variation linked to in vitro culture and regeneration (Bechtold et al., 1993; Azpiroz-Leehan and Feldmann, 1997). Reverse Genetics: From Genes to Functions A direct way to obtain information on the function of a gene identified by sequencing is to create a loss-of-function mutation and study the phenotype of the resulting mutant. In many model organisms (e.g. microbes and mice), homol-
Plant Physiol. Vol. 118, 1998
ogous recombination can be used efficiently to target mutations into specific genes by replacing the wild-type gene with a mutated allele. In plants controlling homologous recombination has proven extremely difficult because of the prevalence of illegitimate recombination events (Puchta and Hohn, 1996). Although some success has been reported (Miao and Lam, 1995; Kempin et al., 1997), gene replacement by recombination is not considered feasible on a large scale, and other strategies have to be implemented to allow the functional analysis of large numbers of genes. An alternative, highly efficient procedure for obtaining mutants in genes identified in sequencing programs takes advantage of the availability of large collections of plants mutagenized by an insertion element (T-DNA or transposon). This procedure, based on methods originally developed in Drosophila melanogaster (Ballinger and Benzer, 1989) and Caenorhabditis elegans (Zwaal et al., 1993), makes use of the specificity and sensitivity of the PCR reaction to screen for insertions within regions of interest in a large population of mutagenized plant lines (McKinney et al., 1995; Krysan et al., 1996; Azpiroz-Leehan and Feldmann, 1997; Martienssen, 1998). Using oligonucleotide primers from the insertional element and from the gene of interest, it is possible to detect an insertion event within the gene, even in complex DNA samples (Figs. 2 and 3). The sensitivity of the PCR is so high that it is possible to detect such an event in large pools (up to a few thousand) of mutagenized plants (Fig. 3). The first published examples of targeted mutations in Arabidopsis (Gilliland et al., 1998; Hirsch et al., 1998) show that careful analysis of mutants is often required to detect the deleterious effects of a given mutation. In our laboratory more than 50 mutated lines were obtained from PCR screening of a T-DNA insertion population (Bechtold et al., 1993), and most of the lines did not show strong visible phenotypes when grown in standard conditions (D. Bouchez, unpublished data). To reveal phenotypic differences, it may be necessary to identify the correct environmental conditions for the expression of the phenotype. An example is the potassium-channel mutant AKT1, for which a reduction in growth is visible only at low potassium concentrations (Hirsch et al., 1998). Some mutations may have very subtle effects that are not detectable in standard experimental conditions, and multigenerational population studies have to be devised to reveal phenotypic differences between mutant and wild type (Asmussen et al., 1998). Finally, it becomes clear from large-scale sequencing programs that eukaryotic genomes are quite redundant, with many genes duplicated in families (Bevan et al., 1998). The functional analysis of such gene families may often require the construction of lines carrying multiple mutations in different family members. A further extension of this strategy involves the use of an EST-like approach to systematically sequence the flanking regions of insertions. Using PCR-based techniques, it is possible to isolate and sequence a large number of insertion sites from pooled or individual lines. The insertion sites can be mapped by comparing the sequences with the genomic sequence. Databases of such flanking sequences will be established and can be searched for hits in any
Functional Genomics in Plants
731
Figure 3. Reverse genetics in Arabidopsis using large populations of plants mutagenized with an insertion element such as the T-DNA of A. tumefaciens or a transposable element. Large populations of mutagenized plants were generated to constitute an insertion library. In Arabidopsis an average transcription unit (exons plus introns) is about 2.5 kb, which means that the 100-Mb genome can be divided into around 40,000 targets. To have a 95% chance of at least one insertion in any target, one needs about 120,000 independent, random insertions: n 5 240,000 3 ln(0.05). DNA is extracted from pools of mutagenized plants and grouped into larger pools. Single insertions can be detected by PCR in pools as large as several thousand individual lines. Depending on the nature of the population used, pools and superpools can be organized into twoor three-dimensional matrices to facilitate the final determination of single lines carrying the desired insertion. PCR reactions are performed on DNA superpools using oligonucleotide primer combinations from the gene of interest and from the insertion element. Because PCR efficiency is extremely sensitive to interactions between primers, to the length of the product, etc., it is often necessary to test several primer combinations. PCR products are then loaded on an agarose gel, transferred to a membrane, and hybridized to probes from the gene of interest and from the insertion element. This step is crucial to eliminate PCR background, and only products hybridizing to both probes are studied further. Once the hit has been confirmed by PCR and sequence analysis, the superpools can be deconvoluted into pools and finally into individual lines. The final determination of the mutant line can be more or less time consuming, depending on the pooling scheme that has been adopted for the generation of the population.
particular gene. Seeds of the lines carrying the sequenced inserts will become available from the stock centers. Several public and private laboratories are involved in such programs, and these tools should become available in the near future. It is possible, however, that the growing interest from private companies will interfere with the public release of these resources. CONCLUSIONS AND PERSPECTIVES Together with the completion of the first sequence of a plant genome, a magnificent tool kit is becoming available that will dramatically improve the quality of research in all disciplines of plant biology. This tool kit comprises large collections of knockout mutants in model organisms for systematic gene function searches and methods for the study of the regulation of entire sets of genes at the mRNA or protein level. A challenge in the next decade will be to
build integrated databases combining information on such things as sequence, map position, mRNA and protein expression, mutant phenotypes, metabolism, and allelic variation. Also, intelligent software tools will be required for the efficient mining of this wealth of information and to construct intelligible models describing the complex molecular interactions that constitute the regulatory networks. EST sequencing and mapping or genomic sequencing of a few strategic crop species may suffice to facilitate the transfer of information from model species to the majority of crop plants, to be used for crop improvement in the future. NOTE ADDED IN PROOF A new server for gene expression data for Arabidopsis can be consulted at the following address: http://www.monsanto.com/ Arabidopsis. An interesting application of DNA chips, in which
732
Bouchez and Ho¨fte
gene expression was monitored during the cell cycle of yeast, was reported in Cho RJ, et al. (1998). ACKNOWLEDGMENTS Shauna Somerville is thanked for providing information on cDNA arrays, Dominique Devienne for communicating unpublished results, and Patrick Brown for providing elements for Figure 1. Received July 22, 1998; accepted July 29, 1998. Copyright Clearance Center: 0032–0889/98/118/0725/08. LITERATURE CITED Asmussen MA, Gilliland LU, Meagher RA (1998) Detection of deleterious genotypes in multigenerational studies. II. Theoretical and experimental dynamics with selfing and selection. Genetics 149: 727–737 Azpiroz-Leehan R, Feldmann KA (1997) T-DNA insertion mutagenesis in Arabidopsis: going back and forth. Trends Genet 13: 152–156 Ballinger DG, Benzer S (1989) Targeted gene mutations in Drosophila. Proc Natl Acad Sci USA 86: 9402–9406 Bechtold N, Ellis J, Pelletier G (1993) In planta Agrobacterium mediated gene transfer by infiltration of adult Arabidopsis thaliana plants. C R Acad Sci Ser III 316: 1194–1199 Bevan M, Bancroft I, Bent E, Love K, Goodman H, Dean C, Bergkamp R, Dirkse W, Vanstaveren M, Stiekema W, and others (1998) Analysis of 1.9 Mb of contiguous sequence from chromosome 4 of Arabidopsis thaliana. Nature 391: 485–488 Camilleri C, Lafleuriel J, Macadre´ C, Varoquaux F, Parmentier Y, Picard G, Caboche M, Bouchez D (1998) A YAC contig map of Arabidopsis thaliana chromosome 3. Plant J 14: 633–642 Cho RJ, Campbell MJ, Winzeler EA, Steinmetz L, Conway A, Wodicka L, Wolfsberg TG, Gabrielan AE, Landsman D, Lockhart DJ, and others (1998) A genome-wide transcriptional analysis of the mitotic cell cycle. Mol Cell 2: 65–73 Cooke R, Raynal M, Laudie´ M, Grellet F, Delseny M, Morris PC, Guerrier D, Giraudat J, Quigley F, Clabault G, and others (1996) Further progress towards a catalogue of all Arabidopsis genes: analysis of a set of 5000 non-redundant ESTs. Plant J 9: 101–124 Damerval C, Le Guilloux M (1998) Characterization of novel proteins affected by the o2 mutation and expressed during maize endosperm development. Mol Gen Genet 257: 354–361 DeRisi JL, Iyer VR, Brown PO (1997) Exploring the metabolic and genetic control of gene expression on a genomic scale. Science 278: 680–686 Desprez T, Amselem J, Caboche M, Ho¨fte H (1998) Differential gene expression in Arabidopsis seedlings monitored using cDNA arrays. Plant J 14: 643–652 Fromont-Racine M, Rain J, Legrain P (1997) Towards a functional analysis of the yeast genome through exhaustive two-hybrid screens. Nature Genet 16: 277–282 Gilliland LU, McKinney EC, Asmussen MA, Meagher RB (1998) Detection of deleterious genotypes in multigenerational studies. I. Disruptions in individual Arabidopsis actin genes. Genetics 149: 717–725 Hebsgaard SM, Korning PG, Tolstrup N, Engelbrecht J, Rouze P, Brunak S (1996) Splice site prediction in Arabidopsis thaliana DNA by combining local and global sequence information. Nucleic Acids Res 24: 3439–3452 Hieter P, Boguski M (1997) Functional genomics: it’s all how you read it. Science 278: 601–602 Hirsch RE, Lewis BD, Spalding EP, Sussman MR (1998) A role for AKT1 potassium channel in plant nutrition. Science 280: 918–921 Ho¨fte H, Desprez T, Amselem J, Chiapello H, Caboche M, Moisan A, Jourjon MF, Charpenteau JL, Berthomieu P, Guerrier D, and others (1993) An inventory of 1152 expressed sequence tags obtained by partial sequencing of cDNAs from Arabidopsis thaliana. Plant J 4: 1051–1061 Humphery-Smith I, Blackstock W (1997) Proteome analysis: genomics via the output rather than the input code. J Protein Chem 16: 537–544 Jungblut P, Thiede B (1997) Protein identification from 2-DE gels by MALDI mass spectrometry. Mass Spectrom Rev 16: 145–162
Plant Physiol. Vol. 118, 1998
Kempin SA, Liljegren SJ, Block LM, Rounsley SD, Lam E, Yanofsky MF (1997) Inactivation of the Arabidopsis AGL5 MADS-box gene by homologous recombination. Nature 389: 802 Krysan PJ, Young JC, Tax F, Sussman MR (1996) Identification of transferred DNA insertions within Arabidopsis genes involved in signal transduction and ion transport. Proc Natl Acad Sci USA 93: 8145–8150 Marshall E, Pennisi E (1998) Hubris and the human genome. Science 280: 994–995 Martienssen RA (1998) Functional genomics: probing plant gene function and expression with transposons. Proc Natl Acad Sci USA 95: 2021–2026 McKinney EC, Ali N, Traut A, Feldmann KA, Belostotsky DA, McDowell JM, Meagher RB (1995) Sequence-based identification of T-DNA insertion mutations in Arabidopsis: actin mutants act2-1 and act4-1. Plant J 8: 613–622 Miao ZH, Lam E (1995) Targeted disruption of the TGA3 locus in Arabidopsis thaliana. Plant J 7: 359–365 Newman T, de Bruijn FJ, Green P, Keegstra K, Kende H, McIntosh L, Ohlrogge J, Raikhel N, Somerville S, Thomashow M, and others (1994) Genes galore: a summary of methods for accessing results from large-scale partial sequencing of anonymous Arabidopsis cDNA clones. Plant Physiol 106: 1241–1255 Polyak K, Xia Y, Zweier JL, Kinzler KW, Vogelstein B (1997) A model for p53-induced apoptosis. Nature 389: 300–305 Puchta H, Hohn B (1996) From centimorgans to base pairs: homologous recombination in plants. Trends Plant Sci 1: 340–348 Rounsley S, Lin X, Ketchum KA (1998) Large-scale sequencing of plant genomes. Curr Opinion Plant Biol 1: 136–141 Santoni V, Bellini C, Caboche M (1994) Use of two-dimensional protein-pattern analysis for the characterization of Arabidopsis thaliana mutants. Planta 192: 557–566 Schena M, Shalon D, Davis RW, Brown PO (1995) Quantitative monitoring of gene expression patterns with a complementary DNA microarray. Science 270: 467–470 Schmidt R, Love K, West J, Lenehan Z, Dean C (1997) Detailed description of 31 YAC contigs spanning the majority of Arabidopsis thaliana chromosome 5. Plant J 11: 563–573 Schmidt R, West J, Love K, Lenehan Z, Lister C, Thompson H, Bouchez D, Dean C (1995) Physical map and organization of Arabidopsis thaliana chromosome 4. Science 270: 480–483 Sundaresan V, Springer P, Volpe T, Haward S, Jones JDG, Dean C, Ma H, Martienssen R (1995) Patterns of gene action in plant development revealed by enhancer trap and gene trap transposable elements. Genes Dev 9: 1797–1810 Tolstrup N, Rouze´ P, Brunak S (1997) A branch point consensus from Arabidopsis found by non-circular analysis allows for better prediction of acceptor sites. Nucleic Acids Res 25: 3159–3163 Uberbacher EC, Mural RJ (1991) Locating protein coding regions in human DNA sequences using a multiple sensor-neural network approach. Proc Natl Acad Sci USA 88: 11261–11265 Velculescu VE, Zhang L, Vogelstein B, Kinzler KW (1995) Serial analysis of gene expression. Science 270: 484–487 Velculescu VE, Zhang L, Zhou W, Vogelstein J, Basrai MA, Bassett DE Jr, Hieter P, Vogelstein B, Kinzler KW (1997) Characterization of the yeast transcriptome. Cell 88: 243–251 Wilson K, Long D, Swinburne J, Coupland G (1996) A dissociation insertion causes a semidominant mutation that increases expression of TINY, an Arabidopsis gene-related to APETALA2. Plant Cell 8: 659–671 Wodicka L, Dong H, Mittmann M, Ho MH, Lockhart DJ (1997) Genome-wide expression monitoring in Saccharomyces cerevisiae. Nat Biotechnol 15: 1359–1367 Yamamoto K, Sasaki T (1997) Large-scale EST sequencing in rice. Plant Mol Biol 35: 135–144 Zachgo EA, Wang ML, Dewdney J, Bouchez D, Camilleri C, Belmonte S, Huang L, Dolan M, Goodman HM (1996) A physical map of chromosome 2 of Arabidopsis thaliana. Genome Res 6: 19–25 Zwaal RR, Broeks A, van Meurs J, Groenen JTM, Plasterk RHA (1993) Target-selected gene inactivation in Caenorhabditis elegans by using a frozen transposon insertion bank. Proc Natl Acad Sci USA 90: 7431–7435