J Appl Genetics (2011) 52:371–390 DOI 10.1007/s13353-011-0061-1
PLANT GENETICS • REVIEW
TILLING - a shortcut in functional genomics Marzena Kurowska & Agata Daszkowska-Golec & Damian Gruszka & Marek Marzec & Miriam Szurman & Iwona Szarejko & Miroslaw Maluszynski
Received: 18 April 2011 / Revised: 16 August 2011 / Accepted: 17 August 2011 / Published online: 13 September 2011 # The Author(s) 2011. This article is published with open access at Springerlink.com
Abstract Recent advances in large-scale genome sequencing projects have opened up new possibilities for the application of conventional mutation techniques in not only forward but also reverse genetics strategies. TILLING (Targeting Induced Local Lesions IN Genomes) was developed a decade ago as an alternative to insertional mutagenesis. It takes advantage of classical mutagenesis, sequence availability and highthroughput screening for nucleotide polymorphisms in a targeted sequence. The main advantage of TILLING as a reverse genetics strategy is that it can be applied to any species, regardless of its genome size and ploidy level. The TILLING protocol provides a high frequency of point mutations distributed randomly in the genome. The great mutagenic potential of chemical agents to generate a high rate of nucleotide substitutions has been proven by the high density of mutations reported for TILLING populations in various plant species. For most of them, the analysis of several genes revealed 1 mutation/200–500 kb screened and much higher densities were observed for polyploid species, such as wheat. High-throughput TILLING permits the rapid and lowcost discovery of new alleles that are induced in plants. Several research centres have established a TILLING public service for various plant species. The recent trends in TILLING procedures rely on the diversification of bioinformatic tools, new methods of mutation detection, including mismatch-specific and sensitive endonucleases, but also various alternatives for LI-COR screening and single nucleotide polymorphism (SNP) discovery using next-generation M. Kurowska : A. Daszkowska-Golec : D. Gruszka : M. Marzec : M. Szurman : I. Szarejko : M. Maluszynski (*) Department of Genetics, Faculty of Biology and Environmental Protection, University of Silesia, Jagiellonska 28, 40-032 Katowice, Poland e-mail:
[email protected]
sequencing technologies. The TILLING strategy has found numerous applications in functional genomics. Additionally, wide applications of this throughput method in basic and applied research have already been implemented through modifications of the original TILLING strategy, such as Ecotilling or Deletion TILLING. Keywords TILLING platform . Plant mutagenesis . Bioinformatic tools . Reverse genetics . Next-generation sequencing technologies
Introduction One of the most direct ways of establishing gene function is to identify a mutation in the specific gene and to link this mutation to the phenotypic change in the mutated organism. In the forward genetics approach (“from mutation through phenotype to the gene”), large mutated populations have been created and screened for alterations in the trait or biological process of interest. Over the decades, large mutant collections have been developed for many model organisms. These isolated mutants have then served for the identification of the genes underlying the change in phenotype. The sequence of the gene responsible for the altered phenotype can be isolated using the process of map-based cloning. Although this approach is both time-consuming and labour-intensive, it has been successfully applied for cloning several genes, even in species with large genomes, such as barley and wheat (Keller et al. 2005; Komatsuda et al. 2007; Krattinger et al. 2009; Zhang et al. 2009). Recent advances in large-scale genome sequencing projects have opened up new possibilities for the application of mutation techniques in basic studies and in the improvement of crops. The reverse genetics strategy (“from
372
gene sequence to phenotype”) has widely replaced the forward approach in studies involved in detecting gene function. This strategy is based on the alteration of a gene structure or its activity, followed by an analysis of the associated change in plant phenotype. Several reverse genetics technologies, such as insertional mutagenesis with TDNA, transposon/retrotransposon tagging or gene silencing using RNA interference, have been proposed for plant functional genomics (for reviews, see: Alonso and Ecker 2006; Small 2007; Boutros and Ahringer 2008; Hirochika 2010; Bolle et al. 2011; Upadhyaya et al. 2011). However, the majority of these methods are fully applicable only for model plants with small genomes, such as Arabidopsis or rice, and even in these species, there are some drawbacks that limit their utilisation. TILLING (Targeting Induced Local Lesions IN Genomes) was developed a decade ago as an alternative to insertional mutagenesis in Arabidopsis thaliana (McCallum et al. 2000). TILLING takes advantage of classical mutagenesis, sequence availability and high-throughput screening for nucleotide polymorphisms in a targeted sequence. It combines the high frequency of mutations induced by traditional mutagenesis with sensitive techniques for discovering single nucleotide mutations. The main advantage of TILLING as a reverse genetics strategy is that it can be applied to any plant species, regardless of its genome size, ploidy level or method of propagation. Chemical mutagens, which are usually used in TILLING protocols, provide a high frequency of point mutations distributed randomly in the genome. An analysis of mutations induced by ethyl methanesulphonate (EMS) in 192 Arabidopsis genes revealed about ten mutations per gene among the 3,000 M2 plants examined (Greene et al. 2003). It was estimated that each M2 plant carried, on average, 720 mutations (Till et al. 2003), while only 1.5 T-DNA insertions per mutant line were detected in the Arabidopsis insertion populations (Alonso et al. 2003). Thus, much smaller populations are required to reach saturation mutagenesis using TILLING—ca. 5,000 M1 plants in Arabidopsis (Østergaard and Yanofsky 2004) as compared to 360,000 lines in T-DNA mutagenesis (Alonso and Ecker 2006). The application of TILLING makes the functional analysis of large genomes as well as small genes, which are difficult targets for insertional mutagenesis, possible. Another great advantage of TILLING technology relies on the ability of chemical mutagens to create a spectrum of mutations, including missense changes, truncation and mutations in splice junction sequences. In contrast to insertional mutagenesis that generates mostly gene knockouts, using TILLING, it is possible to induce a series of alleles in a targeted locus. In addition to loss-of-function alleles, chemical mutagens generate gain-of-function and hypomorphic alleles that can provide a range of phenotypes
J Appl Genetics (2011) 52:371–390
(Alonso and Ecker 2006). The mutations are stable, which is not always the case for alternative methods of reverse genetics utilising RNAi silencing or transposon, e.g. Ac/Ds tagging. In addition, RNAi technology and insertional mutagenesis through T-DNA or transposon tagging relies on genetic transformation. TILLING does not require transformation and, thus, is the only reverse genetics strategy applicable for species that are not transformable or recalcitrant. It is recommended as non-GMO technology, so when using TILLING, GMO procedures and controversies are avoided. Moreover, TILLING is not technically demanding and can be performed at a relatively low cost. The TILLING strategy was initially developed as a discovery platform for functional genomics, but it soon became a valuable tool in crop breeding as an alternative to the transgenic approach. The feasibility of TILLING has already been demonstrated for a large number of agronomically important crops, including rice, barley, wheat, maize, sorghum, soybean, rapeseed and tomato plants (Table 1). Large-scale TILLING services have also been created for model animal organisms such as Drosophila melanogaster, Caenorhabditis elegans, Danio rerio and Rattus norvegicus (Winkler et al. 2005; Gilchrist et al. 2006a; Wienholds et al. 2003; Smits et al. 2004, respectively). The general protocol for the creation of a TILLING platform in plants includes the following steps (Fig.1): 1. Creation of mutated populations – – – – –
Chemical mutagenesis Development of M1 and M2 generations DNA extraction from individual M2 plants Creation of DNA pools of 5–8 M2 plants Setting up an M3 seed bank
2. Detection of mutations in a targeted sequence – –
– –
Polymerase chain reaction (PCR) amplification of the targeted DNA segment using pooled DNA as a template Detection of mutations using different procedures, e. g. cleavage by specific endonuclease, denaturing high-performance liquid chromatography (DHPLC) or high-throughput sequencing Identification of the individual M2 plant carrying the mutation Sequencing the target gene segment to confirm the mutation and to determine the type of nucleotide change
3. Analysis of the mutant phenotype A mutated population becomes a TILLING platform when the DNA samples and seeds collected from a large M2 population are archived and put into databases. Usually,
EMS MNU
Williams 82
Williams 82
10,000
NaN3 NaN3-MNU MNU Gamma rays
Lux
Sebastian
DH 930-36
DH 930-36
B73
EMS
EMS
750
1,386
8,000
20,000
1,536
10,000
1,600
4,759
1,926
4,741
8,225
4,717
11
2
2
1
3
2
4
19
7
7
5
1
3
10
10
61
1
2
12
2
6
4
2
7
7
7
11
6
15
2
14
100
192
No. of genes analysed
12.8
5.6
1.3
24.7
11.5
4.0
6.5
146.9
12.5
36.6
32.8
9.7
3.2
8.0
8.0
288.9
3.3
4.4
41.0
12.3
52.3
10.2
12.3
7.7
7.7
5.3
65.1
32.8
11.2
0.53
40.0
301.6
576.0
Total sequence screened (Mb)
17
93
50
294
186
196
5
256
41
25
44
50
24
30
27
576
1
9
174
5
81
22
10
47
12
32
134
617
25
16
450
1,774
1,890
Total no. of mutations detected
*100–200 bp of each amplicon were excluded from the calculation of the total sequence length used for estimation of mutation density
Zea mays (2x)
EMS
Kronos
HII
Chara
Kronos
EMS
Hard Red Spring
Triticum durum (4x)
EMS
Express
Triticum aestivum (6x)
EMS
EMS
M82
BTx623
EMS
Red Setter
Sorghum bicolor (2x)
EMS EMS
Red Setter
Solanum lycopersicum (2x)
EMS
Tpaadasu
n.a.
Pisum sativum (2x)
MNU
Taichung 65
767
768
NaN3-MNU
Nipponbare
4,904 768
EMS
B-129 Gifu
Nipponbare
1,753
1,372
10,279
Lotus japonicus (2x)
EMS
9,575
EMS
Barke
4,906
NaN3
Morex
9,216
EMS
Optic
768
768
529
4,023
9,216
2,263
2,600
3,712
6,912
n.a.
Size of M2 population
Oryza sativa (2x)
Hordeum vulgare (2x)
EMS
Forrest
EMS
Glycine max (4x)
EMS
R-o-19
EMS EMS
Bekinda
TO1000
Avena sativa (6x)
Brassica oleracea (2x)
CharMono
EMS
Landsberg erecta
Brassica rapa (2x)
EMS
Columbia-0
Cucumis melo (2x)
EMS
Columbia-0
Arabidopsis thaliana (2x)
Mutagen
Cultivar/line/ ecotype
Species/ploidy level
Table 1 Description of TILLING populations developed in model and crop plants
485
51*
40
84
38*
24
526
574
574
322
737
193
135
265*
294*
502
3,297
486
235
2,500
500*
374*
1,000
140*
550*
140*
573
60
447*
33
89*
170*
300
Mutation density (1mutation/kb)
Till et al. 2004a, b
Uauy et al. 2009
Slade et al. 2005
Fitzgerald et al. 2010
Uauy et al. 2009
Slade et al. 2005
Xin et al. 2008
Piron et al. 2010
Minoia et al. 2010
Minoia et al. 2010
Gady et al. 2009
Triques et al. 2008
Suzuki et al. 2008
Till et al. 2007
Till et al. 2007
Perry et al. 2009
Unpublished data
Unpublished data
Unpublished data
Lababidi et al. 2009
Gottwald et al. 2009
Talamè et al. 2008
Caldwell et al. 2004
Cooper et al. 2008
Cooper et al. 2008
Cooper et al. 2008
Dahmani-Mardas et al. 2010
Stephenson et al. 2010
Himelblau et al. 2009
Chawade et al. 2010
Martín et al. 2009
Till et al. 2003
Greene et al. 2003
Reference
J Appl Genetics (2011) 52:371–390 373
374
J Appl Genetics (2011) 52:371–390
M2 seed collection DNA isolation
Mutagenic treatment M3 phenotyping
IRD 700
M4 seed storage
IRD 800
M2 mutation detection
M0
M1
Creation of mutated populations
M2
Detection of mutations
M3/M4 Phenotype analysis
Fig. 1 Development of a TILLING platform in barley
platforms of 3,000–5,000 M2 individuals are created, although larger populations that include 10,000 plants have also been reported. Almost all TILLING populations were developed using chemical mutagens, among them, the alkylating agent (EMS) was most often applied. The great mutagenic potential of chemical agents has been proven by the high density of mutations reported for established TILLING populations (Tables 1 and 2). Once established, the TILLING platform can serve as a permanent source of mutations for both forward and reverse genetics. In many cases, phenotypic observations of the M2 generation are performed and large M3 generations are generated for forward screening (Talamè et al. 2008; Wang et al. 2008a; Himelblau et al. 2009; Minoia et al. 2010). A detailed phenotypic evaluation of M2 and M3 progeny makes it possible to enrich the population that is screened for mutations in a specific gene, or for plants bearing a phenotypic change related to the studied metabolic or developmental process. Such an approach was successfully demonstrated by Perry et al. (2003) for the analysis of genes controlling the root symbiosis of Lotus japonicus using a TILLING population that was pre-selected for root nodulation mutants. Additionally, large M3 generations can provide a resource for the direct forward selection of mutants tolerant/hypersensitive to a range of abiotic and biotic stresses.
To facilitate the systematic gathering of information about the developed platform, including molecular and phenotypic data, TILLING databases are created and often made publicly available. Examples of such databases are presented in the further part of this paper, followed by a description of TILLING services, bioinformatic tools and methods of mutation detection, including the application of new generation technologies and modifications of the TILLING strategy. Presented below are also examples of the use of this technology in the creation of useful new alleles in many crop species, which are alternatives to the transgenic approach in plant breeding.
TILLING platforms and services Creating a TILLING population requires that a lot of information to be collected in a relevant database. Most of the available databases contain data on 5,000 to 13,000 plants of the M2 population. It is necessary to keep a description of every plant phenotype, information on the availability of the DNA extracted from each plant and seeds in the seed bank in such a database and to systematically gather information about the molecular and genetic research that is being carried out. Furthermore, this data has to be saved properly, in order to allow the results to be searched
25
11 7 7 7
Cucumis melo
Glycine max
256
7 19
Solanum lycopersicum (2x)
1
Hordeum vulgare
1
6
30
0
33.3
56.7
44.4
60
68.2
55.6
54.2
45
58.8
67.4
58.8
34
46
45.4
34.2
33.2
62.4
60
48.1
47.7
35.8
60
44
33
66
65.1
63.4
60
63.2
50
38.2
49.7
50
Missense (%)
100
0
33.3
36.1
0
18.2
22.2
41.7
51
38.2
27.7
41.2
n.a.
38.6
30.3
n.a.
20.7
37.6
34
33.4
20.5
39.5
40
52
58
34
31.3
34.3
40
36.8
50
36.5
45.8
45
Silent (%)
0
0
0
1.7
0
0
0
0
4
3.0
4.9
0
2.0
7.7
9.2
1.0
2.7
0
0
18.5
2.8
3.7#
0
4
8
0
2.4
2.3
0
0
0
4.2#
4.5
5
Nonsense (%)
# Truncation include mutations generating premature stop codons and mutations in splice sites
*The number of mutations for which the analysis of mutation types were proceed
25
10
Oryza sativa
Oryza sativa
Gamma rays
13
180
5
2
Hordeum vulgare
NaN3/MNU
9 22
2 4
Hordeum vulgare
24
47
Hordeum vulgare
3
Oryza sativa
34
7
10
Glycine max
512
56
Medicago truncatula
17
11
Zea mays
13
3 50
140
2 2
196
2
50
Triticum durum
Triticum aestivum
66
1
Pisum sativum
27
10
576
61
Oryza sativa
81
6
Lotus japonicus
10
2
134
617/306*
25
NaN3
MNU
12
6
Brassica rapa
Hordeum vulgare
32
15
Brassica oleracea
19
1
450
14
Brassica napus
1,774/1,063*
100 16
1,890
192
Total no. of mutations detected
2
Arabidopsis thaliana
EMS
No. of genes analysed
Avena sativa
Species
Mutagen
0
66.7
10
17.8
40
13.6
22.2
4.1
n.a.
n.a.
n.a.
0
n.a.
n.a.
15.1
n.a.
43.4
n.a.
6
n.a.
29
21
0
n.a.
n.a.
n.a.
n.a.
n.a.
n.a.
0
0
21.1
0
0
Non-coding (%)
0
n.a.
66.7
89.4
80
95.5
55.5
91.7
89.4
n.a.
98.8
100
100
n.a.
99.2
99.3
n.a.
44.3
70.4
93.4
n.a.
70
92
75
93.8
97.8
n.a.
100
94.7
94.4
n.a.
98
99
Transitions G/C > A/T (%)
Table 2 Functional mutation spectrum and types of nucleotide substitutions detected in different TILLING populations
0
n.a.
0
1.1
0
0
0
0
0
n.a.
0
0
0
n.a.
0
0
n.a.
0
0
n.a.
n.a.
10
4
0
0
0
n.a.
0
0
0
n.a.
n.a.
n.a.
Transitions A/T > G/C (%)
100
50
33.3
6.2
20
4.5
44.5
8.3
10.6
n.a.
1.2
0
0
n.a.
0.8
0.7
n.a.
55.7
29.6
n.a.
n.a.
20
4
16.7
6.2
2.2
n.a.
0
5.3
5.6
n.a.
n.a.
n.a.
Transversions (%)
Unpublished data
Sato et al. 2006
Till et al. 2007
Unpublished data
Lababidi et al. 2009
Talamè et al. 2008
Unpublished data
Suzuki et al. 2008
Cooper et al. 2008
Le Signor et al. 2009
Le Signor et al. 2009
Till et al. 2004a
Slade et al. 2005
Sestili et al. 2010
Dong et al. 2009
Slade et al. 2005
Piron et al. 2010
Minoia et al. 2010
Triques et al. 2008
Till et al. 2007
Perry et al. 2009
Gottwald et al. 2009
Caldwell et al. 2004
Cooper et al. 2008
Cooper et al. 2008
Cooper et al. 2008
Dahmani-Mardas et al. 2010
Stephenson et al. 2010
Himelblau et al. 2009
Wang et al. 2008a, b
Chawade et al. 2010
Martín et al. 2009
Till et al. 2003
Greene et al. 2003
Reference
J Appl Genetics (2011) 52:371–390 375
376
and sorted. That is why creating a database containing all of this information about the investigated plants is a very important part of every project involving the development of a TILLING platform. It is also desirable that such a database will be publicly available on the Internet. Most analyses of a phenotype apply to all stages of plant development and are divisible into very specific categories and subcategories. Typically, the main categories describe the attributes of the whole plant (e.g. time of flowering, size/height of plant, plant architecture) or individual plant organs (e.g. seeds, fruits, tillers, spikes), whereas subcategories apply to the phenotypes that have already been observed (e.g. leaf size, branching, abnormal spikes). The databases that are accessible on the Internet contain 48 to 107 subcategories grouped under various major categories. Additionally, descriptions of plants showing phenotypic changes have been supplied with photographic documentation. Some of the databases also contain information about genes that have already been analysed and any identified mutations in their sequences. In this case, the analysed sequence is entered into database with the identified mutations indicated and with information about its localisation in the exon or intron. Additionally, there is information about the nature of the mutation and its impact on the amino acid sequence and protein structure, if available. Some publicly accessible databases may constitute independent websites, whose only purpose is to describe either the specific project (LycoTILL, http://www.agrobios. it/tilling) or several projects carried out by one team (UTILLdb, http://urgv.evry.inra.fr/UTILLdb). When creating meta-services involving a number of different databases that already exist on various aspects of studies on one organism, TILLING databases can also be included (MaizeGBD, http://www.maizegdb.org/). A common feature of all of the accessible TILLING databases is the information about the phenotype of the analysed plants. Teams that previously only shared information about identified mutations now update the databases with the results of phenotyping, including photos and a detailed description of any changes in the phenotype (e.g. the Maize TILLING Project). There are only a few databases related to TILLING projects that are accessible. These databases have been created at different times and by different teams; therefore. they differ greatly in their content and the available options for users (Table 3). High-throughput TILLING permits the rapid and low-cost discovery of new induced alleles in plants. However, the creation of a large TILLING platform is a time-consuming, labour-intensive and expensive task. Several research centres from Europe and North America have established TILLING public services for various plant species: Medicago truncatula, L. japonicus and Brassica rapa at the John Innes Centre
J Appl Genetics (2011) 52:371–390
(RevGenUK); Pisum sativum and Solanum lycopersicum at the French National Institute for Agriculture Research (INRA) (UTILLdb); Oryza sativa, S. lycopersicum and A. thaliana at the University of California; A. thaliana by the Seattle TILLING Project (STP); Zea mays at Purdue University; Glycine max at Southern Illinois University; Avena sativa at CropTailor AB; A. thaliana, B. oleracea and B. napus at the University of British Columbia (CAN-TILL); Hordeum vulgare at the Department of Agro-Environmental Sciences and Technology (DiSTA) of the University of Bologna (TILLMore: a TILLING resource in Barley Morex). Information about the assayed genes (TILLed genes) using the TILLING strategy is not always available on the websites because this information could be of commercial value. It is possible to order the TILLING analysis of any known gene that is involved in a process that is being investigated or a trait in particular species (Table 3). However, it is important to remember that knowing the genomic sequence of the chosen gene or genes is necessary and the user must decide whether the gene is a good candidate for TILLING. On the websites of the above-mentioned public services, the potential user can find all of the information which is necessary to start a project, e.g. how to find the best region of the gene to target and how design the proper primers using free web-based tools. Screening the selected region of the requested gene for mutations discovery is usually provided by the service. After analysis, the service provides the user with a list of mutations in the investigated sequence(s) and seeds of related mutants. In a short time, the scientists and plant breeders can take advantage of existing sources of the induced genetic diversity in those plant species for which commercial services are available. Several research centres have created TILLING populations for particular species and cultivars that are of interest. The results of these investigations can be found in related publications (Table 4).
Mutagens Chemical mutagenesis causes both point mutations, which are irreversible and produced in relatively high densities, and also chromosome breaks that cause various chromosomal rearrangements, which can reduce fertility and affect lethality. Unlike insertional mutagenesis, the high density of chemically induced point mutations makes TILLING suitable for targeting small genes or single protein domains that are encoded by large genes (Till et al. 2003). In contrast to insertional mutagenesis, the TILLING strategy is general, because chemical mutagenesis has been successfully applied to most major taxa (Henikoff and Comai 2003). Alkylating agents are the most commonly applied chemicals in plant mutagenesis. They constitute a class of base-modifying compounds which directly alter the structure and properties of the bases. DNA
Solanum lycopersicum Lotus japonicus Pisum sativumSolanum lycopersicumBrachypodium distachyon Solanum lycopersicum Glycine max Medicago truncatulaLotus japonicusBrassica rapa Oryza sativaSolanum lycopersicumArabidopsis thaliana Arabidopsis thaliana Avena sativa Arabidopsis thalianaBrassica oleraceaBrassica napus Hordeum vulgare
Tomato Mutant Database Lotus japonicus mutant finder UTILLdb
+ + + +
− − − − −
− − − − +
+
− + +
− + −
+ + −
http://www.distagenomics.unibo.it/TILLMore/
http://tilling.fhcrc.org/ http://www.nordgen.org, http://www.croptailor.com http://www.botany.ubc.ca/can-till/
http://tilling.ucdavis.edu/index.php/Main_Page
http://www.agrobios.it/tilling/ http://www.soybeantilling.org/ http://revgenuk.jic.ac.uk/about.htm
http://zamir.sgn.cornell.edu/mutants/ http://data.jic.bbsrc.ac.uk/cgi-bin/lotusjaponicus/ http://urgv.evry.inra.fr/UTILLdb
− − +
+ + +
+ + +
Link
Information about TILLed genes*
Commercial service
Phenotype description
*TILLed gene—gene analysed with the use of the TILLING strategy
TILLMore
Seattle TILLING Project NordGen, CropTailor AB CAN-TILL
UC Davis TILLING Core
LycoTILL Soybean Mutation Database RevGenUK
Species
Name of database
Table 3 TILLING public platforms and commercial services for different plant species
Talamè et al. 2008
− Chawade et al. 2010 Himelblau et al. 2009
Till et al. 2007
Minoia et al. 2010 − Stephenson et al. 2010
Menda et al. 2004 Perry et al. 2003 Dalmais et al. 2008
Reference
J Appl Genetics (2011) 52:371–390 377
378
J Appl Genetics (2011) 52:371–390
Table 4 TILLING populations of different plant species for which the databases and/or commercial services are not available on the Internet at present Species
Centre
Country
Reference
Arabidopsis thaliana
Fred Hutchinson Cancer Research Center Cereon Genomics Fred Hutchinson Cancer Research Center Departamento de Genética Molecular de Plantas, Centro Nacional de Biotecnología (CNB) Department of Plant and Environmental Sciences, Goteborg University Department of Biology, California Polytechnic State University
USA USA USA Spain
Greene et al. 2003 Jander et al. 2003 Till et al. 2003 Martín et al. 2009
Sweden USA
Chawade et al. 2010 Himelblau et al. 2009
UK France USA UK Italy
Stephenson et al. 2010 Dahmani-Mardas et al. 2010 Cooper et al. 2008 Caldwell et al. 2004 Talamè et al. 2008
Germany Denmark UK UK UK Japan
Gottwald et al. 2009 Lababidi et al. 2009 Perry et al. 2009 Vriet et al. 2010 Rogers et al. 2009 Sato et al. 2006
Avena sativa Brassica oleracea Brassica rapa Cucumis melo Glycine max Hordeum vulgare
Lotus japonicus Medicago truncatula Oryza sativa
Department of Crop Genetics, John Innes Centre Unite de Recherche en Genomique Vegetale, INRA-UEVE-CNRS Fred Hutchinson Cancer Research Center Scottish Crop Research Institute Department of Agroenvironmental Sciences and Technology, University of Bologna Leibniz Institute of Plant Genetics and Crop Plant Research (IPK) Department of Agriculture and Ecology, University of Copenhagen The Sainsbury Laboratory Metabolic Biology, John Innes Centre Department of Disease and Stress Biology, John Innes Centre Graduate School of Agricultural Science, Tohoku University
Fred Hutchinson Cancer Research Center Genetic Strains Research Center Solanum lycopersicum Wageningen UR, Plant Breeding, Wageningen University and Research Center Metapontum Agrobios Unité de Recherche en Génomique Végétale, UMR INRA-CNRS-Uni Sorghum bicolor Plant Stress and Germplasm Development Unit Triticum aestivum Anawah Inc. Plant Breeding Institute Department of Plant Sciences, University of California CSIRO Plant Industry Department of Agrobiology and Agrochemistry, University of Tuscia
USA Till et al. 2007 Japan Suzuki et al. 2008 The Netherlands Gady et al. 2009 Italy France USA USA Australia USA Australia Italy
Minoia et al. 2010 Piron et al. 2010 Xin et al. 2008 Slade et al. 2005 Dong et al. 2009 Uauy et al. 2009 Fitzgerald et al. 2010 Sestili et al. 2010
Triticum turgidum
USA USA USA
Slade et al. 2005 Uauy et al. 2009 Till et al. 2004a
Zea mays
Anawah Inc. Department of Plant Sciences, University of California Basic Sciences Division, Fred Hutchinson Cancer Research Center
bases differ in their vulnerability to chemical modification by alkylating mutagens: ring nitrogens are more reactive than oxygens and the N7 position of the guanine and N3 position of the adenine are the most prone to modification. Alkylating agents cause every type of point mutation: transitions, transversions, deletions and frameshifts, as well as chromosome breakages (Maluszynski et al. 2003). In the majority of TILLING experiments, especially those conducted on Arabidopsis, EMS has been applied as a mutagen. In addition to this species, EMS has been used as the mutagen in TILLING experiments performed on B. napus, B. oleracea, G. max, H. vulgare, L. japonicus, M. truncatula, O. sativa, Sorghum bicolor, Triticum aestivum, T. durum and Z. mays (Gilchrist and Haughn 2005; Martín
et al. 2009). EMS-induced mutations are randomly distributed in the genome and a high degree of mutational saturation can be achieved without excessive DNA damage (Gilchrist and Haughn 2005). In Arabidopsis, 5% of the mutations induced by this mutagen in coding regions result in the premature termination of the gene product (nonsense mutations) or mutations in splice sites, whereas ca. 50% lead to missense mutations (Greene et al. 2003; Martín et al. 2009). EMS alkylates guanine bases and leads to mispairing: alkylated guanine pairs with thymine, which results mainly in G/C to A/T transitions (Henikoff and Comai 2003). This type of transition makes up more than 99% of all EMS-induced mutations in Arabidopsis, maize and wheat. However, when the frequencies of various types
J Appl Genetics (2011) 52:371–390
of EMS-induced mutations were analysed in other species (tomato, rice and barley) G/C to A/T transitions constituted no more than 70% (Minoia et al. 2010). The discussed mutation percentages and frequencies are reported in Tables 1 and 2. Another alkylating agent, N-methyl-N-nitrosourea (MNU, MNH), induced only G/C to A/T transitions in several TILLING experiments in G. max and O. sativa (Cooper et al. 2008 and Suzuki et al. 2008, respectively). The mutation frequency induced by this mutagen in G. max was comparable to the frequency induced in this species by EMS (1 mutation/140 kb) (Cooper et al. 2008). However, in rice, MNU-induced mutations had a frequency that was two times higher (1 mutation/135 kb) than EMS (1 mutation/ 300 kb) (Till et al. 2007; Suzuki et al. 2008; Martín et al. 2009). However, it should be kept in mind that, in the case of the MNU treatment, the panicles were exposed to the mutagen, while in the EMS experiment, the seeds were treated with the mutagen. Another confirmation that the treatment procedure is crucial for the mutation frequency obtained is the comparison of mutation frequencies between two TILLING experiments in rice, both using MNU. In one of these experiments, rice panicles were treated with 1 mM MNU (Suzuki et al. 2008), whereas in the second, the rice seeds were exposed to a combined treatment with 1 mM of sodium azide and 15 mM MNU (Till et al. 2007). The mutation frequency obtained after the treatment of the panicles was higher (1 mutation/135 kb) than the frequency which resulted from the combined treatment of the seeds (1 mutation/265 kb) (Suzuki et al. 2008 and Till et al. 2007, respectively). Sodium azide, which has been used as the mutagen in several experiments, is a chemical compound that becomes mutagenic only in some organisms, e.g. Escherichia coli, Saccharomyces cerevisiae, H. vulgare, O. sativa and several other plant species, but does not increase mutation frequencies in A. thaliana and is only marginally mutagenic in humans and animals (Sadiq and Owais 2000). In barley, sodium azide is mutagenic in acidic pH (pH=3) and it primarily induces A/T to G/C transitions. The frequency of chromosome breakage caused by sodium azide is relatively low (Maluszynski et al. 2003). Depending on the species, various concentrations of sodium azide and treatment times are used (for a review, see Gruszka et al. 2011). Apart from a combined treatment with MNU, sodium azide has also been applied in a TILLING experiment in barley, in which three different concentrations (1 mM, 5 mM and 10 mM) of sodium azide were used. Samples treated with these concentrations showed germination rates at similar levels of 85%, 82.5% and 81.3%, respectively. Given the mutation density and acceptable lethal effect, a 10 mM concentration of sodium azide was considered to be optimal (Talamè et al. 2008). The mutation frequency obtained in this experiment
379
was 1 mutation/374 kb and was about three times higher than in the experiment in which EMS was applied as the mutagen (1 mutation/1 Mb) (Talamè et al. 2008 and Caldwell et al. 2004, respectively). Physical mutagens, gamma-ray radiation and fast neutrons are also applied in functional genomics in plants. In order to create a TILLING population, seeds of japonica rice were irradiated with 500 Gy of gamma rays. The average size of the 25 rice genome regions tested in the experiment was 1.2 kb. The mutation frequency was determined as 1 mutation/6.2 Mb. Four of the mutations identified were single nucleotide substitutions and two were 2-bp and 4-bp deletions. Among point mutations, transversions (C/G to A/T and C/G to G/C) are three times more abundant than transitions (mainly C/G to T/A). Taking into account the results of various experiments using gamma radiation, half of the point mutations induced by this mutagen were deletions, which can cause a frameshift if located in exons. The detection rate of knockout mutations generated by this mutagen was much higher than in a TILLING experiment in which chemical mutagens were applied (Sato et al. 2006). Deletion TILLING (De-TILLING; see below) utilises fast neutron bombardment to develop mutagenised populations (Li et al. 2001). Fast neutrons are a form of highenergy radiation which induces a broad range of deletions and other chromosomal mutations in plants. Several sources of fast neutrons are potentially available for mutagenesis, including particle accelerators and nuclear research reactors. Fast neutrons produced by nuclear fission are accompanied by gamma radiation; however, its contribution is adjustable. To generate short-range secondary particles within the cell nucleus which mediate DNA strand breakage, the neutron energy should be in the range of 500 keV to 5 MeV. De-TILLING mutants offer advantages for crop improvement, as they possess relatively fewer background mutations (Rogers et al. 2009). Deletional mutagenesis may be the best way to knock out tandemly repeated genes, which are common in plant genomes (Achaz et al. 2001; Li et al. 2001). The two chemical mutagens that are the most widely used in TILLING experiments in animals are N-ethyl-Nnitrosourea (ENU) and EMS. The former induces both transitions and transversions (G/C to C/G and A/T to C/G); however, G/C to A/T transitions are in the majority (Maluszynski et al. 2003). ENU induces high frequencies of point mutations and is a more potent mutagen than EMS. ENU, which is an alkylating agent, leads to mispairing and, ultimately, results in base pair substitutions and, sometimes, base pair losses (Guénet 2004). In the cases of rats (R. norvegicus) and mice (Mus musculus), ENU is supplied at the dose of 50–100 mg/kg (Smits et al. 2004 and Nolan et al. 2000, respectively), whereas in a zebrafish (D. rerio)
380
TILLING experiment, the mutagen was applied at a concentration of 3 mM (Wienholds et al. 2003). In rodents, the average density of ENU-induced mutations was 1 mutation/2.3 Mb (in rats) and 1 mutation/1 Mb in mice (Smits et al. 2004 and Nolan et al. 2000, respectively). The density of ENU-induced mutations in the zebrafish genome was significantly higher and was determined as 1 mutation/ 235 kb (Wienholds et al. 2003). The second alkylating agent used in TILLING experiments in animals is EMS. However, this mutagen is predominantly used in D. melanogaster and C. elegans. During the mutagenesis procedure in TILLING experiments in D. melanogaster, the mutagen was used at a concentration of 50 mM, whereas in C. elegans, the mutagen concentration was 25 mM. As far as mutation densities are concerned, it was determined as 1 mutation/150 kb in D. melanogaster (Winkler et al. 2005), whereas the mutation frequency in C. elegans was 1 mutation/293 kb (Gilchrist et al. 2006a).
Bioinformatic tools in the TILLING strategy The bioinformatic tools are used in the TILLING strategy from the beginning, when the candidate gene is the newly identified homologue and the amplicon is determined, till the end, when the analysis of obtained alleles are performed in terms of their impact on protein function. It is important to state that there is no need to know the full genome of the studied species in order to analyse it with the TILLING strategy. The sequence of the gene of interest can be retrieved for many species from databases, such as GenBank (http://www.ncbi.nlm.nih.gov/genbank/) and then a proper homologue can be identified. In the case of barley, whose genome is not fully sequenced, cloning homologues enables their functional analysis. Candidate genes for analysis, when not available for particular species, as e.g. in barley, can be retrieved from GenBank database of Arabidopsis or rice. Afterwards, in the case of Arabidopsis genes, a BLAST search is performed against the rice genome to identify the rice homologue. In order to amplify the coding sequence of a proper homologue, it is necessary to use mRNA and amino acid sequences as a queries in the barley EST databases. The most popular EST databases are TIGR Plant Transcript Assemblies (http://plantta.jcvi.org/), with 456,410 barley EST records (latest update July, 2007), and Computational Biology and Functional Genomics Laboratory (http://compbio.dfci.harvard.edu), with 502,606 barley EST records (latest update March, 2011). EST sequences with the highest similarity are chosen as a template to design primers in order to amplify them. Assembling of the amplified sequences into a barley coding sequence is achieved by using several tools, e.g. CodonCode Aligner (http://www. codoncode.com/aligner), which is able to align and put
J Appl Genetics (2011) 52:371–390
together contigs into one consensus sequence. The obtained full barley coding sequence is then aligned with the rice genomic sequence in order to establish putative borders between exons and introns. It can be performed using the BLASTN algorithm or software such as Splign (http://www. ncbi.nlm.nih.gov/sutils/splign/splign.cgi). The latter additionally makes a graphic model of the gene (Kapustin et al. 2008). It enables the designing of primers in order to confirm experimentally intron presence or absence. Again, the assembling of contigs into a full genomic sequence can be performed with the use of CodonCode Aligner. For the purpose of obtaining the barley gene model, coding and genomic sequences are aligned with the use of BLASTN or Splign software. Based on the coding sequence, the amino acid sequence is determined via in silico translation. The last step is the confirmation of the orthology character of a cloned homologue using GreenPhyl (http://greenphyl.cirad. fr/). GreenPhyl contains gene sequences automatically clustered from 12 complete plants’ genomes. The determination of an amplicon is a crucial step for TILLING analysis. The selection of a suitable amplicon provides a higher probability to identify changes in the DNA sequence with an impact on the protein function during TILLING screenings. It is worthwhile to choose a fragment as much as possible within the coding region. The second condition is to identify the region with the most potential to generate deleterious changes. This can be achieved with software such as CODDLE (Codons Optimized to Discover Deleterious LEsions; http://www.proweb.org/coddle/coddle_ help.html). CODDLE performs BLAST alignment in order to identify a conserved region, uses SIFT (Sort Intolerant From Tolerant) and PSSM (Position-Specific Scoring Matrix). In addition to CODDLE analysis, the alignment of genomic and amino acid sequences from closely related species with the use of BLASTN and ClustalW2 (http://www.ebi.ac.uk/Tools/ msa/clustalw2/), respectively, can be performed. Each of the identified alleles is then analysed in terms of influence protein. A bioinformatic tool designed for displaying and analysing nucleotide polymorphisms is PARSESNP (Project Aligned Related Sequences and Evaluate SNPs; http://www.proweb.org/parsesnp/parsesnp_help.html; Taylor and Greene 2003). PARSESNP determines the effect of single nucleotide polymorphisms (SNPs) on protein, based on the alignment of related proteins with the use of PSSM and SIFT. Sequence alignments are converted to the Blocks format and then to PSSM. PSSM is aligned to the gene with the use of the Multiple Alignment Search Tool (MAST). It determines mapping of PSSM onto a sequence. Large positive PSSM (>10) means that missense change in the analysed sequence of the DNA can be dramatic for protein function. SIFT allows to predict the severity of change; a SIFT score lower than 0.05 could have the same effect as a PSSM higher than 10. Another feature of PARSESNP is
J Appl Genetics (2011) 52:371–390
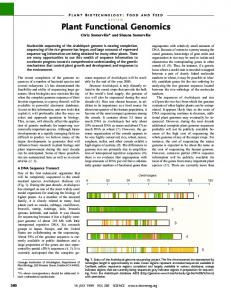
the ability to predict changes in the restriction enzyme recognition sites. Before starting to phenotype plants carrying mutations identified during the TILLING screenings, it is possible to predict the putative effect of mutation on the secondary structure of proteins. There are several bioinformatic tools used for this purpose. Commonly used are SAS (Sequence Annotated by Structure; http://www.ebi.ac.uk/thornton-srv/ databases/sas/; Milburn et al. 1998) and SOPMA (SelfOPtimized Method for secondary structure prediction with Alignment) http://npsa-pbil.ibcp.fr/cgi-bin/npsa_automat.pl? page=npsa_sopma.html; Geourjon and Deléage 1995). Both SAS and SOPMA are based on protein alignment algorithms. For proteins containing transmembrane domains, it is worth analysing whether gene products encoded by identified alleles still have these domains. For hydropathy plotting, there are plenty of different software programs available online, e.g. Kyte Doolittle (http://gcat.davidson.edu/rakarnik/ kyte-doolittle; Kyte and Doolittle 1982). Kyte Doolittle calculates the hydropathy plot on the basis of the average hydrophobicity of all amino acids of the studied protein (Fig. 2). Analysis in silico is also performed for these mutations that were identified in the non-coding region in terms of putative alternative splicing events. One of the available tools is ASD (Alternative Splicing Database, http://www. ebi.ac.uk/asd/; Thanaraj et al. 2004; Stamm et al. 2006), which analyses introns with SNPs in order to find an impact on the donor/acceptor site, polypyrimidine tract or branch point. It needs to be underlined that all in silico data performed with the use of bioinformatic tools has to be verified experimentally by phenotyping each mutant. Fig. 2 Example output of analysis using the KD software. A value higher than 1.7 for the window size of 19 indicates the transmembrane domain
381
TILLING protocol—cheaper over time Mismatch-specific and sensitive endonucleases The first strategy that was described for the TILLING procedure (McCallum et al. 2000) included the EMS treatment of Arabidopsis seeds, DNA isolation and pooling, PCR reaction of the fragment of interest, heteroduplex formation and the identification of heteroduplexes using DHPLC. Since then, TILLING has been used with many different organisms and many modifications to the procedure have been introduced that help to automate the screening of mutations and reduce its cost. Over time, the DHPLC method for detecting mutations in the TILLING approach was, in most cases, replaced by the digestion of heteroduplexes using specific endonucleases followed by polyacrylamide electrophoresis and visualisation in the very sensitive LI-COR gel analyser system (LI-COR Biosciences), which is less expensive and faster than DHPLC (Colbert et al. 2001; Till et al. 2006a). Single-stranded specific endonuclease has been used to cleave heteroduplex DNA at the mismatch site in the TILLING procedure. The most popular mutation detection method for TILLING is a mismatch cleavage assay using the endonuclease CEL I from celery in plants (Gottwald et al. 2009), animals (Wienholds et al. 2003) and humans (Till et al. 2006b). CEL I-like nucleases are also found in other plant species: alfalfa, asparagus and tomato. There is one report of using CEL I extracted from the petioles of B. rapa (Sato et al. 2006). There are other single-stranded-specific nucleases, such as: S1 from Aspergillus oryzae, P1 form Penicillium citrinum and mung bean nuclease from the sprouts of Vigna radiata, but they are
382
mainly active near pH 5.0. The neutral pH optimum incision, which occurred primarily at the phosphodiester bond immediately on the 3′ side of the mismatch and stimulation of activity by a DNA polymerase, are properties that distinguish CEL I from the above-mentioned nucleases (Oleykowski et al. 1998). The successful use of purified nucleases derived from mung bean sprouts (Till et al. 2004b; Kadaru et al. 2006) and Aspergillus (S1) (Till et al. 2004b) has also been reported in TILLING. ENDO I from A. thaliana is another mismatch-specific endonuclease that belongs to the S1 type. The application of ENDO I has been reported in mutation diagnostics in humans, the fingerprinting of complex populations of viruses, TILLING in P. sativum (Triques et al. 2007, 2008) and S. lycopersicum (Minoia et al. 2010) and Ecotilling (see below) in A. thaliana (Triques et al. 2008). At the beginning, the most time-consuming step of this method was the cleavage of heteroduplex using a purified enzyme which was, and still is, an expensive reagent. A few years later, it was discovered that crude celery juice extract could also be used for mismatch cleavage and that its endonuclease activity is the same or even higher than in the case of the purified enzyme. The process of preparing it from celery is simple and very cheap, and takes less than two days. The protocol for crude celery juice extract isolation is based on a series of dialyses of the extract directly after juicing the celery. Once isolated, celery juice extract can be used for up to a few years when stored at −80°C (Till et al. 2004b). However, it should be remembered that techniques employing mismatch-specific cleavage enzymes are often limited, as some enzymes do not recognise all mismatch types, have a low sensitivity in detecting one allele in a pool of DNA or lead to a high gel background caused by nonspecific cleavage (Triques et al. 2007). To perform TILLING in a cost-effective manner, the purification procedure can also be improved. Sephadex plates can be used as a most effective tool for the purification of PCR products after digestion, but there are also some different methods, e.g. ethanol, which is much cheaper and the efficiency of its action is approximately the same. Alternatives for LI-COR screening An alternative method of analysing mutations without using LI-COR screening for which labelled, and, therefore, expensive, primers are required can be the use of nondenaturing polyacrylamide gels with ethidium bromide staining, which was found to have an almost similar sensitivity as traditional LI-COR analysers. This modified TILLING approach was performed in wheat (Uauy et al. 2009). A modified TILLING system using non-labelled primers and fast capillary gel electrophoresis was applied in O. sativa (Suzuki et al. 2008). This system has several
J Appl Genetics (2011) 52:371–390
advantages compared to electrophoresis on a flat glass plate gel: a rapid separation and easier detection of digested fragments on chromatographic images, but a lower sensitivity of detection based on an emission signal from the ethidium bromide intercalation. Also, a mutation scanning method that does not rely on fluorescent primers was implemented by Caldwell et al. (2004). This is based on the double-stranded cleavage of heteroduplex molecules with CEL I nuclease with subsequent fragment detection using a Transgenomic WAVE High Sensitivity denaturing High Performance Liquid Chromatography (WAVEHS dHPLC) system. Another example is the high-throughput capillary electrophoresis system (AdvanceCE™ FS96, Advanced Analytical), which appears to be an investment that can reduce the costs and, most importantly, the time needed to detect mutations. Using this system, the purification step does not have to be performed, which decreases the time needed and the electrophoresis takes about a fifth of the time compared to using LI-COR scanners. Moreover, the PCR reaction is cheaper because the primers used are not labelled, the endonuclease is provided in the reagent kit and the process of loading samples for electrophoresis is automated (C. Weil, personal communication). Other possible inexpensive alternatives are agarosebased detection systems containing SYBR Green I dye, which was used in O. sativa (Sato et al. 2006) or thin agarose gels (