Yampolsky et al. BMC Genomics 2014, 15:859 http://www.biomedcentral.com/1471-2164/15/859
RESEARCH ARTICLE
Open Access
Functional genomics of acclimation and adaptation in response to thermal stress in Daphnia Lev Y Yampolsky1*, Erliang Zeng2,3, Jacqueline Lopez4, Patricia J Williams1,5, Kenneth B Dick1, John K Colbourne6 and Michael E Pfrender4
Abstract Background: Gene expression regulation is one of the fundamental mechanisms of phenotypic plasticity and is expected to respond to selection in conditions favoring phenotypic response. The observation that many organisms increase their stress tolerance after acclimation to moderate levels of stress is an example of plasticity which has been long hypothesized to be based on adaptive changes in gene expression. We report genome-wide patterns of gene expression in two heat-tolerant and two heat-sensitive parthenogenetic clones of the zooplankton crustacean Daphnia pulex exposed for three generations to either optimal (18°C) or substressful (28°C) temperature. Results: A large number of genes responded to temperature and many demonstrated a significant genotype-byenvironment (GxE) interaction. Among genes with a significant GxE there were approximately equally frequent instances of canalization, i.e. stronger plasticity in heat-sensitive than in heat-tolerant clones, and of enhancement of plasticity along the evolutionary vector toward heat tolerance. The strongest response observed is the across-the-board down-regulation of a variety of genes occurring in heat-tolerant, but not in heat-sensitive clones. This response is particularly obvious among genes involved in core metabolic pathways and those responsible for transcription, translation and DNA repair. Conclusions: The observed down-regulation of metabolism, consistent with previous findings in yeast and Drosophila, may reflect a general compensatory stress response. The associated down-regulation of DNA repair pathways potentially creates a trade-off between short-term benefits of survival at high temperature and long-term costs of accelerated mutation accumulation. Keywords: Gene expression, Thermal tolerance, Temperature, Plasticity, GxE, Metabolic compensation, Canalization
Background Organisms respond to environmental changes by adjusting their physiology, biochemistry, behavior, and sometimes, morphology. The ability of a single genotype to generate a variety of phenotypes in response to environmental changes is termed phenotypic plasticity and the resulting increase of tolerance to stressful levels of environmental parameters is known as acclimation. One of the central goals in the study of adaptive phenotypic plasticity has been the analysis of reaction norms in ancestral and * Correspondence:
[email protected] 1 Department of Biological Sciences, East Tennessee State University, Johnson City, TN 37641, USA Full list of author information is available at the end of the article
evolved populations [1-3]. In the postgenomic era such analysis is a necessary condition for answering one of the major emerging questions in evolutionary and ecological genomics: are the genes involved in plastic responses the same as those underlying adaptive differentiation [4]? Using the emerging model organism Daphnia, we address this question by analyzing the differential expression patterns of heat-tolerant and heat-sensitive genotypes that have been acclimated to either optimal or stressfully high temperature. One fundamental molecular mechanism of phenotypic plasticity acclimation is up- or down-regulation of the expression of individual genes to meet the organism’s needs prescribed by the changing environment [5,6]. Phenotypic
© 2014 Yampolsky et al.; licensee BioMed Central Ltd. This is an Open Access article distributed under the terms of the Creative Commons Attribution License (http://creativecommons.org/licenses/by/4.0), which permits unrestricted use, distribution, and reproduction in any medium, provided the original work is properly credited. The Creative Commons Public Domain Dedication waiver (http://creativecommons.org/publicdomain/zero/1.0/) applies to the data made available in this article, unless otherwise stated.
Yampolsky et al. BMC Genomics 2014, 15:859 http://www.biomedcentral.com/1471-2164/15/859
plasticity is easy to observe but difficult to interpret. In particular, it can be difficult to untangle plasticity and adaptation, as adaptation may be achieved by the evolution of plasticity rather than by the evolution of a constitutive tolerance mechanism. A further complication is that it may be difficult to demonstrate that phenotypic plasticity at the level of gene regulation is causative of higher fitness in the inducing environment. Correlated patterns of expression due to regulatory or developmental constraints [1,7] may cause cascades of genes to respond in a concordant manner, seemingly to match the environmental demand. For example, among the large number of genes responding to early exposure to ethanol in Drosophila embryos [8] there are genes that are likely downstream responses to ethanol presence and thus non-adaptive in the sense of increased ethanol tolerance. Similarly, if genes respond to the same transcriptional regulators with the causative, adaptively plastic genes, the correlated response will make it difficult to single out the causative genes. In cases where a small number of candidate genes are implicated in adaptive plastic responses it is possible to employ direct genespecific manipulative fitness-measuring approaches. However, when a significant portion of the genome responds to a specific environmental cue testing the fitness effect of each instance of differential expression becomes impractical. Validating the relationship between regulatory plasticity and adaptive value is particularly difficult in non-model systems lacking well-established reverse genetic approaches. In addition, the lack of functional annotations for many genes in non-model species complicates establishing the relationship between genes and phenotypes. One plausible approach is the measurement of gene expression rates in a common-garden experiment in which stress-tolerant and stress-sensitive genotypes are exposed to the same level of stress. While this approach is still subject to the difficulties caused by correlated responses it allows the identification of groups of co-regulated genes whose regulation is likely to be adaptive. Expression responses to the environment observed in stress-tolerant, but not stress-sensitive genotypes, are likely to represent an evolved mechanism rather than be a product of a regulatory constraint. Likewise, genes that are plastic in sensitive genotypes, but constitutive in tolerant ones, are likely to demonstrate adaptive elimination of misadaptive environmental response, i.e., canalization. Surprisingly, such common-garden experiments are scarce both in model [8-10] and non-model organisms [11,12]. To the best of our knowledge, here we report the first study of transcriptome response to temperature in Daphnia, a classic model for studies of phenotypic plasticity, and the first such study in the context of heat tolerance. Facing stressful environmental conditions an organism can respond either by minimizing damage, by reducing
Page 2 of 12
demand/increasing efficiency of the consumption of resources related to stress-tolerance, or by escaping the stressful environments. Investigations of the plasticity of heat tolerance in aquatic ectotherms have provided examples of all these response mechanisms. For example, thermal damage can be minimized by the chaperoning activity of heat shock proteins [13] or by activation of P450 cytochromes, recently implicated in a variety of heat-tolerance responses, possibly through their involvement in oxidative stress metabolic pathways [14,15]. Organisms in stressful low or high temperature environments can also implement membrane restructuring to achieve sufficient membrane fluidity at low temperatures without sacrificing structural stability, or suffering too much ion leakage at high temperatures [16,17]. Transcriptional responses of some of these specific heat response genes will be reported elsewhere (in preparation); here we will focus on genomewide patterns of response. In aquatic organisms high-temperature tolerance is often constrained by the mismatch between metabolic oxygen demand and oxygen availability. Indeed, metabolic demands typically increase exponentially with temperature, while oxygen availability is reduced by the lower solubility of oxygen in water at higher temperatures [18-21]. Numerous aquatic ectotherms are known to respond to elevated temperature by over expressing haemoglobins, which allows them to more efficiently transport and store oxygen [21-24]. In Daphnia haemoglobins are particularly interesting since they likely play a role in protecting tissues from oxidative damage [21] and are known to be co-expressed with the male-inducing hormonal pathway. The production of males and a transition to sexual reproduction is a possible mechanism to escape unfavorably high temperatures through shifting the reproductive effort to sexually produced diapausing eggs [25]. Another well-documented response of a variety of aquatic organisms to the dilemma posed by metabolic oxygen demand is temperature-induced metabolic compensation [26-28]. This compensatory response is characterized by the across-the-board reduction of metabolic activity at temperatures close to the upper tolerance limit. The protein-level mechanisms of this plastic response have attracted a great deal of attention [29], while comparable data on transcriptional response to temperature indicative of the metabolic compensation response are scarce [9,30]. In this paper we ask the following questions: 1) What is the generalized transcriptome response in Daphnia to long-term exposure to near-lethal temperature? 2) Are specific metabolic pathways up- or down-regulated during such acclimation? If so, can these pathways be identified as transcriptional manifestations of known temperature acclimation mechanisms such as metabolic
Yampolsky et al. BMC Genomics 2014, 15:859 http://www.biomedcentral.com/1471-2164/15/859
compensation? 3) Are the observed patterns of gene regulation different in a small sample of temperaturesensitive vs. temperature-resistant genotypes? and 4) For genes showing a significant genotype-by-environment interaction, is the magnitude of differential expression in response to temperature greater or less in heat-tolerant or heat-sensitive genotypes? If differential expression is adaptive, and if local adaptation occurs through evolution of plasticity, we expect to observe an increase in plasticity in heat-tolerant compared to heat-sensitive genotypes. An adaptive expansion of plasticity is often described as the initial phase of the Baldwin effect [31,32]. Conversely, greater plasticity in heat-sensitive compared to heattolerant genotypes would be indicative of canalization playing a role in adaptive changes in gene regulation. To summarize, we are reporting a genome-wide analysis of evolutionary patterns of transcriptional response during acclimation to high temperature in Daphnia, an emerging model system for ecological genomics.
Results Methodology overview
We analyzed the transcriptional profiles of four Daphnia genotypes, previously classified as either “heat tolerant” or “heat sensitive”, at two temperatures using microarray technology. For each gene the difference in mean expression between the two temperatures is a proxy for the phenotypic plasticity of this gene’s expression. The difference in the mean expression levels observed in heat tolerant and heat sensitive genotypes is, with reservations, a proxy for the constitutive adaptation of a gene’s expression level. Expression values were obtained for 29212 proteincoding genes annotated in the Daphnia pulex genome. No filtering for genes with expression level significantly higher than the background was employed to keep multiple test corrections conservative. A False Discovery Rate (FDR [33]) cut-off of 0.05 was used throughout the analysis. Functional gene annotations, including memberships in clusters of eukaryotic orthologous groups (KOGs [34]; see Methods for details), a widely used orthology-based functional classification were obtained from the Daphnia genome database (wfleabase.org). Overall response to temperature
The predominant genome-wide transcriptional responses occurring after 3 generations of acclimation to 28°C were the down-regulation of significant portions of metabolic and regulatory pathways. When all four clones are considered together, 892 KOGs were found to contain significantly down-regulated genes, while only 295 KOGs contained up-regulated genes. The same numbers for individual genes were 1549 genes down-regulated and 907 genes up-regulated. When northern and southern clones are considered separately (Table 1, Figure 1), the number
Page 3 of 12
Table 1 Numbers of differentially expressed (FDR < 0.05) genes in Northern (N, sensitive) and Southern (S, tolerant) genotypes (ns = non-significant) N, ns
N, up
N, down
Total
S, ns
27315
54
113
27482
S, up
719
46
0
765
S, down
942
0
23
965
Total
28976
100
136
29212
For example, 46 genes were found to be up-regulated in both N and S populations.
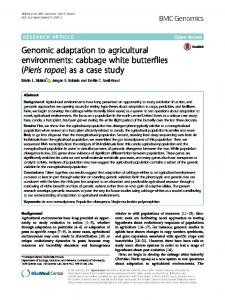
of significantly up- and down-regulated pathways and individual genes were more similar, but still, down-regulated genes outnumbered the up-regulated ones. Numerous down-regulated KOGs included proteins participating in fatty acid and amino acid metabolism pathways (Figure 2A). There were three standouts among the largely down-regulated lipid metabolism pathways steps (green elements in Figure 2A). One such standout was the step leading to palmitoil-coA, which contains an up-regulated enzyme described as very-long-chain specific acyl-coA dehydrogenase, possibly indicating a shift in the spectrum of lipids produced. Two other up-regulated lipid metabolism pathways were the steroid hormones biosynthesis pathway and terpenoid (steroid hormone precursor) metabolism pathway. Similarly, although many steps of some amino acid metabolism were down-regulated, some were up-regulated (Ala, Asp, Glu, Arg, Trp and Pro) and some parts of Val, Leu and Ile degradation pathways were up-, while others were down-regulated. The nucleotide metabolism pathway showed a patchwork of up- and down-regulated steps. A clear pattern emerged for regulatory pathways gene expression (Figure 1B, D). The experimental group acclimated to 28°C showed across the board down-regulation of nearly all KOGs participating in DNA replication (except Ribonuclease H, which is up-regulated), transcription (except the large subunit of RNA polymerase II and the subunit E), splicing (except splicing factors from RRM and SR superfamilies) and translation, including both the expression of ribosomal proteins and aminoacyl-tRNA synthetases. Interestingly, the aminoacyl-tRNA synthetases that showed a significant down-regulation (specifically, alanyl-, asparagyl-, leucyl-, isoleucyl- and tryptophanyl-tRNA synthetases) serve the amino acids that showed either up-regulated metabolism or a downregulated degradation pathway (Figure 2A). Degradation pathways that were down-regulated included ubiquitinmediated proteolysis (except E3 ubiquitin ligase, which was up-regulated), proteosome protein degradation and RNA degradation (except 5′-3′ exonuclease HKE1/RAT1, which was up-regulated). Another pathway showing a mixed up- and down regulatory pattern was the ABC superfamily of heavy metal exporter proteins. Uniformly
Yampolsky et al. BMC Genomics 2014, 15:859 http://www.biomedcentral.com/1471-2164/15/859
Page 4 of 12
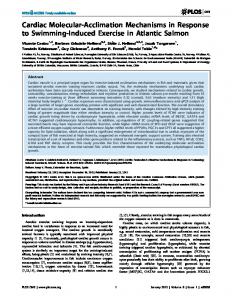
Figure 1 iPATH representation of differentially expressed genes in either Southern (A,B) or Northern (C,D) genotypes. A, C: metabolic pathways. B, D: regulatory pathways. Compare to Figure 2 for annotations of major pathways.
down-regulated genes included genes participating in homologous recombination as well as mismatch, nucleotide excision and base excision DNA repair. The fact that some pathways were highlighted on the iPATH map while others were not is not necessarily indicative of significant up- or down-regulation of the entire pathways or overrepresentation of members of such pathways among differentially expressed genes. It may rather be a manifestation of the large number of different KOGs participating in a given pathway. None of the pathways highlighted on Figure 2 (out of the total of 125 metabolic pathways) were significantly (after FDR correction) enriched in differentially expressed genes as indicated by Fisher’s Exact Test (data not reported). Thus, the comparison between highlighted and non-highlighted pathways is not meaningful. However, meaningful comparisons are between pathways that contain up- vs. down-regulated elements, and between pathways whose elements are differentially expressed in some, but not other genotypes. Indeed, the observed patterns were drastically different when the two heat-tolerant southern genotypes and the two heat-sensitive northern genotypes are considered separately (Figure 1). While some parts of metabolism were regulated in these two types of clones similarly
(e.g., fatty acid metabolism), others were not. The complex up- and down-regulation of nucleotide metabolism was seen in heat-tolerant, but not in heat-sensitive genoptypes, as were the down-regulation of N-glycan synthesis and the up-regulation of steroid hormone biosynthesis pathway. Several steps of ubiquinone and other terpenoid-quinone biosynthesis were up-regulated in heat-tolerant, but not in heat-sensitive genotypes (Figure 1A,C). Intriguingly, retinol metabolism was up-regulated in heat-tolerant, but (non-significantly) down-regulated in heat-sensitive genotypes. Finally, a discrepancy was observed between the analysis of terpenoid backbone biosynthesis pathway using both Northern and Southern genotypes in the complete model (Figure 2A) and the patterns that were observed in Northern and Southern genotypes considered separately. The complete model indicated that this pathway contained an up-regulated enzyme, trans-pentaprenyl transferase (EC:2.5.1.33), which was not significantly up- or down-regulated in either the Northern or Southern genotypes analyzed separately. In contrast, geranyl pyrophosphate synthase, an enzyme catalyzing a neighboring pathway step, was significantly down-regulated in Southern, but not the Northern genotypes (Figure 1A,C).
Yampolsky et al. BMC Genomics 2014, 15:859 http://www.biomedcentral.com/1471-2164/15/859
Page 5 of 12
A
B
Figure 2 Annotated iPATH representation of differentially expressed genes (significant temperature effect in all data). A: metabolic pathways; B: regulatory pathways. Red: down-regulation at 28°C relative to 18°C, Green: up-regulation.
An even more striking pattern of differences between Northern and Southern genotypes was observed in the gene expression of regulatory genes. Many more regulatory genes were down-regulated in heat-resistant than in heat-sensitive genotypes (Figure 1C,D). Heat-sensitive genotypes completely lack the characteristic down-regulation
of DNA replication and repair genes, and genes responsible for transcription and splicing observed in heat-tolerant genotypes. If this observation is correct, it indicates that acclimation to stressful subleathal elevated temperatures in Daphnia may be accompanied by systemic down-regulation of DNA replication and gene expression
Yampolsky et al. BMC Genomics 2014, 15:859 http://www.biomedcentral.com/1471-2164/15/859
machineries and that this pattern is associated with the increased tolerance to thermal stress found in the Southern genotypes. Canalization vs. enhancement of plasticity in heat adaptation
The presence of genotype-by-environment interaction in the comparison of geographically distinct genotypes may indicate the evolution of plasticity, including plasticity of gene expression. Assuming that heat-sensitive Northern genotypes represent the ancestral state and the heattolerant Southern genotypes represent the derived state, one may test whether this local differentiation occurred through genetic canalization (i.e., a reduction of plasticity where the inducible phenotype becomes constitutive) or an expansion of plasticity (i.e., Baldwin effect). Although the results in Figure 1 and Table 1 might indicate a widespread Baldwin effect (tolerant genotypes show differential expression, while sensitive clones do not), in reality there are nearly as many cases among genes with a significant (FDR q < 0.05) T*geo effect in which the Southern (heat tolerant) genotypes show a greater plasticity of expression than the Northern (sensitive) ones (Figure 3). Genome-wide principal component analysis
Figure 4 represents the principal component analysis of RNA samples in the space of transcript abundance values of the 29,212 genes represented on the array. There is a
Figure 3 Genes with significant T*geo interaction (tested against the pooled random MS; FDR q < 0.05), for which the Southern (heat-tolerant) genotypes show greater absolute difference in expression at two temperatures (green symbols, Baldwin effect) or smaller absolute difference in expression at the two temperatures (red symbols, canalization) than the Northern (heat sensitive) genotypes.
Page 6 of 12
clear separation between the Northern and Southern samples (open and solid symbols) and well as between the samples obtained from Daphnia acclimated to 18°C vs. 28°C (blue and red symbols; Figure 4A). A more detailed representation on pair-wise planes of the first three principal components (Figure 4B-D) shows a clear separation of biological replicates corresponding to each of the four clones. One exception is the Northern genotype C with three replicates (2 in 28°C and one in 18°C) located far from the other three replicates of this genotype and within the cloud of the Southern genotypes.
Discussion We analyzed the genome-wide transcription profiles of two Northern, heat-sensitive and two Southern, heattolerant genotypes of D. pulex that were acclimated to either 18°C or 28°C. We observed a widespread downregulation of expression in a variety of metabolic and regulatory pathways. This pattern of down-regulation was more pronounced in heat-tolerant genotypes. Because stressfully-high temperatures in aquatic ectotherms exacerbate the discordance between metabolic oxygen demand and oxygen solubility [18-20], we hypothesize that the observed down-regulation may be the molecular mechanism of metabolic compensatory reaction [28] to nearly lethal temperature. This finding is consistent with the growing body of evidence from yeast [30] and Drosophila [9] indicting that high temperature (as well as other stressors) can elicit genome-wide down-regulatory responses. The fact that this reaction is observed in heattolerant, but not in heat-sensitive genotypes suggests that it may be the causative mechanism of heat tolerance and not a direct non-adaptive effect of high temperature. This finding is in a striking disagreement with the results of a recent study on Drosophila suggesting that tropical (i.e., adapted) populations are more likely to exhibit upregulation of genes at 30°C than temperate populations [9]. Levine et al. [9] argued that this result suggests higher genome-wide levels of gene expression at temperatures most commonly experienced in the region of origin. The difference between our study and Levine et al. [9] may reflect real biological and ecological differences between the study organisms. Perhaps since Drosophila can escape overheating by behavioral thermal regulation they may show a different transcriptional response to stressful elevated temperature than do Daphnia from small ponds. The aquatic thermal environment is variable through time, but at any particular time point it is homogeneous compared to the terrestrial environment How confident can we be that the observed differences between the two Northern, heat-sensitive and the two Southern, heat-tolerant genotypes are indeed functionally related to the evolutionary history of temperature adaptation in these spatially distinct populations? Certainly a
Yampolsky et al. BMC Genomics 2014, 15:859 http://www.biomedcentral.com/1471-2164/15/859
Page 7 of 12
Figure 4 Principal components analysis of differential expression of 29,212 genes represented on the array in 4 clones of Daphnia from Northern (open symbols) and Southern (solid symbols) acclimated to either 18°C (blue symbols) or 28°C (red symbols). A: RNA samples in the 3D space of the first three principal components, together explaining 42.2% of variance. B – D: the same on pairwise 2D planes of the first three principal components. Arrows connect the Euclidean centroids of 3 replicates for each clone at each temperature (thin blue-red gradient arrows) or the centroids of all replicates at each of the two temperatures (thick blue-red gradient arrows) or at each of the two geographic origins (N vs. S, white-black gradient arrows).
larger sample size (feasible with RNAseq approaches, but logistically difficult within the microarray approach employed here) could have provided stronger evidence. There are two arguments that provide some support for the conclusion that the observed patterns are not independent from the evolutionary history of the populations used in this study. First, local populations of D. pulex in North America have long been known to show a high degree of populations subdivision, swamping the north– south differentiation [35]. This observation suggests that it is not likely that the two Southern or the two Northern genotypes, each derived from different local populations, have a recent common origin. Thus, the potentially confounding factor of phylogenetic relationship is likely minimal and our sample size is two per geographic region. Second, heat tolerance has been shown to be highly correlated with the climatic conditions and/or latitude, using a
larger number of clones, both in N. American D. pulex [36] and on world-wide sample in a congeneric D. magna [37]. Still, given the low number of replicates, the geographic patterns described here should be treated as a suggestion, not a solid proof of local adaptation to thermal environment. The fact that DNA repair pathways appeared to be down-regulated, opens an intriguing possibility of a mutagenic effect of high temperatures in those genotypes that demonstrate such down-regulation. The rate of spontaneous mutation is likely to be higher at elevated temperatures for thermodynamic reasons and the downregulation of DNA repair should exacerbate this effect. As a consequence genotypes down-regulating DNA repair pathways in response to elevated temperatures may survive periods of high temperature at a cost to a greater mutational pressure.
Yampolsky et al. BMC Genomics 2014, 15:859 http://www.biomedcentral.com/1471-2164/15/859
In a recent study, DNA repair in Daphnia has been shown to be much less effective at 20°C than at 10°C [38]. It is, however, not obvious that the down-regulation of DNA repair pathways observed in this study is a manifestation of the same phenomenon. Firstly, in [38] photoreactivation repair of UV damage was measured, while differential expression of photoreactivation pathway has not been detected here. More importantly, the cited study detected the decrease in DNA repair efficiency at the temperature (20°C) that is close to the optimum and far below the substressful temperature at which the downregulation of DNA repair pathways has been observed in this study. Several a priori expected signals of acclimation to higher temperature are apparent in either all genotypes or in the heat-tolerant genotypes only. These signatures include changes in lipid metabolism potentially indicative of the change in membrane and storage lipid composition – a possibility that warrants a joint transcriptome and lipidome analysis in heat-acclimated Daphnia. Another such pathway related to lipid metabolism is the terpenoidquinone biosynthesis pathway. Unlike many differentially expressed pathways, this pathway was found to be upregulated when all clones were considered together. Yet, in the separate analysis of Northern and Southern genotypes, this pathway was found to be down-regulated in Northern, but not in Southern genotypes through differential expression of a different enzyme. This observation seems to indicate that during acclimation to high temperature Daphnia regulate the terpenoid biosynthesis pathway in a complex way. Both reactions with detected differential expression feed into the sesquiterpenoid biosynthesis pathway leading to methyl farnesoate hormone – a signal molecule known to induce male production [39] as well as regulating the production of haemoglobin in Daphnia [25,40]. How this rearrangement of the terpenoid biosynthesis pathway may finetune methyl farnesoate is unknown, but it is quite possible that such a rearrangement may play an important role in temperature dependent haemoglobin expression regulation and the reproductive switch to male production. A recent study [8] of adaptation and plasticity of gene expression in response to alcohol stress in Drosophila reported canalization of gene expression for practically all instances of significant GxE interactions. In contrast, in this study we found approximately equal number of significant T*geo interactions in which the “evolved” (heat-tolerant) genotypes had stronger transcriptional plasticity than the “naïve” (heat-sensitive) genotypes and vise versa. We have previously noted gene specific variation in the pattern of expansion and reduction in the plasticity of gene regulation in the context of pigmentation genes in Daphnia [2]. In our current study it
Page 8 of 12
appears that temperature-specific differential expression in Daphnia may be evolving through both canalization of plasticity and through an adaptive increase of plasticity. It should be noted that it may be hard to detect enhanced plasticity in selected phenotypes because of the ‘Fry conjecture’: selected genotypes are better at handling stress, thus the “internal” stress indicators may not be sufficient to induce expression changes, thus creating a false indication of canalization. This conjecture was proposed by J. Fry to explain lower transcriptional responses to ethanol exposure in ethanol-selected populations than in the controls [8]: ethanol-tolerant genotypes have a higher ethanol-detoxifying ability and thus experience lower internal concentration of ethanol and acetaldehyde, resulting in weaker transcriptional response in other genes. While plausible for xenobiotic stressors (such as alcohol), this mechanism can also work for temperature: certainly heat-tolerant genotypes experience the same temperature, but they may experience a milder level of any downstream parameters (oxygen concentration in tissues, degree of oxidative damage etc.) that may act as transcriptional triggers than the heat-sensitive genotypes. Thus, the question about canalization vs. expansion of plasticity in response to selection will remain not fully resolved until specific trigger mechanisms measurable in ancestral and evolved genotypes can be identified. In our genome-wide analysis, the samples clearly form four separate clouds in the space of the first three principal components. These four clouds correspond to the two temperatures and two geographic origins (North vs. South), with a few exceptions (Figure 4A). The separation of points corresponding to the two temperatures appears to be stronger in the Southern (tolerant) than in the Northern (sensitive) clones, suggesting overall expanded expression plasticity, i.e., Baldwin effect. One of the genotypes (C) stands out by having three of its biological replicates located in the “wrong” (Southern) cloud. Barring a possibility of mislabeling (unlikely, as only PC2 is affected), this placement may indicate that there are two distinct syndromes, or patterns of gene expression, one typical for the two southern clones and the other typical for the two northern clones, with some clones switching between the two modes haphazardly, with no relation to current temperature. With this single exception, genotype-specific points (biological replicates) cluster together and the arrows connecting 18°C and 28°C centroids are remarkably parallel. In contrast, the summary 18-28°C arrows representing acclimation and the black-and-white arrows representing divergence and possible prior local adaptation (Northern vs. Southern) are not parallel, particularly on the plane of the first two principal components, indicating that selection operating on gene expression in nature may be orthogonal to the plastic response observed during acclimation. One
Yampolsky et al. BMC Genomics 2014, 15:859 http://www.biomedcentral.com/1471-2164/15/859
Page 9 of 12
possible explanation of for this is that the plastic genes, due to their plasticity, are shielded from the natural selection operating on the adaptation to elevated temperatures.
Conclusion Numerous metabolic and regulatory pathways are regulated during long-term acclimation to high temperature in D. pulex. More genes are down-regulated than upregulated and this effect is stronger in the two Southern, heat tolerant genotypes than in the two Northern, heat sensitive genotypes, suggesting metabolic compensation as a possible acclimation mechanism. Widespread downregulation of gene expression and DNA repair pathways may represent a “last-resort” survival tactic in organisms facing a trade-off between long-term and short-term survival. Finally, there was a mixture of genes showing reduced plasticity (i.e., canalization) of gene expression in response to temperature and genes that exhibit increased plasticity.
containing COMBO water medium [41] under a 12 L:12D photoperiod. It is worth mentioning that the 28°C treatment is not lethal. While this temperature is detrimental to survival it still allows continuous maintainance and reproduction of organisms allowing for multigenerational acclimation. Food in the form of Scenedesmus acutus culture was added daily to the final concentration of 200,000 cells/ml. The medium was replaced and neonates removed twice weekly. To establish the experimental generation, 20–30 second or third clutch offspring of the secondgeneration females were collected within 48 hours of birth and placed in bottles containing 150 ml of COMBO medium. These third generation individuals were screened after reaching the age of 12–15 days and females with early development stage clutches (round uniformly dark eggs with smooth edges; 0.2) the mean squares (MS) associated with it were pooled
Page 10 of 12
together with the residual MS and the T effect was tested against the pooled MS [47]. To test for the differential expression present within the N and S clones separately, the MS associated with the T effect were tested against the T*clone interaction within each geographic region. As before, non-significant T*clone MS were pooled with the error MS. Alternatively, paired t-tests were used to compare expression levels in both clones at one temperature to those at the other (equivalent to pooling both the clone MS and the interaction MS with the error MS). The results were remarkably similar; t-tests results are not reported, as they are less conservative. In all cases the results were screened by the False Discovery Rate correction for multiple testing [33]. Lists of differentially expressed genes, in the form of their clusters of orthologous groups (KOG) IDs [34] were submitted to the iPATH web server [48] to generate maps of metabolic and regulatory pathways affected by the differential expression. Fisher’s exact test was used to determine whether a particular pathway was overrepresented among the differentially expressed genes (with the number of non-differentially expressed genes implicated in the given pathway, among total number of non-differentially expressed genes in the dataset as the reference). All analyses were conducted using JMP 9.0 and JMP Genomics 3.0 (SAS Institute, Gary, NC, USA). Availability of supporting data
The data set(s) supporting the results of this article are available as the Additional file 1 included with the article (the list of genes with at least one test significant (FDR < 0.05), including expression data and annotations); expression data are available at GEO (http://www.ncbi. nlm.nih.gov/geo; Accession number GSE53692); gene annotations can be downloaded from wfleabase.org.
Additional file Additional file 1: Expression data and genomic annotation for genes with at least one significant test. Complete data in http://www. ncbi.nlm.nih.gov/geo/query/acc.cgi?acc=GSE53692. Columns: 1 - Gene ID; 2-25 - expression data (log2 transformed); 26-44 - genomic annotation; 45-57 Data analysis (See Header tab for details).
Abbreviations GxE: Genotype by environment; KOG: (Eukaryotic) clusters of Orthologous Groups; FDR: False Discovery Rate; N: North; S: South; PC: Principal component; E: Expression level; T: Temperature; Geo: Geographic origin; E: Error; MS: Mean squeares; HSP: Heat shock proteins.
Competing interests The authors declare that they have no competing interests.
Yampolsky et al. BMC Genomics 2014, 15:859 http://www.biomedcentral.com/1471-2164/15/859
Authors’ contributions LYY, MEP and JKC designed the study; LYY, PJW and KBD carried out acclimation experiments and RNA extractions, JL carried out microarray work; EZ, LYY and MEP carried out data analysis; LYY, MEP and JKC wrote the manuscript. All authors read and approved the final manuscript. Authors’ information LYY, MEP, and JKC are faculty at, respectively, ETSU, U. of Note Dame and U. of Birmingham; JL is a Laboratory Program Manager at ND, EZ was a Managing Director of the Genomics & Bioinformatics Core Facility at ND and is currently faculty at the University of South Dakota; PJW and KBD were, at the time the study was conducted, a master and an undergraduate student, respectively, at ETSU; currently they are, respectively, a lecturer at Lenoir-Rhyne University and a medical student at ETSU Quillen College of Medicine. Acknowledgements We are grateful to Dieter Ebert and Michael Lynch for helpful discussion of our results. This work was supported by NSF1136706 to LYY, and NIH R24-GM078274 to MEP. Author details 1 Department of Biological Sciences, East Tennessee State University, Johnson City, TN 37641, USA. 2Department of Computer Science and Engineering, University of Notre Dame, Notre Dame, IN 46556, USA. 3Present address: Department of Biology and Department of Computer Science, University of South Dakota, Vermillion, SD 57069, USA. 4Department of Biological Sciences and Environmental Change Initiative, University of Notre Dame, Notre Dame, IN 46556, USA. 5Present address: School of Natural Sciences Lenoir-Rhyne University, Hickory, NC 28603, USA. 6Environmental Genomics Group, School of Biosciences, University of Birmingham, Birmingham, UK.
Page 11 of 12
14.
15. 16.
17.
18.
19.
20. 21. 22.
23.
24. Received: 3 July 2014 Accepted: 23 September 2014 Published: 4 October 2014 25. References 1. Ghalambor CK, McKay JK, Carroll SP, Reznick DN: Adaptive versus non-adaptive phenotypic plasticity and the potential for contemporary adaptation in new environments. Functional Ecology 2007, 21:394–407. doi.wiley.com/10.1111/j.1365-2435.2007.01283.x. 2. Scoville AG, Pfrender ME: Phenotypic plasticity facilitates recurrent rapid adaptation to introduced predators. Proc Natl Acad Sci U S A 2010, 107:4260–4263. 3. Hansen MM, Olivieri I, Waller DM, Nielsen EE: Monitoring adaptive genetic responses to environmental change. Mol Ecol 2012, 21:1311–1329. 4. Pavey SA, Bernatchez L, Aubin-Horth N, Landry CR: What is needed for next-generation ecological and evolutionary genomics? Trends Ecol Evol 2012, 27:673–678. 5. Aubin-Horth N, Renn SCP: Genomic reaction norms: using integrative biology to understand molecular mechanisms of phenotypic plasticity. Mol Ecol 2009, 18:3763–3780. 6. Hodgins-Davis A, Townsend JP: Evolving gene expression: from G to E to GxE. Trends Ecol Evol 2009, 24:649–658. 7. Wilson R, Franklin C: Testing the beneficial acclimation hypothesis. Trends Ecol Evol 2002, 17:66–70. 8. Yampolsky LY, Glazko GV, Fry JD: Evolution of gene expression and expression plasticity in long-term experimental populations of Drosophila melanogaster maintained under constant and variable ethanol stress. Mol Ecol 2012, 21:4287–4299. 9. Levine MT, Eckert ML, Begun DJ: Whole-genome expression plasticity across tropical and temperate Drosophila melanogaster populations from Eastern Australia. Mol Biol Evol 2011, 28:249–256. 10. Latta LC, Weider LJ, Colbourne JK, Pfrender ME: The evolution of salinity tolerance in Daphnia: a functional genomics approach. Ecol Lett 2012, 15:794–802. 11. Whitehead A, Crawford DL: Neutral and adaptive variation in gene expression. Proc Natl Acad Sci U S A 2006, 103:5425–5430. 12. Bukau B, Horwich AL: The Hsp70 and Hsp60 chaperone machines. Cell 1998, 92:351–366. 13. Schoville SD, Barreto FS, Moy GW, Wolff A, Burton RS: Investigating the molecular basis of local adaptation to thermal stress: population
26. 27. 28. 29.
30.
31.
32.
33. 34.
35.
36.
37.
differences in gene expression across the transcriptome of the copepod Tigriopus californicus. BMC Evol Biol 2012, 12:170. Rosic NN, Pernice M, Dunn S, Dove S, Hoegh-Guldberg O: Differential regulation by heat stress of novel cytochrome P450 genes from the dinoflagellate symbionts of reef-building corals. Appl Environ Microbiol 2010, 76:2823–2829. Kang J, Kim J, Choi K-W: Novel cytochrome P450, cyp6a17, is required for temperature preference behavior in Drosophila. PLoS One 2011, 6:e29800. Hazel JR, Williams EE: The role of alterations in membrane lipid composition in enabling physiological adaptation of organisms to their physical environment. Prog Lipid Res 1990, 29:167–227. Van Dooremalen C, Koekkoek J, Ellers J: Temperature-induced plasticity in membrane and storage lipid composition: thermal reaction norms across five different temperatures. J Insect Physiol 2011, 57:285–291. Hochachka PW: Organization of metabolism during temperature compensation. In Molecular Mechanisms of Temperature Adaptation. Edited by Prosser CL. Washington, DC: AAAS; 1967:177–203. Pörtner HO: Climate variations and the physiological basis of temperature dependent biogeography: systemic to molecular hierarchy of thermal tolerance in animals. Comp Biochem Physiol 2002, 132A:739–761. Pörtner HO, Knust R: Climate change affects marine fishes through the oxygen limitation of thermal tolerance. Science 2007, 315:95–97. Pirow R, Bäumer C, Paul RJ: Benefits of haemoglobin in the cladoceran crustacean Daphnia magna. J Exp Biol 2001, 204:3425–3441. Seidl MD, Pirow R, Paul RJ: Acclimation of the microcrustacean Daphnia magna to warm temperatures is dependent on haemoglobin expression. J Thermal Biol 2005, 30:532–544. Wittmann AC, Schroeer M, Bock C, Steeger HU, Paul RJ, Pörtner HO: Indicators of oxygen- and capacity-limited thermal tolerance in the lugworm Arenicola marina. Climate Res 2008, 37:227–240. Beers JM, Sidell BD: Thermal tolerance of Antarctic notothenioid fishes correlates with level of circulating haemoglobin. Physiol Biochem Zool 2011, 84:353–362. Rider CV, Gorr TA, Olmstead AW, Wasilak BA, LeBlanc GA: Stress signaling: coregulation of hemoglobin and male sex determination through a terpenoid signaling pathway in a crustacean. J Exp Biol 2005, 208:15–23. Bullock TH: Compensation for temperature in the metabolism and activity of poikilotherms. Biol Rev 1955, 30:311–342. Somero GN, Hochachka PW: Biochemical adaptation to the environment. Amer Zool 1971, 11:157–165. Hochachka PW, Somero GN: Biochemical Adaptation. Oxford - New York: Oxford University Press; 2002. Somero GN: Adaptation of enzymes to temperature: searching for basic “strategies”. Comp Biochem Physiol B Biochem Mol Biol 2004, 139:321–333. doi:10.1016/j.cbpc.2004.05.003. Causton HC, Ren B, Koh SS, Harbison CT, Kanin E, Jennings EG, Lee TI, True HL, Lander ES, Young RA: Remodeling of yeast genome expression in response to environmental changes. Mol Biol Cell 2001, 12:323–337. Crispo E: The Baldwin effect and genetic assimilation: revisiting two mechanisms of evolutionary change mediated by phenotypic plasticity. Evolution 2007, 61:2469–2479. Lande R: Adaptation to an extraordinary environment by evolution of phenotypic plasticity and genetic assimilation. J Evol Biol 2009, 22:1435–1446. Benjamini Y, Yekutieli D: The control of the false discovery rate in multiple testing under dependency. Ann Stat 2001, 29:1165–1188. Tatusov RL, Fedorova ND, Jackson JD, Jacobs AR, Kiryutin B, Koonin EV, Krylov DM, Mazumder R, Mekhedov SL, Nikolskaya AN, Rao BS, Smirnov S, Sverdlov AV, Vasudevan S, Wolf YI, Yin JJ, Natale DA: The COG database: an updated version includes eukaryotes. BMC Bioinformatics 2003, 4:41. Crease TM, Lynch M, Spitze K: Hierarchical analysis of population genetic variation in nuclear and mitochondrial genes in Daphnia. Mol Biol Evol 1990, 7:444–458. Williams PJ, Dick KB, Yampolsky LY: Heat tolerance, temperature acclimation, acute oxidative damage and canalization of haemoglobin expression in Daphnia. Evol Ecol 2011, 26:591–609. Yampolsky LY, Schaer TMM, Ebert D: Adaptive phenotypic plasticity and local adaptation for temperature tolerance in freshwater zooplankton. Proc Royal Soc Biol Sci 2014, 281:20132744. doi:10.1098/rspb.2013.2744.
Yampolsky et al. BMC Genomics 2014, 15:859 http://www.biomedcentral.com/1471-2164/15/859
Page 12 of 12
38. Connelly SJ, Moeller RE, Sanchez G, Mitchell DL: Temperature effects on survival and DNA repair in four freshwater cladoceran Daphnia species exposed to UV radiation. Photochem Photobiol 2009, 85:144–152. doi:10.1111/j.1751-1097.2008.00408.x. 39. Olmstead AW, Leblanc GA: Juvenoid hormone methyl farnesoate is a sex determinant in the crustacean Daphnia magna. J Exper Zool 2002, 293:736–739. 40. Gorr TA, Cahn JD, Yamagata H, Bunn HF: Hypoxia-induced synthesis of hemoglobin in the crustacean Daphnia magna is hypoxia-inducible factor-dependent. J Biol Chem 2004, 279:36038–36047. doi:10.1074/jbc. M403981200. 41. Kilham SS, Kreeger DA, Lynn SG, Goulden CE, Herrera L: COMBO: a defined freshwater culture medium for algae and zooplankton. Hydrobiologia 1998, 377:147–159. 42. Colbourne JK, Pfrender ME, Gilbert D, Thomas WK, Tucker A, Oakley TH, Tokishita S, Aerts A, Arnold GJ, Basu MK, Bauer DJ, Caceres CE, Carmel L, Casola C, Choi JH, Detter JC, Dong QF, Dusheyko S, Eads BD, Frohlich T, Geiler-Samerotte KA, Gerlach D, Hatcher P, Jogdeo S, Krijgsveld J, Kriventseva EV, Kultz D, Laforsch C, Lindquist E, Lopez J, et al: The ecoresponsive genome of Daphnia pulex. Science 2011, 331:555–561. doi:10.1126/science.1197761. 43. Gentleman RC, Carey VJ, Bates DM, Bolstad B, Dettling M, Dudoit S, Ellis B, Gautier L, Ge Y, Gentry J, Hornik K, Hothorn T, Huber W, Iacus S, Irizarry R, Leisch F, Li C, Maechler M, Rossini AJ, Sawitzki G, Smith C, Smyth G, Tierney L, Yang JYH, Zhang JH: Bioconductor: open software development for computational biology and bioinformatics. Genome Biol 2004, 5:R80. doi:10.1186/gb-2004-5-10-r80. 44. Bolstad BM, Irizarry RA, Astrand M, Speed TP: A comparison of normalization methods for high density oligonucleotide array data based on bias and variance. Bioinformatics 2003, 19:185–193. 45. Wettenhall JM, Smyth GK: limmaGUI: A graphical user interface for linear modeling of microarray data. Bioinformatics 2004, 20:3705–3706. 46. Kendziorski CM, Newton MA, Lan H, Gould MN: On parametric empirical Bayes methods for comparing multiple groups using replicated gene expression profiles. Stat Med 2003, 22:3899–3914. doi:10.1002/sim.1548. 47. Zar J: Biostatistical Analysis. Upper Saddle River, New Jersey, USA: Prentice Hall; 1999. 48. Yamada T, Letunic I, Okuda S, Kanehisa M, Bork P: iPath2.0: interactive pathway explorer. Nucleic Acids Res 2011, 39:W412–W425. doi:10.1186/1471-2164-15-859 Cite this article as: Yampolsky et al.: Functional genomics of acclimation and adaptation in response to thermal stress in Daphnia. BMC Genomics 2014 15:859.
Submit your next manuscript to BioMed Central and take full advantage of: • Convenient online submission • Thorough peer review • No space constraints or color figure charges • Immediate publication on acceptance • Inclusion in PubMed, CAS, Scopus and Google Scholar • Research which is freely available for redistribution Submit your manuscript at www.biomedcentral.com/submit