GOPPAR â Gross Operating Profit Per Available Room. ...... Piccoli, Carroll, & Hall (2011) created a model to evaluate the electronic maturity ...... Langdell (2013).
Functional prototype of a performance management system for hospitality
Nuno Miguel da Conceição António
Project developed to obtain the Master degree in hospitality administration and management
Project executed under the supervision of Prof. Francisco Serra, PhD
2014
Functional prototype of a performance management system for hospitality
Nuno Miguel da Conceição António
Project developed to obtain the Master degree in hospitality administration and management
Project executed under the supervision of Prof. Francisco Serra, PhD
2014
Functional prototype of a performance management system for hospitality STATEMENT OF AUTHORSHIP DECLARAÇÃO DE AUTORIA DE TRABALHO I declare that I am the author of this work, which is original and unpublished. Authors and works consulted are properly cited in the text and listed in the included list of references. Declaro ser o autor deste trabalho, que é original e inédito. Autores e trabalhos consultados são devidamente citados no texto e constam da listagem de referências incluídas.
_______________________________ Copyright Nuno Miguel da Conceição António. The University of the Algarve has the right to perpetually and without geographic boundaries, archive and publicize this work through copies reproduced on paper or any digital form, or by any known or to be invented medium, to release through scientific repositories and admit its copy and distribution for noncommercial, educational or research purposes, as long as credit is given to the author and the editor. A Universidade do Algarve tem o direito, perpétuo e sem limites geográficos, de arquivar e publicitar este trabalho através de exemplares impressos reproduzidos em papel ou de forma digital, ou por qualquer outro meio conhecido ou que venha a ser inventado, de o divulgar através de repositórios científicos e de admitir a sua cópia e distribuição com objetivos educacionais ou de investigação, não comerciais, desde que seja dado crédito ao autor e editor.
ACKNOWLEDGMENTS Although this is considered an individual work, due to its scope, extent and nature, without the contribution and the help of other persons I wouldn’t have been able to do it. Therefore, it’s indispensable that I thank them all for their support. First of all, I would like to thank my supervisor, Professor Francisco Serra. Without his deep knowledge and expertise in hospitality, performance management, strategic management and technological background, complemented by his practical experience in the implementation of performance management systems I wouldn’t have been able to learn and put so much in practice, in such short of time. Moreover, despite the time restrictions required by his duties, his availability for meetings and conferences, for quickly revising documents and for pointing out guidelines proved to be crucial factors that allowed me to take this work to its end. I am sure that without his contribution, it would have been impossible to execute it, at least along similar lines. In academic terms, I would like to thank also Professor Carlos Afonso who, together with Professor Francisco Serra, not only brought Data Analytics to my attention, but also introduced me to the existence of the Data Analyses course in Coursera.org (that I ended up completing to gain more knowledge for my research) and to the existence of the Design Science Research Methodology, which ended up being very important in the development of this work. My last academic acknowledgment is to the ESGHT – Higher School of Management, Hospitality and Tourism of the University of the Algarve, for the preparation classes and for the provision of various means of research, without which, it wouldn’t have been possible to execute this work. Another special educational acknowledge is due to The Data Warehousing Institute (TDWI), the recognized world leader in education and research in the business intelligence, data warehousing, and analytics industry, for granting me a scholarship for their World Conference (held in Las Vegas, USA - February 2014), which allowed me to have training in business intelligence and performance management and also obtain a certification in Business Analytics. What I learned there helped me significantly in the project development. I
But this work wouldn’t have been possible without the hotels’ engagement. Unfortunately, to maintain the hotels unidentified and not reveal any confidential information, I am not able to mention the hotel’s names and the persons involved. Nevertheless, I would like to thank all of them. Not only the administrators and general managers who believed in the project and agreed to participate and give access to their information, but also to all team members, that even in the peak season took time to be available for project meetings, to answer questions and take notes on issues that they thought could be helpful for the project. To Michael Kessler from ReviewPro and to Vibhu Bansal from Itsys a special thank you for understanding the academic nature of the project and enabling me to have special conditions to access to their companies data sources API’s. Another special “thank you” to Edgar Santos for taking the time to explain me the Primavera ERP database structure and also to Mr. António Borralho, who also took some time to explain me the relations between the Portuguese SNC accounting system, USALI and the Primavera ERP. I would also like to thank also my colleagues at Wareguest. Ruben Duarte for developing the project logo, Carlos Leote for his advices in web programming and Nelson Russa for allowing me to use his C# wrapper for the Highcharts javascript library, as well as helping me solving programming issues when I tried to expand his wrapper. Ana Oliveira, Zélia Freitas, Paulo Lopes and Nuno Pereira for taking their own time to execute the project’s heuristic evaluation. However, a special mention is due to my colleague Carlos Soares, not only for executing the heuristic evaluation, but also for helping me shape the project concept and together with Mr. Carlos Alexandre making it possible for Wareguest to fund my travel expenses to the TDWI conference, the data center usage and the costs to access the Reviewpro and Itsys API’s. A big “thank you” to Rita Soares and Peter Bolton, who despite being “recruited” at the last minute, managed to find time to review the final document. Another “thank you” is due to my companions of the board of PORTISUB – Clube Subaquático de Portimão, for their understanding and availability during this last year to execute the tasks that were assigned to me. II
I would like to thank also my family and friends for supporting me and understanding my absence during this last year. Last, but never the least, I would like to thank my wife Sofia. Without her comprehension, support and encouragement none of this would be possible.
III
ABSTRACT This project involved the creation and real-life evaluation in four hotels, of a functional prototype of a performance management system specific for the hospitality industry, with the objective of testing the viability to develop a commercial service. This system can be defined as a set of dashboards that enable the systematic monitoring of business information (goals, metrics and indicators - constructed from multiple data sources) that facilitate management decision-making. To assert its viability, a three point evaluation criteria was established: (1) that there were no technical obstacles that could limit the system’s scope or performance; (2) that users would identify the benefits of using the system; and (3) that quantifiable improvements could achieved. The system was designed based on distributing computing and agent architecture and its development followed the Design Science Research methodology, which also demonstrated its suitability for management research projects. With the prototype’s development and its use by four hotels, it was possible to confirm that no technical aspects would condition the commercial viability of the system. The same can be said about the users’ perception of the system’s benefits, as they identified a long list of benefits and situations where the system could be used with better results than traditional decision making routines. Although it was possible to verify that three of the participating hotels improved their operational indicators when compared to the previous year, due to calendar constraints and the inexistence of benchmarking data sets it was not possible to produce evidence that those performance improvements could be attributed to the use of the system. Globally, these results - complemented by the request of all the participating hotels to continue to use the prototype and their willingness to pay in the future for a commercial service that provided the same information as the prototype - confirmed it’s viability and commercial relevance.
IV
Keywords: dashboard, performance management, business intelligence, hospitality, data analytics.
V
RESUMO Este projeto envolveu a criação de um protótipo funcional de um sistema de gestão do desempenho empresarial, especifico para a indústria hoteleira. Este sistema pode ser definido como um conjunto de painéis de bordo que possibilita a monitorização sistemática da informação empresarial, o qual permite traduzir a estratégia da organização em objetivos, métricas e indicadores adaptados a todos os departamentos e colaboradores, facilitando o apoio à decisão, otimização de processos e um maior nível de proatividade. O objetivo de criação deste protótipo foi o de testar a viabilidade de desenvolvimento de uma versão comercial de um serviço a ser distribuído sob a forma de Software as a Service (SaaS), uma vez que como demonstrado na pesquisa bibliográfica, não existe um sistema semelhante. Para responder ao objetivo do projeto foram definidos três critérios de avaliação: (1) a existência obstáculos técnicos que pudessem limitar o âmbito ou o desempenho do sistema; (2) a identificação de benefícios pelos utilizadores; e (3) a constatação de melhorias quantificáveis resultantes da utilização do sistema. O desenvolvimento do projeto foi precedido de uma exaustiva pesquisa bibliográfica, não só nos tópicos da gestão do desempenho a nível generalista e da sua aplicação na hotelaria, mas também nos tópicos em que os sistemas de gestão desempenho empresarial têm que estar assentes, como: Business Intelligence, Data Analytics, painéis de bordo e visualização de dados. De modo a responder adequadamente aos requisitos que um sistema a ser distribuído no formato SaaS deve ter, nomeadamente os requisitos de resiliência e escalabilidade, a arquitetura do sistema foi desenhada no âmbito da computação distribuída e de agentes resilientes. Essa arquitetura foi concebida em três camadas, cada
uma
composta
por
um
conjunto
de
vários
componentes
(serviços/aplicações/agentes): •
Fontes de dados: o Do hotel: §
Sistema de gestão de reservas (PMS); VI
§
Sistema de gestão financeira/contabilidade (ERP).
o Externas: §
Meteorologia;
§
Reputação social;
§
Preços e disponibilidades em venda on-line.
o De introdução manual:
•
§
Procura e oferta do mercado – entidades oficiais;
§
Oferta do mercado – STR;
§
Orçamentos e objetivos.
Data center: o Web services: §
Serviço para recepção de dados de PMS;
§
Serviço para recepção de dados de ERP.
o Aplicações: §
Orquestrador
dos
agentes
de
leitura,
transformação
e
carregamento de fontes de dados, também conhecido como Extract, Transform and Load (ETL); §
Agente ETL de dados meteorologia;
§
Agente ETL de dados de reputação social;
§
Agente ETL de dados de preços e disponibilidade em venda online.
o Bases de dados: §
Base de dados transacional onde são arquivados todos os dados gerais do sistema e geridas as filas de tarefas, bem como os dados lidos das várias fontes e os respectivos metadados;
•
§
Base de dados transacional por unidade hoteleira;
§
Base de dados dimensional por unidade hoteleira.
Visualização de dados: o Portal: §
Painéis de bordo;
§
Scorecards;
§
Pivot tables.
VII
Para aferir a viabilidade do protótipo do sistema, o mesmo foi disponibilizado a quatro hotéis da região algarvia, com características comuns, mas com modos de operação distintos, onde esteve em funcionamento pleno e avaliação, durante os meses de Julho e Agosto de 2014. Contudo, os hotéis estiveram envolvidos no projeto quase desde o seu início, pois o desenvolvimento do mesmo foi baseado na metodologia Design Science Research (traduzida para Português por alguns autores como “Ciência do projeto”) - uma metodologia relativamente recente e com cada vez mais defensores, inclusivamente nas disciplinas de gestão. Esta metodologia tem como paradigma o desenvolvimento de soluções para problemas práticos e portanto, de utilidade comprovável. Deste modo, os hotéis contribuíram ativamente para a sua elaboração, tendo o seu feedback sido utilizado ao longo das várias interações de desenvolvimento, demonstração e avaliação, para melhor adequar o sistema às suas necessidades e a definir a prioridade de implementação dos diversos requisitos. Apesar da limitação do calendário escolar e do tempo de desenvolvimento do protótipo ser previsivelmente longo, o que limitou o período de tempo de avaliação do protótipo nos hotéis, este acabou por revelar resultados bastante positivos, confirmando inequivocamente a viabilidade de criação do sistema enquanto serviço comercial, se tivesse sido esse o objetivo da sua implementação. Dos pontos de vista técnico e da percepção dos utilizadores sobre os benefícios do sistema, os excelentes resultados não deixam qualquer dúvida sobre a pertinência do mesmo. Do ponto de vista da quantificação da melhoria do desempenho dos hotéis, foi possível constatar que as 3 unidades hoteleiras apresentaram melhorias consideráveis no desempenho dos seus principais indicadores operacionais face ao mesmo período no ano anterior. Contudo, devido a vários fatores como o curto período de tempo que o sistema esteve em avaliação nos hotéis, o período de avaliação ter decorrido na chamada “época alta” e a inexistência de dados de benchmarking oficiais à data de elaboração deste documento, não permitem afirmar inequivocamente que o sistema contribuiu para a melhoria do desempenho nos hotéis.
VIII
Tecnologicamente, a ausência de problemas encontrados ao nível da extração dos dados primários existentes nas diversas aplicações dos hotéis participantes (adequação, precisão, confiabilidade e atualidade) e o desempenho das várias componentes de hardware e software mostraram um elevado grau de performance e fiabilidade. Também o facto de os utilizadores identificarem benefícios que obtiveram pela utilização do sistema, tais como melhoria dos preços médios praticados a partir das informações fornecidas pelas análises de reputação social e comparação de preços publicados na internet, demonstra que o mesmo constitui uma mais-valia importante para os processos de decisão. Todos concordaram que poderão tirar ainda melhor partido do sistema, através do uso das suas componentes analíticas para realizar melhor planeamento, orçamentos e planos de marketing, ou seja, tomar decisões com base em informação e conhecimento e não com base na intuição, que é justamente, um dos propósitos deste tipo de sistemas. Por tudo isto, e até por todos os hotéis participantes terem pedido para continuar a utilizar o sistema após o período de avaliação, e também por terem revelado receptividade em adquirir o mesmo na eventualidade de este ser disponibilizado como um serviço pago, deu-se como alcançado o objetivo de comprovar a viabilidade de desenvolvimento de um serviço comercial baseado no protótipo testado. Complementarmente, o desenvolvimento deste projeto permitiu ainda comprovar a adequabilidade da metodologia Design Science Research à investigação em gestão, ao demonstrar que o desenvolvimento de um artefacto, neste caso, um protótipo funcional concebido com relevância e rigor, pode resolver um problema até agora não endereçado por outros sistemas de gestão para hotelaria, nomeadamente a integração de dados de várias fontes de modo a servir como ferramenta de apoio à decisão empresarial.
Palavras chave: painel de bordo, desempenho empresarial, hotelaria, business intelligence, data analytics
IX
TABLE OF CONTENTS INTRODUCTION ......................................................................................................... 1 Context ................................................................................................................................................... 2 Scope...................................................................................................................................................... 3 Document structure .............................................................................................................................. 3
2 LITERATURE REVIEW ......................................................................................... 5 2.1. Performance management ......................................................................................................... 5 2.2. Business intelligence ................................................................................................................. 8 2.3. Data Analytics ........................................................................................................................... 13 2.4. Dashboards ............................................................................................................................... 16 2.5. Data visualization ...................................................................................................................... 19 2.6. Performance management in hospitality ................................................................................ 20
3 METHODOLOGY ................................................................................................. 24 3.1 Problem identification and motivation ..................................................................................... 24 3.2 Selection of the methodology ................................................................................................... 25 3.3 Research entry point ................................................................................................................. 28 3.3.1 System concept .................................................................................................................... 28 3.4 Data sources .............................................................................................................................. 29 3.5 Activities sequence ................................................................................................................... 31
4 PROTOTYPE DEVELOPMENT AND TESTING ................................................. 33 4.1 Iteration 1 .................................................................................................................................... 33 4.1.1 Defining the system’s objectives .......................................................................................... 33 4.1.2 Design and development ...................................................................................................... 44 4.1.3 Demonstration ...................................................................................................................... 44 4.1.4 Evaluation ............................................................................................................................. 46
X
4.2 Iteration 2 .................................................................................................................................... 47 4.2.1 Solution objectives definition ................................................................................................ 47 4.2.2 Design and development ...................................................................................................... 48 4.2.3 Visualization layer ................................................................................................................. 50 4.2.4 Demonstration ...................................................................................................................... 53 4.2.5 Evaluation ............................................................................................................................. 58 4.3 Iteration 3 .................................................................................................................................... 59 4.3.1 Solution objectives definition ................................................................................................ 59 4.3.2 Design and development ...................................................................................................... 60 4.3.3 Demonstration ...................................................................................................................... 61 4.3.4 Evaluation ............................................................................................................................. 65 4.4 Iteration 4 .................................................................................................................................... 66 4.4.1 Solution objectives definition ................................................................................................ 66 4.4.2 Design and development ...................................................................................................... 66 4.4.3 Demonstration ...................................................................................................................... 67 4.4.4 Evaluation ............................................................................................................................. 71 4.4.5 Communication ..................................................................................................................... 73
5 RESULTS ............................................................................................................ 74 5.1 Experimental method ................................................................................................................ 74 5.2 Testing ........................................................................................................................................ 74 5.3 Observational method ............................................................................................................... 75 5.3.1 User information logs ............................................................................................................ 79 5.4 Analytical .................................................................................................................................... 83 5.4.1 Server performance .............................................................................................................. 83 5.4.2 Data sources ........................................................................................................................ 84 5.4.3 Security ................................................................................................................................. 85 5.4.4 Heuristic evaluation .............................................................................................................. 85 5.4.5 Hotels performance .............................................................................................................. 86
6 DISCUSSION ....................................................................................................... 87 6.1 Technical perspective ............................................................................................................... 87 6.2 Business perspective ................................................................................................................ 89 6.3 Holistic perspective ................................................................................................................... 91
XI
7 CONCLUSIONS ................................................................................................... 93 7.1 Limitations and recommendations .......................................................................................... 94
BIBLIOGRAPHIC REFERENCES ............................................................................ 97 APPENDIXES .......................................................................................................... 110 APPENDIX I - SUMMARY OF RECENT PUBLICATIONS THAT ADDRESS THE NEED FOR BI/DA APPROACHES IN HOSPITALITY ............................................ 111 APPENDIX II - LIST OF BI/DASHBOARD SYSTEMS/APPLICATIONS ............... 112 APPENDIX III - PROJECT ACTIVITIES GANTT CHART ...................................... 114 APPENDIX IV - LIST OF CHARACTERISTICS A PM SYSTEM SHOULD HAVE . 116 APPENDIX V - SOFTWARE REQUIREMENTS SPECIFICATION ........................ 118 APPENDIX VI - PRESENTATION SLIDES MADE TO HOTELIERS ..................... 144 APPENDIX VII - NON-DISCLOSURE AGREEMENT TEMPLATE ......................... 149 APPENDIX VIII - SYSTEM ARCHITECTURE DIAGRAM – ITERATION 2 ............ 150 APPENDIX IX - LIST OF MEASURES, METRICS AND INDICATORS ................. 151 APPENDIX X - GENERAL FEATURES OF THE WEBSITE .................................. 157 APPENDIX XI - MASTER DATABASE ENTITY RELATIONSHIP DIAGRAM ....... 161 APPENDIX XII - TRANSACTIONAL DATABASES ENTITY RELATIONSHIP DIAGRAM ................................................................................................................ 162 APPENDIX XIII - DIMENSIONAL DATABASES DIAGRAM .................................. 168
XII
APPENDIX XIV - SLIDES OF PRESENTATION MADE TO HOTELIERS ON ITERATION 2 .......................................................................................................... 169 APPENDIX XV - WEATHER – CURRENT/FORECAST PAGE .............................. 175 APPENDIX XVI – WEATHER – DASHBOARD PAGE .......................................... 176 APPENDIX XVII - CI PRICES AND INVENTORIES PAGE .................................... 177 APPENDIX XVIII - CI - SOCIAL REPUTATION PAGE .......................................... 178 APPENDIX XIX - SOCIAL REPUTATION PAGE ................................................... 179 APPENDIX XX - SYSTEM ARCHITECTURE DIAGRAM – ITERATION 3 ............. 180 APPENDIX XXI - PMS – SCORECARD PAGE ...................................................... 181 APPENDIX XXII - PMS – ANALYTICS PAGE ........................................................ 182 APPENDIX XXIII - MARKET – OFFICIAL STATISTICS PAGE ............................. 183 APPENDIX XXIV - MARKET – STR COMPETITIVE SET ...................................... 184 APPENDIX XXV - PERFORMANCE DASHBOARD PAGE (DEFAULT) ............... 185 APPENDIX XXVI - BALANCED SCORECARD PAGE .......................................... 186 APPENDIX XXVII - FINANCIAL RESULTS PAGE ................................................. 187 APPENDIX XXVIII - AD HOC REPORTS PAGE .................................................... 188 APPENDIX XXIX - SSL CERTIFICATE .................................................................. 189 APPENDIX XXX - SERVER SECURITY ASSESSMENT REPORT ....................... 190 APPENDIX XXXI - SCRIPT OF RETROSPECTIVE GROUP INTERVIEW ............ 191
XIII
APPENDIX XXXII – HEURISTIC EVALUATION QUESTIONS .............................. 192
XIV
TABLE OF FIGURES Figure 2.1: PM Process ........................................................................................................................... 7 Figure 2.2: Intelligence hierarchy ............................................................................................................ 9 Figure 2.3: Tools and capabilities of BI ................................................................................................. 10 Figure 2.4: Intelligence hierarchy impact on ROI .................................................................................. 13 Figure 2.5: Number of publications with BI and Analytics terms as keywords ...................................... 14 Figure 2.6: PM Analytics ....................................................................................................................... 15 Figure 2.7: MAD Framework ................................................................................................................. 17 Figure 2.8: Summary of dashboard research paths with implications for design .................................. 19 Figure 2.9: Data science Venn diagram ................................................................................................ 23 Figure 3.1: The DSRM process model .................................................................................................. 28 Figure 3.2: Project activities sequence diagram.................................................................................... 32 Figure 4.1: System concept diagram..................................................................................................... 33 Figure 4.2: A Comparison of dashboard data architecture.................................................................... 35 Figure 4.3: Orchestrator and agents running on the system server ...................................................... 50 Figure 4.4: Relationship among disciplines, fields and practices in ID ................................................. 51 Figure 4.5: Website areas ..................................................................................................................... 52 Figure 4.6: Example of chart drilldown .................................................................................................. 56 Figure 4.7: Bullet chart .......................................................................................................................... 68 Figure 5.1: Logins per hotel, per day..................................................................................................... 79 Figure 5.2: Weighted global visits per page .......................................................................................... 82 Figure 5.3: Weighted global time spent per page.................................................................................. 82
XV
TABLE OF TABLES Table 2.1: Traditional BI vs BI for PM comparison ................................................................................ 12 Table 3.1: DSR Guidelines .................................................................................................................... 27 Table 4.1: The seven characteristics of KPIs ........................................................................................ 36 Table 4.2: Indicators properties taxonomy ............................................................................................ 37 Table 4.3: Indicators taxonomy template .............................................................................................. 38 Table 4.4: Data sources ........................................................................................................................ 40 Table 4.5: List of selected hotels ........................................................................................................... 46 Table 4.6: Bullet chart colors ................................................................................................................. 69 Table 5.1: Absolute number of visits per page/menu option ................................................................. 80 Table 5.2: Weighted number of visits per page/menu option ................................................................ 80 Table 5.3: Absolute time spent (in seconds) per page/menu option ..................................................... 81 Table 5.4: Weighted time spent (in seconds) per page/menu option .................................................... 81 Table 5.5: Databases size ..................................................................................................................... 83 Table 5.6: Common hospitality measures/metrics performance comparison ....................................... 86
XVI
ACRONYMS AND ABREVIATIONS •
ABW – Average Booking Window.
•
ALOS – Average Length of Stay.
•
API – Application Programming Interface.
•
ARR – Average Room Rate.
•
BA – Business Analytics.
•
BI – Business Intelligence.
•
BSC – Balanced Scorecard.
•
CI – Competitive Intelligence.
•
CRM – Customer Relationship Management.
•
DA – Data Analytics.
•
DS – Design Science.
•
DSR – Design Science Research.
•
DSRM – Design Science Research Methodology.
•
DSS – Decision Support System.
•
EBITDA – Earnings Before Interest, Taxes, Depreciation and Amortization.
•
ETL – Extract, Transform and Load.
•
GOP – Gross Operating Profit.
•
GOPPAR – Gross Operating Profit Per Available Room.
•
GRI – Global Review Index.
•
HCI – Human-Computer Interaction.
•
ID – Interaction Design.
•
IIS – Microsoft Internet Information Server.
•
INE – Instituto Nacional de Estatística.
•
IS – Information Systems.
•
IT – Information Technology.
•
LY – Last Year.
•
MTD – Month-To-Date.
•
OE – Operational Excellence.
•
OLAP – Online Analytical Processing.
XVII
•
OTA – Online Travel Agencies.
•
PD – Performance Dashboard.
•
PM – Performance Management.
•
QoS – Quality of Service.
•
RevPAR – Revenue per Available Room.
•
RM – Revenue Management.
•
SaaS – Software as a Service.
•
SNC – Sistema de Normalização Contabilística (Accounting normalization system).
•
SR – Social Reputation.
•
SRS – Software Requirements Specification (document).
•
TP – Turismo de Portugal.
•
TRevPAR – Total Revenue per Available Room.
•
USALI – Uniform Systems of Accounts for the Lodging Industry.
•
WS – Web Services.
•
YTD – Year-To-Date.
XVIII
GLOSSARY •
Big data – collection of data sets that are so large and complex that they require advanced and unique data storage, management, analysis and visualization technologies.
•
Data mart - a departmentalized structure of data feeding from the data warehouse where data is de-normalized based on the department’s/user’s need for information (Inmon, 2002).
•
Data mining - the process of analyzing large amounts of data in search of previously undiscovered business patterns (Inmon, 2002).
•
Data warehouse - a collection of integrated, subject-oriented databases designed to support the decision support system function, where each unit of data is relevant to some moment in time. The data warehouse contains atomic data and lightly summarized data (Inmon, 2002).
•
Json – Javascript Object Notation. Open standard to transmit data objects as human-readable text consisting of attribute-value pairs.
•
Metadata – commonly defined as data about data or data that describes data.
•
RESTful – web services that are in conformity with the Representational State Transfer (REST), an abstraction of the World Wide Web architecture.
•
ROI – Return on Investment. From an economic standpoint can be described as the profit in relation to the invested capital.
•
SOAP – Simple Object Access Protocol. Protocol specification used in the exchanging of structured information in computer networks, mostly used with the use of web services.
•
Web service – software system designed to support interoperability between electronic devices over a network.
•
XML – Extended Markup Language. Markup language that defines a set of rules to encode documents in a format that is both human and machinereadable.
XIX
INTRODUCTION The main objective of this project is to evaluate the viability of developing a commercial service1 of a Performance Management (PM) software system for the hospitality industry, that by using dashboards, presents a broad set of metrics and Key Performance Indicators (KPIs) on the hotel’s performance to all hotel staff, regardless of their hierarchy and department, as a tool to give feedback and enable faster adoption/correction of actions to better align the hotel’s performance with its strategy and goals. To accomplish this objective, since no such system specific for the hospitality industry seems to exist (see Chapter 2), a prototype was built. To assess this viability, the results were evaluated on three perspectives, which could be interpreted as research questions: •
Q1 - Are there any technical issues that can limit the scope and performance of the system itself?
•
Q2 - Does the hotel’s staff identify the benefits of using the system?
•
Q3 - Is it possible to identify quantifiable improvements in the hotels performance?
Although the main objective of this project was the prototype instantiation, its development shouldn’t be considered the only objective. The knowledge, abstracted, representative and generalized (to a degree), obtained from prototyping, was another important objective of the research. As defended by Zheng (2009), prototyping should be considered a vehicle to learn the problem domain, seek a solution and finally create knowledge. Therefore, while trying to answer the project questions, was expectable that other important aspects could also be learned and assessed during the development of the prototype, such as: •
Technical obstacles in accessing proprietary databases;
1
“Service” because as a cloud-based system, it should be available to hotels on the SaaS – Software as a Service model, paid by usage period, rather than a product installed locally on their premises and paid as a one-time-fee only.
1
•
Unavailability of data to produce some of the metrics;
•
Database performance issues;
•
User’s reluctance to use the system or the need for a formal strategic plan.
Context The phrase “If you can’t measure it, you can’t manage it” was attributed to the renowned writer, professor and management consultant, Peter Drucker. However the Institute created with his name2 to foment the transformation of his ideas and legacy into action, have clarified this by saying that this is an incorrect quote (Zak, 2013). In fact, what Drucker (1993) wrote in his book “Management: Tasks, responsibilities, practices” was: “Work implies not only that somebody is supposed to do the job, but also accountability, a deadline, and finally the measurement of results, that is, feedback from results on the work and on the planning process itself”, which is substantially different and has a more holistic approach. It has to be seen as an argument on the field of strategic management and operational excellence, as of the need during the planning process to establish measures for actions as a way to have feedback and improve processes about those actions, and cannot be reduced to the measurement perspective. As identified by Bititci, Mendibil, Nudurupati, Garengo, & Turner (2006), performance measurement systems, through cultural change in organizations, lead to a more participative and consultative management style, which drive continuous improvement and lead to significant performance improvements on the five case studies they reviewed. Similarly conclusions were found by Franco-Santos, Lucianetti, & Bourne (2012). From 76 empirical studies the authors identified that performance measurement systems had a significant impact on people’s behavior, organizational capabilities, and performance. Moreover, they came to the conclusion that performance measurement systems
2
More information available at http://www.druckerinstitute.com.
2
play a key role in strategy, communication and management processes that enable organizations to excel. Scope Although organizations that pursue Operational Excellence (OE) require the development and implementation of a strategy that enables them to implement actions to obtain the desired goals, it’s outside the scope of this work to introduce the subject of OE and how strategic plans should be conceived and communicated to all members of an organization in order for the organization to achieve better performance. This research project, above all, focuses on the requirements and the process of development, implementation and evaluation of a PM system that should be used as a tool, part of an OE program, to provide better results, therefore, it explores mainly the technology and the hotel expertise aspects of the system, other than the strategy required to fully take advantage of it. As a consequence, this project identifies the main characteristics of a PM system and the required technology concepts to implement it, such as dashboards, Business Intelligence (BI) and Data Analytics (DA). It also identifies the areas of expertise in hospitality where the system could have more impact and that should be addressed on the prototype, such as Revenue Management (RM), Social Reputation (SR), common hotel metrics/KPIs, supply/demand analysis, among others. Document structure In addition to this introductory chapter, this document has six other chapters. The document’s structure and its chapters is not similar to would be expected in a Master of Science thesis, because this work was submitted as a project, particularly, as a software development project, not as a regular research thesis. For this reason, the structure, besides the scientific and contextual component of the research, also reflects the software development and implementation component.
3
The other chapters that are part of this document are: •
Chapter 2 – Literature review: introduces the current knowledge on PM systems along with its components of BI, DA, dashboards and data visualization, which are key features of this project. The chapter ends with a description of the state of the art on PM systems in hospitality;
•
Chapter 3 – Methodology: presents the methods used for the definition of system concepts, the metrics and KPIs used in the system, as well as the necessary data to calculate them, and finally, and an overview of the design science research methodology used for the system development process;
•
Chapter 4 – Prototype development and testing: describes the design, elaboration, demonstration and evaluation activities of the different development iterations;
•
Chapter 5 – Results: presents the results obtained from the system usage data, users and experts evaluation as well as overall results;
•
Chapter 6 – Discussion: debates the results presented in the previous chapter;
•
Chapter 7 – Conclusions: presents the conclusions gathered from the results obtained and also some limitations found in the project, as well as some recommendations for future research and development.
Also, there are several appendixes available at the end of the document containing, among other pieces, the full software specifications used as guidelines for the project development. The companion DVD also includes the project source code and databases, as well as links to enable the system evaluation. Due to the multi-disciplinarily scope of this research project, it is recommend that readers are familiarized not only with the field of hospitality management, but also with Information Technology (IT), PM and accounting.
4
2
LITERATURE REVIEW
For a thorough and broad review of literature, as recommend by Webster & Watson (2002) a structured approach was used to determine the source materials and identify the ones relevant to the subject and scope of the project. This approach involved: 1. Search of major journals, scientific databases (Web of Knowledge, Web of Science, Journal Citation Reports, among others) and magazines, amid other scientific sources; 2. Going backward by reviewing the citations found in papers (and other documents) identified during the search. 3. Going forward by finding papers that cited the discovered papers. However, because of the highly technical subject of the project and the speed at which technology changes and progresses, with the objective of obtaining the most recent perspectives about the topics covered, other electronic sources like magazines, blogs, industry conference proceedings, industry reports and additional sources were also surveyed during the period from August 2013 to February 2014. In order to obtain a large number of sources the searches were made in English, Portuguese and Spanish. 2.1.
Performance management
There are some misperceptions about the definition of the term Performance Management (Howson, 2007). Accordingly to Cokins (2009) this is in part due to semantics and language. Often, acronyms like Business Performance Management,
Corporate
Performance
Management
and
Enterprise
Performance Management, are seen on the media, but lately there has been a move to converge all these expressions into Performance Management. In spite of the difficulty in settling for a definition, as explained by Eckerson (2011), today, PM is outlined in a very embracing way as “the combination of processes and technologies that help an organization measure, monitor, and 5
manage its business to optimize performance and achieve goals”. Yet, some authors have a different understanding and differentiate between Performance Management and Performance Measurement. Whereas some argue that Performance Management and Performance Measurement are different disciplines that follow one another in an interactive process (Lebas, 1995), others suggest that the more recent literature shows a clear tendency to merge the bodies of knowledge from the two areas (Folan & Browne, 2005). Traditionally, Performance Measurement was related to systems that were primarily
based
on
information
recollected
from
accounting
systems
(Yigitbasioglu & Velcu, 2012). A turning point occurred when Kaplan & Norton (1992) introduced “The Balanced Scorecard” (BSC) and suggested the use of both financial and non-financial metrics in performance measurement. This became essential to have an holistic performance rating of an organization (Neumann & Cauvin, 2008), which evolved from being a system to measure important metrics to becoming Performance Management, “the process of managing an organization’s strategy” (Cokins, 2009). Eckerson (2011) supports that PM is not about improving an organization performance in general, but it “is about improving performance in the right direction”. The author also refers to the fact PM bridges the gap between strategy and execution, resulting in three major benefits for organizations: 1. Improved communication – using dashboards and scorecards tailored to individual
roles,
executives
can
better
communicate
strategy
and
expectations to managers and staff at all levels; 2. Improved coordination – by fostering collaboration through the exchange of ideas and information between the organizational levels, units and departments; 3. Improved control – using up-to-date information on market conditions and operational processes, the staff can better adjust plans and fix/improve operations in a timely manner. The same author, as depicted in Figure 2.1, suggests a framework that describes the components of PM and how it should work.
6
Figure 2.1: PM Process
Source: Eckerson (2011)
This closed-loop process turns strategy into action in four steps that revolve around integrated data and metrics that provide the vocabulary and means for measuring performance across whole organization. Some authors like Cokins (2009) are already referencing a PM 2.0 as an advance over PM 1.0. The author describes this “new” PM as placing more emphasis on strategy execution. The author declares, “Its purpose is not just better reporting and monitoring dashboard dials, but moving the dials and improving performance”. The author also asserts that additional features of PM 2.0 are analytical tools such as segmentation or statistical correlation analysis, that can be seamlessly embedded within all of the various methodologies to accelerate and improve decision making and risk management. In addition the author also refers to the fact that PM 2.0 is defined by terms like “optimized, unified, integrated, holistic and synchronized” but to achieve this vision organizations have to reduce the myriad of independent and legacy IT systems and build integrated ones, instead.
7
2.2.
Business intelligence
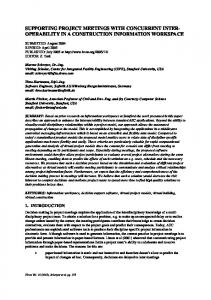
Report and analytical tools are major features of the PM process, since these are the tools that support the strategy’s execution. Although Turban, Sharda, Delen, & King (2010) claim that the term Business Intelligence was only coined in the mid-1990s by the Gartner Group, other authors say the term was created back in 1958 by an IBM engineer who defined it “as the ability to comprehend the interrelationships of presented facts in such a way as to guide action towards a desired goal” (in Garret, 2012). Albeit with the passing of time the various definitions seem to agree on the same principles of what BI is. A commonly accepted definition is the one created by Turban et al. (2010) that describes BI as “an umbrella term that combines architectures, tools, databases, analytical tools, applications, and methodologies”. Other authors, like Liebowitz (2006), prefer the more goal oriented definition of the Knowledge Management and Business Intelligence Workshop (2005) which states that BI is an “active, model-based, and prospective approach to discover and explain hidden, decision-relevant aspects in large amounts of business data to better inform business decision processes”. These definitions are highly related to the definition of PM. Turban et al. (2010) state that PM is an emerging portfolio of applications and methodologies that contains evolving BI architecture in its core. For the authors, PM “extends the monitoring, measuring, and comparing of sales, profit, cost, profitability, and other performance indicators by introducing the concept of management and feedback”. The same authors define the major BI objective as: “To enable interactive access (sometimes in real time) to data, to enable manipulation of data, and to give business managers and analysts the ability to conduct appropriate analysis. By analyzing historical and current data, situations, and performances, decision makers get valuable insights that enable them to make more informed and better decisions. The process of BI is based on the transformation of data to information, then to decisions, and finally to actions”. 8
This transformation of data into actions is very simply illustrated in what Liebowitz (2006) calls the “intelligence hierarchy” as depicted on Figure 2.2. Figure 2.2: Intelligence hierarchy
Data
Information
Knowledge
Expertise
Wisdom
Source: Adapted from Liebowitz (2006)
This transformation is built around four main types of capital from the organization’s intelligence (Liebowitz, 2006): •
Human: knowledge embodied in the organizations employees;
•
Structural: knowledge embedded in the company like databases, property rights, among others;
•
Relationship: social capital learned from customers and stakeholders;
•
Competitive: obtained from knowing what competitors are doing.
A subset of BI that is gaining more importance as time goes by is Competitive Intelligence (CI). With its goal of providing a balanced picture of the environment to decision makers (Sauter, 2010), CI is “involved with developing a systematic program for capturing, analyzing and managing external (and internal) information and knowledge to improve the organization’s decisionmaking capabilities”. This primarily external involvement of CI, brings to BI the capacity of not only focusing on the information available internally, but also on externally available information like competitors performance and market demand to produce better results and provide a wider perspective of the environment. As a result of the need to transform data into actions, taking in account the types of capital and the areas where BI should be used to drive profit impact, a BI system must include tools, capabilities and techniques as portrayed in Figure 2.3. Not all of them are present in every BI system, but the most sophisticated ones include most of them.
9
Figure 2.3: Tools and capabilities of BI
Source: Adapted from Turban, Sharda, Delen, & King (2010)
Because some of these tools, capabilities and techniques are in the core of this project, a more detailed explanation about some of them is due: •
Decision Support Systems (DSS): are computer-based systems that facilitate choices by helping decision makers with the organization of information and modeling of outcomes (Sauter, 2010);
•
Executive Information Systems/Executive Support systems: these systems emerged when analytical capabilities and multidimensional reports, as well as other visualization tools were added to DSS (Turban, Sharda, & Delen, 2011);
•
Data warehouse: a collection of integrated, subject-oriented databases designed to support the DSS function, where each unit of data is relevant at some moment in time. The data warehouse contains atomic data and lightly summarized data (Inmon, 2002). Today, it includes not only historical data, but also current data so that it can provide real-time decision support (Turban et al., 2011);
•
Online Analytical Processing (OLAP): is a multidimensional database management
system
technology
that
enables,
with
very
good
performance, to summarize and aggregate the data available in the data
10
warehouses (Inmon, 2002). It focuses on analyzing and exploring data, whereas query and report tools put more emphasis on accessing data for monitoring purposes (Howson, 2007); •
Extract, Transform and Load (ETL): ETL technologies are instrumental in the process and use of data warehouses. The ETL is an integral component of any data-centric project (Turban et al., 2011). This process consists on the extraction (reading data from different sources), transformation (reviewing the data quality and adapting it to the data warehouse structure according to previously defined rules) and loading (storing the data in the data warehouse);
•
Dashboards: Few (2006), as commonly accepted, described a dashboard as “a visual display of the most important information needed to achieve
one or more objectives; consolidated and arranged on a
single screen so the information can be monitored at a glance”. As the author outlined, the key objective of dashboards is to display information at a glance. Some authors, like Ballard et al. (2005) argue that BI for PM has some differences from “traditional BI”, particularly because BI for PM needs to focus more on operational decision making and therefore needs to be more proactive and timely, supporting a wide range of business users. A comparison between “traditional” and PM-based BI can be seen on Table 2.1.
11
Table 2.1: Traditional BI vs BI for PM comparison
Category
Traditional BI
BI for PM
Implementation
Departmental
Enterprise-wide
Focus
Historical
Timely, right-time or real-time
Decisions
Strategic and tactical
Strategic, tactical and operational
Users
Business analysts
Everyone
Orientation
Reactive
Proactive
Output
Analyses
Recommendations and actions
Process
Open-ended
Closed-loop
Measures
Metrics
Key performance indicators (KPIs) and actionable (in-context) metrics
Views
Generic
Personalized
Visuals
Tables, charts and reports
Dashboards and scorecards
Collaboration
Informal
Built-in
Interaction
Pull (ad hoc queries)
Push (events and alerts)
Analysis
Trends
Exceptions
Data
Structured
Structured and unstructured
Source: Adapted from Ballard et al. (2005) As seen in
Figure 2.4, in the analogy between the human brain and software systems presented by Cokins (2009), transactional systems and BI/PM systems are on a completely different level in terms of the intelligence hierarchy and in terms of the Return On Investment (ROI) they represent to organizations. However, this ROI is only achievable when BI investments are connected to specific business goals, analysis, decisions and actions that result in improved performance (Williams & Williams, 2007).
12
Figure 2.4: Intelligence hierarchy impact on ROI
Source: Cokins (2009)
On the other hand, implementing a BI system requires technology, but that itself isn’t enough, because if business’s processes aren’t adapted to capitalize it, the investment will be counterproductive (Williams & Williams, 2007). But, as these authors say, without BI it is extremely difficult for managers to cope with modern business complexity. If organizations want to innovate, establish competitive advantage and deliver strong profit growth, they have to adopt BI and readjust their business processes. 2.3.
Data Analytics
Data Analytics (DA) similarly to other disciplines, is identified by different names like Business Analytics (BA), Statistical Analysis, Data Mining or simply Analytics (Scarisbrick-Hauser, 2007). DA is a subset of BI (Davenport & Harris, 2007). These authors define DA as “the extensive use of data, statistical and quantitative analysis, explanatory and predictive models, and fact-based management to drive decisions and actions”.
13
DA was introduced in the late 2000’s to represent the key analytical component of BI (Davenport, 2006). Lately, terms like Big Data and Big Data Analytics also started to be used to describe data sets and analytical techniques that are so large and complex that they require advanced and unique data storage, management, analysis and visualization technologies (H. Chen, Chiang, & Storey, 2012). In a 2011 survey, deployed to over 4000 IT professionals, from 93 countries and 25 industries, DA was identified as one of the major technological trends in the 2010’s (H. Chen et al., 2012). In the academic community, BI and DA fields are also getting increased importance. Research on the evolution of the number of publications, conducted on the B-ON Portal3, concerning publications that have as main topics BI, DA and related terms, shows, as detailed in Figure 2.5, that the number of publications with BI as a keyword is the only that is declining (maybe because it’s also the older and more consolidated concept). Contrarily, the number of publications who have DA, Big Data and Business Analytics as keywords (more recent concepts), have increased. Figure 2.5: Number of publications with BI and Analytics terms as keywords
Source: Author’s elaboration 3
B-ON is an online portal that enables scientific institutions in Portugal to search papers, books and other contents in thousands of scientific publications, databases and other sources like Web of Science, Academic Search Complete, British Library Public, Library of Congress, Elsevier, Springer, among others.
14
This increasing importance can be attributed to the need of organizations to become more effective and efficient in their operations (Turban et al., 2011), because high-performance business processes are among the last points of differentiation between organizations. Previous factors such as unique geographical positioning, protective regulation, political uncertainty and commoditization no longer apply. Many industries offer similar products and use comparable technology (Sauter, 2010; Bose, 2009; Davenport & Harris, 2007), consequently, differentiation between them has to be achieved by making better informed, evidence-based decisions through the use of improved predicting tools (Sauter, 2010). Several authors like Schultz (2004) and Schläfke, Silvi, & Möller (2013) have acknowledged the growing importance of DA in PM and its connection to the organization’s strategy. Schläfke et al. (2013) even went further and proposed a framework where they defined the relation between IT-based applications, management/accounting applications and analytical methods (depicted in Figure 2.6 as Performance Management Analytics - “the extensive use of data and analytical methods to understand relevant business dynamics, to effectively control key performance drivers, and to actively increase organizational performance”. Figure 2.6: PM Analytics
Source: Schläfke, Silvi, & Möller (2013)
15
2.4.
Dashboards
Dashboards are the visualization entry point for PM. Dashboards enable staff at all levels of the organization to view all key facts/metrics and start the exploration of the data (Schultz, 2004). Dashboards are the primary vehicle for communicating PM within the organization (Dover, 2004). When used with a powerful analytical engine, dashboards have the potential to get the right information presented to key users at the most valuable time. Besides the previously cited definition by Few (2006) that a dashboard is a way to monitor, at a glance, the most important information needed to achieve one or more objectives, in the context of PM, Eckerson (2011) deepened that definition and concept. He entitled it Performance Dashboards (PD) and expressed it as “a layered information delivery system that parcels out information, insights, and alerts to users on demand so they can measure, monitor, and manage business performance more effectively”. According to Eckerson (2011), PD should be much more than screens populated with impressive graphics. They should be “full-fledged business information systems designed to help organizations optimize performance and achieve strategic objectives”. As a result, the author, states that the terms “PD system” or “PM system” are equivalent and that the two are interchangeable. According to the author, a PM system should have three significant features that he called the “three threes”: •
Three applications – set of functionalities designed to fulfill specific user requirements: o Monitoring: enable users to monitor performance against metrics aligned with the organization’s strategy; o Analysis: enable users to explore data across many dimensions and organizational hierarchies. To allow this, systems must use a variety of technologies, capabilities and methods as the ones associated with DA and BI; o Management: support users to collaborate and foster decisionmaking. 16
•
Three layers – based on the MAD (monitor, analyze and drill to detail) framework that defines how the dashboard should section information in layers (see Figure 2.7): o Graphical, metrics data: provide a graphical view of performance metrics, usually in the form of charts and alerts; o Summarized, dimensional data: dimensional data navigable by users per subject and hierarchy, where users can slice and dice, drill up/down or pivot data to view exceptions and trends from any perspective; o Detailed, transactional data: let users reach the more atomic level of data and analyze the transactional data if that is needed to understand the cause of a problem.
•
Three types – these types emphasize the three applications and three layers: o Operational dashboards: enable front-line staff to manage and control operational processes using detailed data that is refreshed frequently; o Tactical dashboards: enables the monitoring of departmental processes and projects. These are mostly used to monitor and optimize processes; o Strategic dashboards: used to monitor the execution of strategic objectives. Figure 2.7: MAD Framework
Source: Eckerson (2011)
17
Whereas dashboards are typically associated with operational information (Eckerson, 2011; Cokins, 2009), scorecards as introduced in the Balanced Scorecard (Kaplan & Norton, 1992) are more associated with tracking the progress towards achieving goals and reviewing performance (Cokins, 2009). However, in the context of a PM system, Allio (2012) and Eckerson (2011), consider that the term used is not relevant as long as the system helps users and organizations to focus on what matters and therefore, mixing different types of dashboards and concepts is a valid approach to obtain the desired results, even though some contextual examination should be made in the selection of the best solution to adopt in each case (Lorence, 2010a; Cokins, 2009). PM systems can be among the highest ROI solutions an organization can implement, because the benefits they bring allow the organization to unify all of its measures across systems and empower users to do tasks they couldn’t do otherwise (Dover, 2004). However, some authors like Pauwels et al. (2009) argue that there is no research that empirically demonstrates that dashboards improve profits or in the long-term, improve an organization’s performance. Despite this lack of evidence, more recent publications corroborate the advantages of using a PM system by studying practical implementations (A. de Waal & Kourtit, 2013). Implementing a PM system can have several obstacles like assuring data availability, accessibility and accuracy in a timely fashion (Lorence, 2010b). Another obstacle well referenced in the literature is the design itself. An extensive list of literature on this subject can be found in the article “A review of dashboards in performance management: implications for design and research” (Yigitbasioglu & Velcu, 2012). In this article, the authors summarized the research paths (see Figure 2.8) with implications for the dashboard design that should be followed to avoid problems in PM systems implementation.
18
Figure 2.8: Summary of dashboard research paths with implications for design
Source: Yigitbasioglu & Velcu (2012)
2.5.
Data visualization
Another very important characteristic that cannot be overlooked is the visual presentation element (Eckerson, 2011; Caldeira, 2010; Few, 2006). This element should not be taken lightly as it can represent the difference between acceptance or not, of the dashboard by the users. This topic is so important that the previously cited authors have chapters in their books dedicated to it. Other authors have also written comprehensive documentation on the same topic and reinforced its importance and the details that should be applied to the metric’s
19
visual presentation (Hursman, 2013; Juice Analytics, 2009; Rasmussen, Chen, & Bansal, 2009). To comply with this visual presentation characteristic, dashboards resort to the use of graphics and charts, however, as stressed by C. Chen, Härdle, & Unwin (2008) sometimes, graphics and charts can be a very effective way of information communication, but if not correctly used, they can also be very ineffective. Graphical presentation of information started having more projection with the magnificent books of Edward Tufte (C. Chen et al., 2008). In his book “The visual display of quantitative information” (Tufte, 2007) the author makes the definition that “excellence in statistical graphics consists of complex ideas communicated with clarity, precision, and efficiency” and established a set of rules that graphics must comply with, to achieve this excellence. 2.6.
Performance management in hospitality
In a literature review paper related to PM in the service sector, based on 141 peer-reviewed publications from 1981 to early 2008, developed by Yasin & Gomes (2010) the authors concluded that there was still the need for more theoretical and practical application work. From these 141 publications, only 7 were from a hospitality publication, which demonstrates the relative novelty of the subject. Additionally, in another literature review paper about the state of the art in hotel performance (Sainaghi, 2010), from the 152 publications analyzed by the author, only 14 were about Performance Measurement. The small number of publications about real-world use of PM systems in the hospitality industry identified by Yasin & Gomes (2010) seems to continue, since only four articles covering the subject of PM/Performance Measurement were found during the research for this project. Even so, only one of these papers was recent and specific on the topic of PM (Y.-C. Chen, Wang, & Chu, 2011). The other papers were older and more related to the metrics used to measure hotel performance, under the topic of Performance Measurement (Cruz, 2007; Haktanir & Harris, 2005; Harris & Mongiello, 2001) rather than PM.
20
Except for two papers proposing specific frameworks for Performance Measurement (Ivankovič, Janković, & Perišić, 2010; Phillips, 1999) that don’t seem to be relevant for the scope of this work (lacking fundamental pieces technology wise - or limited scope), no other literature on hospitality was found on PM frameworks specific to the industry. Yet, in another literature review paper about the development of information and communication technologies in hospitality (Ip, Leung, & Law, 2011), the authors studied 88 publications from 1999 to 2008 and came to the conclusion that two topics where the subject of 46% of the publications, strategic and operational management and, RM, topics highly related to PM. These fields require systems that embrace BI and DA, which consequently can benefit from the implementation of PM systems. Particularly, RM is a field where a PM system can have great impact. In other travel industries having a system to help automate RM is already considered a mission-critical component for success (Mehrotra & Ruttley, 2006). RM is of a multi-disciplinary nature (Serra, 2013). In its genesis is the need to analyze supply and demand, analyze historic data, analyze completion data, implement strategic and tactical restrictions by customer segments and distribution channels, identify booking-pace, length-of-stay, cancelation/no-show and rate patterns (Serra, 2013; Mehrotra & Ruttley, 2006), which are all data-centric tasks and processes that require inputs from multiple data sources (Serra, 2013) and the capabilities, techniques and technologies in the core of BI and DA. The implementation of mathematical models in DA, the use of better forecasting models that can make use of all available data and new technologies (Chiang, Chen, & Xu, 2007) and the switching from intuition-based pricing decisions to analytics-based pricing (Garrow & Ferguson, 2008) are some of the referenced subjects in RM publications that could lead to effective revenue maximization. Consequently, as RM is having a more central and strategic role in hospitality, it will require better performance measurement techniques (Kimes, 2010).
21
Apart from RM, in other areas of the hospitality industry, BI as a tool of PM has been often cited as having an increasing importance. The use of data mining technology in Customer Relationship Management (CRM) (Danubianu & Hapenciuc, 2008), use of dashboards, real-time (or near) access to operational data, easier and faster identification of trends as well as highly visual data maps, loaded with analytics, filters and alerts (Korte, Ariyachandra, & Frolick, 2013) are topics that the most recent literature points out, towards the future of BI systems as a way to better align strategies to the organization’s objectives. The hospitality industry is becoming a leader in the use of BI, particularly, in the case of major hospitality organizations. They have greatly benefited from BI and IT, even though most of them still have much to gain from BI (Korte et al., 2013). This tendency can be observed in the latest issues of business publications, where hospitality industry professionals and consultants are increasingly addressing the need of the industry to embrace the use of all data at their disposal, dashboards and analytical tools, which are the foundations of BI and PM systems. A summarized list of these articles and papers is available in Appendix I. Piccoli, Carroll, & Hall (2011) created a model to evaluate the electronic maturity of hospitality organizations and the level at which they have systematic and analytical processes implemented to take advantage of opportunities in demand generation, multi-channel distribution and revenue optimization. This model describes, at the upper stages (4 and 5), that organizations must have fully integrated systems, with analytical capabilities to achieve a continuous learning and improvement process of optimization, which emphasizes the need for hospitality organizations to have suitable PM systems. At the time this research took place, no specific, self-proclaimed, out-of-the-box PM system was found on the market. However, there are some generic BI and dashboard systems and also some systems related to specific fields of the hospitality industry, mainly for RM, that incorporate a lot of the capabilities and techniques a BI/PM system should have and that can be used to implement a PM system. A list of some of these systems/applications and their main characteristics is presented in Appendix II.
22
Some authors (Yangyong & Yun, 2011; Conway, 2010) call this set of competencies/skills as “data science” and describe this mix as illustrated in Figure 2.9. Figure 2.9: Data science Venn diagram
IT hacking skills Danger zone!
Machine DATA SCIENCE
Substantive expertise
learning
Mathematical and statistics knowledge
Source: Adapted from Conway (2010)
23
3 3.1
METHODOLOGY
Problem identification and motivation
The literature review presented in the previous chapter reinforced the relevance of developing a PM system specific for the hospitality industry and its novelty. Moreover, as elaborated in point 2.6, whereas strategic and management decisions should shift from intuition-based to become analytics-based, the requirements for performance measurement techniques increases in the hospitality industry (Kimes, 2010). Also the need to automate mission-critical areas, like RM, because of its data-centric and multi-disciplinary nature (Serra, 2013) requires the capabilities, techniques and technologies in the core of PM, BI and DA. Together with this need to make better, faster and information-based decisions, the acknowledged inexistence of an out-of-the-box PM system specific to the hospitality industry, is clearly a problem that can be addressed in the context of Design Science Research (DSR), as it requires the development of an artifact, in this case, a prototype of software system, fulfilling the two requirements of DSR: Relevance – by addressing a real business need and Rigor – by the need to apply the proper body of knowledge in the artifact development (Cleven, Gubler, & Hüner, 2009; Hevner, March, Park, & Ram, 2004). A justification for the development of a specific system is also possible to infer, particularly because the market seems open to the use of such a product. This conclusion is based on a survey made in 2004 of 635 experts, consultants and BI industry analysts by The Data Warehousing Institute (TDWI), the world’s leading organization in business intelligence, data warehousing and analytics education and research4. The survey found that 59% of the organizations that had implemented PM systems have built their own, opposed to 30% of the organizations that have bought third party packages. The survey author
4
More information available at http://www.tdwi.org.
24
recognizes “that as more PM products are available, a large percentage of companies will buy them instead of building their own” (Eckerson, 2004). The following sections detail the research methodology activities conducted by the sequential order in which they were developed. 3.2
Selection of the methodology
As previously mentioned, even though this work is in the scientific area of management, it’s goes beyond a strictly a theoretical work as it involved a more practical approach with the creation of a fully functional prototype of a PM software system for the hospitality industry. This meant that research had to be conducted also in the area of Information Systems (IS). For this reason, Design Science Research Methodology (DSRM) - a well-established research method in Information Systems (IS) – was used as the methodology to support the research and presentation of the system. Research in IS is mainly characterized by two main paradigms, namely behavioral science and design science. While the first concentrates on the development and verification of theories, the latter concentrates on the development of solutions for practical problems, and, thereby, on accomplishing utility (Hevner et al., 2004). Design Science (DS) has its roots in 1969 (Gonzalez & Sol, 2012; March & Storey, 2008; Peffers, Tuunanen, Rothenberger, & Chartterjee, 2007; Hevner et al., 2004; van Aken, 2004), in the first edition of the book “Science of the Artificial” (Simon, 1996), but it wasn’t until 2004 with the publishing of the seminal paper “Design science in information systems research” by Hevner et al. (2004), that DS became widely adopted by researchers (Göbel & Cronholm, 2012; Wang & Wang, 2010; Cleven et al., 2009). Despite this, until 2007, with the publication of the paper “A design science research methodology for information systems research” (Peffers et al., 2007) no other stereotypical template similar to the one used for natural science research existed (Geerts, 2011). Peffers et al. (2007) addressed the issue by proposing a DRSM with three objectives in mind: “(1) provide a nominal process for the conduct of DS
25
research, (2) build upon prior literature about DS in IS and reference disciplines, and (3) provide researchers with a mental model or template for a structure for research outputs”. The DSRM as defined by Peffers et al. (2007), is based on the practical guidelines defined by Hevner et al. (2004), being the first guideline “Design as an Artifact” the most important (Peffers et al., 2007). In this guideline Hevner et al. (2004) state that “knowledge and understanding of a design problem and its solution are acquired in the building and application of an artifact”. The authors claim that DSR “requires the creation of an innovative, purposeful artifact”. This artifact should be relevant to the problem “solving a heretofore unsolved problem or solving a known problem in a more effective or efficient manner” (Hevner et al., 2004). The seven guidelines defined by Hevner et al. (2004), that are the basis of DSRM, as identified by Peffers et al. (2007) are described in Table 3.1. Although these guidelines are an important basis for the framework developed by Peffers et al. (2007), other concepts, from a total of seven representative papers and presentations were summarized based on common elements, which then were synthesized in a process model based in six activities (see Figure 3.1) today frequently used as a framework in DSR (Cleven et al., 2009). Although the DSRM process, as depicted in Figure 3.1, is structured in a nominally sequential order, there is no expectation that researchers proceed in a sequential order, from activity 1 to 6 (Peffers et al., 2007), as they can start in almost any step and go outward or backward according to the approach they use or the feedback obtained from a customer or a simulation.
26
Table 3.1: DSR Guidelines
#
Guideline
Description
Design as an Artifact
Design-science research must produce a viable artifact in the form of a construct, a model, a method, or an instantiation.
Problem Relevance
The objective of design-science research is to develop technology-based solutions to important and relevant business problems.
Design Evaluation
The utility, quality, and efficacy of a design artifact must be rigorously demonstrated via well-executed evaluation methods.
Research Contributions
Effective design-science research must provide clear and verifiable contributions in the areas of the design artifact, design foundations, and/or design methodologies.
Research Rigor
Design-science research relies upon the application of rigorous methods in both the construction and evaluation of the design artifact.
6
Design as a Search Process
The search for an effective artifact requires utilizing available means to reach desired ends while satisfying laws in the problem environment.
7
Communication of Research
Design-science research must be presented effectively both to technology-oriented as well as management-oriented audiences.
1
2
3
4
5
Source: Adapted from Hevner et al. (2004)
The importance of iterations between activities and having customer/user feedback is recognized by several authors (Geerts, 2011; Hevner et al., 2004), especially in activities like Evaluation and Communication, where they often result in the revision of the artifact’s objectives and design (Geerts, 2011). Hevner et al. (2004) illustrate this importance in their “build-and evaluate loop” where evaluation provides information on the designed artifact and a better understanding of the problem which leads to a re-iteration of the design process.
27
Figure 3.1: The DSRM process model
Source: Peffers et al. (2007)
The fact that DSRM recognizes the importance of having a continuous process of iteration with the user/customer and having frequent deliverables as a way to obtain feedback – as do Agile software methodologies - was an important factor for our selection of this methodology. Moreover, the finding that authors like Kautz (2011), Abildgaard, Bell, & Poulsen (2009) and Paulk (2002) have published papers about the benefits of combining the use of Agile tools in DSR, also reinforced this selection. 3.3
Research entry point
3.3.1 System concept In accordance to DSRM, a main objective for the project can be identified: the assessment of the commercial viability of a PM system to be distributed as a service. To achieve this, three questions should be answered by this project: •
Q1 - Are there any technical issues that can limit the scope and performance of the system itself?
•
Q2 - Does the hotel’s staff identify the benefits of using the system?
•
Q3 - Is it possible to identify quantifiable improvements in the hotels performance?
As portrayed in the previous chapter although there are several generic BI/DA/dashboard systems and some specific systems for certain fields of the
28
hospitality industry that have BI/DA/dashboard capabilities, there is no evidence of the existence of a fully-fledged PM system as defined by Eckerson (2011) for the hospitality industry. Having identified this gap and the benefits that such a system could provide to a hospitality organization, it was decided to design such an system taking into consideration the implementation of the MAD Framework as characterized by Eckerson (2011) (see Figure 2.7). This gap and the need to clearly identify the problem and the need to design from scratch a system to solve the problem meant that the entry research point as defined in DSRM, was easily defined as the first process activity, the proper definition and problem identification. At the project’s conception, since no specific knowledge base was found in DSR or IS on the number of subjects that should be studied in order to obtain valid results, it was decided to apply the criteria defined in the usability and HumanComputer Interaction (HCI) standards (Sharp, Rogers, & Preece, 2009; Nielsen & Landauer, 1993; Virzi, 1992). This way a group of three to five participating hotels was considered consistent for the evaluation and validation of results. 3.4
Data sources
Although the initial idea was to have the prototype working with different PMS systems, due to time constraints and the familiarity with the “InovGuest PMS”5 it was decided that only hotels with this PMS should be used in the project. As the use of Primavera ERP6 is quite common in the Portuguese hospitality industry and considering the moderate-easy access to the technical documentation of Primavera ERP, it was also decided that the same kind of decision should be made about the Accounting/financial system. Only hotels with the Primavera ERP should be used in the project.
5 6
More information available in http://www.wareguest.com. More information available in http://www.primaverabss.com.
29
On the other hand, other required data sources like the market supply and demand data that is compiled by official entities were, by the nature of the information, defined as secondary data sources, because mostly they were only available as data already processed (not in raw format). Other required data sources, like the competitive set prices and social reputation data could be obtained as primary sources, through the use of information extraction techniques like web mining, web scraping and semantic annotation. These are common techniques nowadays, to find and retrieve relevant and meaningful information from the web (Malik & Rizvi, 2011), but the effort to do so and the resources necessary, would pose a threat to the conclusion of the project in the proposed time frame, so it was discarded. Also, the increasing number of measures and tactics that website owners are using to combat the use of these techniques (Jennings & Yates, 2009) could mean the need to be constantly revising and finding new solutions to counter the problem. Moreover, the legal obstacles enumerated by Truyens & Van Eecke (2014) and Jennings & Yates (2009), together with the requirement for the obtained data to be considered a representative sample, as identified by Johnson, Sieber, Magnien, & Ariwi (2011), were among the important factors in the decision to obtain it as secondary data, instead of building specific web harvesting tools for external data sources. Just the development of a tool to collect the social reputation of a hotel from the myriad of travel websites that exist nowadays in different idioms would be a complex and time consuming task. Because there are several providers who already supply such information in the form of a service, it was decided that all these secondary data sources would be, when possible, obtained from such providers. This decision meant that in terms of data architecture, as defined by Eckerson (2011), the system would be built around two types: BI tools and cloud.
30
3.4.1.1 External data sources procurement While the internal data sources were easily selected and identified, mostly because of the fact that they are also primary data sources, the other sources required an extensive search and evaluation to determine which to use. In the procurement process, the data sources were evaluated not only by the criteria previously detailed in the metrics and indicators identification point, but also by the general characteristics that both primary and secondary data should bear, namely: accurate, reliable, precise, unbiased, valid, appropriate, and timely (Rabianski, 2003). Besides that, other technical characteristics in accordance with the principles of “Service-oriented computing” (Mahmoud & Langendoerfer, 2008; Bichler & Kwei-Jay, 2006; Papazoglou & Georgakopoulos, 2003) were sought in data sources that could be obtained by automatic means: •
Available as web services (WS);
•
Broad, but simple Application Programming Interface (API) with good support documentation;
3.5
•
Use XML or JSON as the data exchange format;
•
Use SOAP or RESTful protocols;
•
Good level of Quality of Service (QoS);
•
Good and timely technical support. Activities sequence
The sequence of activities adopted is based on DSRM and Agile methodologies. From the beginning, several iteration cycles were planned, including demonstrations and evaluations with the users to show the results in each development phase, evaluate and redesign the project requirements with the help of the user’s feedback. It was expected that the full process sequence would be developed in four iteration cycles as depicted in Figure 3.2 (it was consider one cycle every time
31
an evaluation activity was made). A more detailed and time constrained plan is detailed in Appendix III. Figure 3.2: Project activities sequence diagram
Source: Author’s elaboration
Even though there is some debate in DSRM about what should be considered an artifact in DSR (Offermann, Soren, Schonheee, & Bub, 2010; Cleven et al., 2009; Beaudouin-Lafon & Mackay, 2003) the artifacts that were selected to present are both well accepted within the research community. Worth mentioning is the Software Requirements Specification (SRS) document considered a “model” and the prototype, classified as an “instantiation”, a concrete representation of that model, that can serve a variety of purposes (Sharp et al., 2009), some of which are in accordance with the objective of this project: •
Test the technical feasibility of an idea;
•
Clarify vague requirements;
•
Do user testing/evaluation;
•
Check if a certain direction is compatible with the rest of the development, among others.
32
4 4.1
PROTOTYPE DEVELOPMENT AND TESTING
Iteration 1
4.1.1 Defining the system’s objectives To answer the questions posed in the Methodology Chapter a prototype was to be developed with the intention of testing its features with the collaboration of a group of hotels that accepted to facilitate data and use it for evaluation purposes, so inputs in terms of adequacy and consistency could be gathered. However, for the objective of this iteration the definition of the SRS document and its approval by the hotels was crucial for their commitment to participate in the project, as well as for any requisite changes that they wanted to include. Figure 4.1: System concept diagram
PM
BI
DA
Dashboards
Source: Author’s elaboration
At the center and as the core of the system (prototype), as depicted in Figure 4.1, is the dashboard, which corresponds to the “Monitor” layer of the MAD Framework. BI and DA capabilities, techniques and processes, are the foundations that makes it possible to deliver the dashboards, but also makes information available for analysts and the organization staff for analysis and consultation, which are the other 2 layers of the MAD Framework: the “Analyze”
33
and “Detail” functionalities. Altogether, these three layers encompassed by the combination of processes - a fundamental component of PM - act as a catalysts for organizations to optimize their performance and achieve goals, which is the ultimate objective of a PM system. As concluded by Yigitbasioglu & Velcu (2012) a “dashboard is expected to collect, summarize, and present information from multiple sources…”, but “as data is concerned, the dashboard represents the tip of an iceberg”. Data is the base of any PM system. Eckerson (2011) identified eight types of data architectures that could be employed in the construction of PM systems: 1. Direct query; 2. BI tools; 3. Mash-boards; 4. In-memory dashboards; 5. Data federation; 6. Data marts; 7. Complex event processing; 8. Cloud. Furthermore, “cloud” PM systems significantly simplify the process of deployment, because of the almost non-requirement to install hardware or software. In addition to the data architecture used in the design of the PM system, other characteristics were also taken into account based on the definitions of Abdelfattah (2013) (see Figure 4.2) and from Yigitbasioglu & Velcu (2012), Eckerson (2011) and Sauter (2010) (see the list in Appendix IV).
34
Figure 4.2: A Comparison of dashboard data architecture
Source: Abdelfattah (2013)
4.1.1.1 Measures, metrics and indicators identification Hubbard (2010) has a very practical and straightforward definition of measurement: “a quantitatively expressed reduction of uncertainty based on one or more observations”. Measurement selection is one of the cornerstones PM
system
development,
since
it’s
success
could
depend
on
the
measurements selection made (Yigitbasioglu & Velcu, 2012). Indicators that have a significant impact on the business are known as KPIs. KPIs serve as a collection of measures identified as the most critical for the current and future success of the organization (Parmenter, 2010). This author identified seven characteristics of KPIs (described in Table 4.1). In this project the terminology defined by Eckerson (2011) was adopted, not only because it is more commonly used in PM systems, but also because it’s easily related to the BSC, a wide spread PM methodology already implemented in many organizations. However, the methodology used in the selection of indicators was based on the properties taxonomy developed by (Franceschini,
35
Galetto, & Maisano, 2007), which - as depicted in Table 4.2 - describes the properties an indicator should have, grouping them into three categories. Table 4.1: The seven characteristics of KPIs
#
Description
E.G.
1
Are nonfinancial measures
Not expressed in currencies (dollars, euros, etc.)
2
Are measured frequently
24/7, daily or weekly
3
Are acted on by the CEO and senior management team
CEO calls relevant staff to enquire what is going on
4
Clearly indicate required by staff
is
Staff can understand the measures and know what to fix
5
Are measures that tie responsibility down to a team
CEO can call a team leader who can take the necessary action
6
Have a significant impact
Affect one or more of the critical success factors and more BSC perspective
They encourage appropriate action
Have been tested to ensure they have a positive impact on performance, whereas poorly thoughtthrough measures can lead to dysfunctional behavior
7
what
action
Source: Adapted from Parmenter (2010)
The selection of indicators also had to take into account what most authors agree as being a common mistake: the measurement of too many variables (Allio, 2012; Hope & Player, 2012; Eckerson, 2009; Franceschini et al., 2007; Brown, 1996). Therefore and according to the authors cited, the number of indicators per area was restricted to a maximum of 20, however, because each user should be able to establish which indicators to monitor, it should be the user who defines the limit in his/her own dashboard.
36
Table 4.2: Indicators properties taxonomy
Category
General properties
Properties of sets of indicators
Property
Short description
Consistency with representation-target
The indicator should properly represent the representation-target
Level of detail
The indicator should not provide more than the required information
Non counterproductivity
Indicators should not create incentives for counter-productive acts
Economic impact
Each indicator should be defined considering the costs of collecting the information needed
Simplicity of use
The indicator should be easy to understand and use
Exhaustiveness
Indicators should properly represent all system dimensions, without omissions
Non redundancy
Indicators set should not include redundant indicators
Monotony
The increase/decrease of one of the aggregated indicators should be associated with a corresponding increase/decrease in derived indicator
Compensation
Changes of different aggregated indicators may compensate each other, without making the derived indicator change
Long term goals
Indicators should encourage the achievement of process long-term goals
S={ 𝑰𝒊 , 𝑰𝒋 , 𝑰𝒌 } Properties of derived indicators (𝑰𝒊 , 𝑰𝒋 , 𝑰𝒌 )⇒ 𝑰𝑻𝑶𝑻
Accessory properties
Impact stakeholders
on
For each indicator the impact on process stakeholders should be carefully analyzed
Source: Franceschini et al. (2007)
Since the objective of this work was the development of an out-of-the-box PM system, for identifying, selecting and creating the indicators, instead of using the standard techniques, hospitality and other business literature was used. Based on literature findings and considering the characteristics and properties that indicators should comply with, a template was created to define each indicator’s taxonomy in this project’s scope. This template, as presented in Table 4.3, was developed, based on a combination of features of the models defined by Caldeira (2013), Eckerson (2011, 2009), Parmenter (2010) and Franceschini et al. (2007).
37
Table 4.3: Indicators taxonomy template
Identification Number (e.g.001)
Designation (e.g. Average Room Rate (ARR))
General Purpose
Type
Area
Simple and clear description of the indicator. e.g. Average room rate in Euros. Type of indicator. Outcome (lagging)
Driver (leading)
Hospitality/management field that the indicator is associated with. e.g. General ratios
Dashboard type
Orientation
Type of dashboard that the indicator should be integrated. Operational
Tactical
Strategic
Indication of it’s an indicator with a goal, a risk indicator or simply an activity performance indicator. Goal
Activity
Risk
Data Type of data sources it should read the data from. Source(s)
PMS
Accounting/ERP
Weather
Social reputation
Market supply/demand
Competitive intelligence Dimensions
Collection periodicity
Data dimensions necessary to produce the indictor. e.g. Room Planning and Reservations Time between each update of data. e.g. Every 15 minutes.
Characterization Unit
Unit of measure that the indicator should be presented. e.g. Euros Time frames that the indicator should be calculated.
Time frame
Daily
Weekly
Quarterly
Yearly
Monthly
Calculation formula of the indicator. Formula
Benchmark(s)
e.g.
!"!#$ !""# !"#"$%" !"#$%& !" !""#$%&' !""#$
Indication of if there should be a comparison to some benchmark or baseline. Budget
Same period last year (SPLY)
Market data
Forecast
38
If goal should exist, what type of goal should it be? Target type
Achievement
Reduction
Absolute
Min/Max
Zero
Visualization Display format
Interaction
Type of visualization to use on the dashboard. Chart/gauge
Table/pivot table
Icon
Indication if the indicator supports interaction and what type of interaction. Table with data used
Drill down/Filter/Segment data
Remarks Related information
Additional information about the indicator. e.g. All values should be net of taxes and fees. Bibliography that describes the indicator.
Bibliographic reference
e.g. American Hotel & Lodging Association, Hospitality Financial and Technology Professionals, & Hotel Association of New York City (2006) Source: Author’s elaboration
Regarding the scope and objectives of this project, the criteria of metrics and indicators selection took into account not only the above-cited characteristics, but also others that were more of a practical nature, mainly: •
Availability of data sources;
•
Automatic (machine) access to data sources (when possible);
•
Access to data sources free of charge or at an affordable price.
A list of all metrics and indicators and their classification can be consulted in Appendix IX. 4.1.1.2 Data sources identification Based on the identified metrics and indicators, and the expressed selection criteria, it was necessary to determine the data sources that could provide the required data, because, as recognized by several authors PM and dashboards require the use of multiple data sources (Serra, 2013; Yigitbasioglu & Velcu, 2012; Eckerson, 2011; Cokins, 2009; Pauwels et al., 2009; Rasmussen et al., 2009). These data sources, could be of different types (primary and secondary)
39
and origins (internal or external) (Korte et al., 2013; Turban et al., 2011; Venkatraman
&
Ramanujam,
1986).
The
data
sources
identified
as
indispensable are portrayed in Table 4.4. Table 4.4: Data sources 7
Data source
Type
Origin
Property Management System (PMS)
Primary
Internal
Accounting/Financial
Primary
Internal
Weather (historic and forecast)
Secondary
External
Social reputation – own hotel and competitive intelligence
Secondary
External
Prices and inventory – competitive intelligence
Secondary
External
Market – supply and demand
Secondary
External
Source: Author’s elaboration
Bellow, the domain of the information each data source should provide and also the reasons why they were chosen is briefly explained: •
Property Management System (PMS) – nowadays, almost every hotel (even very small ones) have a PMS system were all operations regarding bookings,
reservations,
invoicing,
room
occupation
and
other
transactions are registered, therefore, having access to this data source enables accessing all of that information; •
Accounting/Financial – accounting/financial systems normally hold the financial information of the hotel in an accounting perspective, complementing the PMS data with costs, depreciations, interests, taxes and other accounting/financial information. Only by conjugating the information from the PMS and the accounting/financial systems it is possible do produce most of the more common financial and operating
7
We considered internal the data sources whose data was owned by the hotel and was in internal servers/documents. All data not owned by the hotels or available on servers/documents from third parties were considered external.
40
statements, as well as calculate the main ratios/indicators used in the hospitality industry, like the ones defined in the Uniform System of Accounts for the Lodging Industry (USALI) (American Hotel & Lodging Association et al., 2006). Only with financial information is possible to have a better focused and oriented application of RM practices (Huefner & Largay III, 2008); •
Weather – the common perception that weather conditions can affect the performance of the tourism industry, especially in resorts, was confirmed in a paper from Day, Chin, Sydnor, & Cherkauer (2013). Through a study undertaken in the United States of America, the authors verified that even in destinations where the climate isn’t an attraction, the weather conditions affect tourism and therefore, can affect the hotels economic performance. This data source should provide information about current conditions and conditions forecasted for a period of days (no less than three);
•
Social reputation (own and competitive intelligence) – data on how the hotel and its competitive set is perceived on travel review websites. Nowadays, social reputation is a very important factor in a customer selection of a hotel (Sheivachman, 2011; Sparks & Browning, 2011) and even the hotel brand equity (Callarisa, García, Cardiff, & Roshchina, 2012). This relevance has also a major impact on the economic performance of hotels;
•
Prices and inventory (competitive intelligence) - data on how the hotel and its competitive set are selling at Online Travel Agencies (OTA’s) (prices and inventory availability). Although some authors like C.-C. Chen & Schwartz (2013) argue that consumers are adapting to revenue management practices and taking advantage of the more recent technological advances and that hotels have to improve their price strategies, the assessment of the hotel’s competitive set is still a big component of the pricing formulation (Hayes & Miller, 2011);
•
Market (supply and demand) – data on how supply and demand is performing in the region, so that benchmarking can be made. In an increasingly competitive world, benchmarking, a methodology that allows organizations to evaluate themselves against their competitors (Pyo, 41
2001) can be a very important tool in identifying the strengths and weaknesses of an organization. Because the data for benchmarking is widely available, at least at some extent, but its use is not all that common, it was decided to implement it in the system. After careful and detailed analysis, evaluation and in some cases negotiation with the providers, the following automatic data sources were selected (by subject): •
Weather: it was decided to use “Weather Underground”8 as data source since it gathers data from thousands of weather stations around the world, it answered all the requirements established and, above all, it was free to use and enabled hourly updates of the current conditions and forecast conditions for the next 10 days, providing a wide range of variables like temperature, barometric pressure, wind speed and direction, rain probability, among many others;
•
Social Reputation: being social reputation a very important element for the economic performance of a hotel, a large search task was conducted among specialized companies who already collected this kind of data from travel reviews websites, processed it, do the semantic analyses and supply the information back to hotels or other companies, not only in the form of dashboards, but also as an API. After evaluating and negotiating with different providers, ReviewPro9 was chosen, in spite of the fact that ReviewPro, as other companies, charges for the service to access to their data. This being an academic project, special conditions were created. The fact that ReviewPro was used in other scientific works (e.g. Anderson (2012)), brought an assurance on the data reliability;
•
Competitive
intelligence
(prices
and
inventories): gather the
publicized prices of a hotel and its competitive set. Although the initial plan included building a web-scraping agent to obtain this information from the OTA’s websites, due to the potential of this to become a giant
8 9
More information available at http://www.wunderground.com/about/data.asp. More information available at http://www.reviewpro.com.
42
task. Instead, this source was procured, avoiding the time consuming work that could have jeopardized the project’s conclusion. Several companies that provided that service were contacted and their services evaluated. Sletoh10 was selected. At the time, Sletoh provided access to their API to collect the current prices and the forecast for the next fourteen days, for at least five hotels and their competitive set, free of charge. For the other data sources, as already expected, no automatic way of accessing the data was found. The only sources identified could only be consulted “manually” and then inserted the same way or by other alternative means. This was the case for the data for the “Market – supply and demand” where two sources were selected: •
Instituto Nacional de Estatística (INE) or “Statistics Portugal” as translated by the entity. INE publishes annually a compilation of the tourism activity’s main results in Portugal, both from supply and demand point-of-views. For the purpose of this work the data from the years of 2012 (Instituto Nacional de Estatística, 2013) and 2013 (Instituto Nacional de Estatística, 2014) was used;
•
Turismo de Portugal (TP): Compared to INE, TP provides less extensive but more specialized information, therefore some market data like average room prices, room occupancy rates, among others indicators can be obtained via TP with “only” three to four months’ delay. All data obtained from their web page11 was periodically updated in the project databases as it was published.
10
More information available at http://www.sletoh.com. Regional statistics available in http://www.turismodeportugal.pt/Português/ProTurismo/estat%C3%ADsticas/an álisesestat%C3%ADsticas/destinosregionais/Pages/destinosregionais.aspx. 11
43
4.1.2 Design and development 4.1.2.1 Software requirements specification Although the developer of the system is also the author, because the requirements specification should be presented to the hoteliers to obtain their input, validation and commitment for participating in the project, a formal document of the Software Requirement Specifications was written. This document, presented in Appendix V, was elaborated using the IEEE Standard 830-1998 (IEEE Computer Society, 1998) to insure the main characteristics such a document should have. However, some of its features were deliberately modified since, as expressed above, the main audience for the document was the hoteliers. 4.1.3 Demonstration 4.1.3.1 Presentation of artifact to hotels The demonstration of the artifact (mainly the SRS document) in this iteration had the objective of legitimizing it, which is a DSR valid evaluation function (Cleven et al., 2009), as it “enables a traceable documentation of inputs and outcomes of the artifact construction process”. This first demonstration activity was a key task and played an important role in the project’s success, as it represented the first introduction of the project to the hotels. This iteration was critical since without the hotels participation it wouldn’t be possible to access the internal data sources nor could a proper assessment of the prototype be done, possibly resulting in the project’s closure. However, some requisites for the selection of hotels who would be invited to participate in the project had to be established, i.e.: •
Business dimension: hotels should have some business dimension in the sense of not being a small or boutique hotel, so that the use of a PM system could potentially bring value to the hotel’s operation; 44
•
Internal accounting: the accounting/financial operation of the hotel should be made by the hotel or hotel headquarters themselves and not by an external company, otherwise the access to the accounting/financial data sources could be hampered;
•
Used InovGuest PMS and Primavera ERP: to guarantee the development in time of software agents to do the ETL of PMS and Accounting/financial data sources it was vital to assure the practical understanding of the structures of the databases, via familiarity with PMS and ERP systems used by the hotel;
•
Geographic proximity and accessibility: due to two main reasons: (1) simplifying the gathering of market data, by hotels all from the same region and (2) to mitigate any possible time losses of time on travel that could occur when meetings should be held or in the event of physical access to the hotel’s servers (if necessary);
•
Easy access to the IT team or to the companies who provided IT support: considering that it would be necessary to access the hotel’s servers and the databases of InovGuest PMS and Primavera ERP there was a high probability of needing passwords or clearance to access them, as well as to surpass any security issues that could arise;
•
Familiarity with the management team: as a consequence of the previous enumerated requirements and the sensitive nature of some of them, especially the need to share confidential information, some acquaintanceship with the hotel management team would facilitate their availability to participate in the project and also, would probably commit them to putting more effort into answering any requests.
In accordance with the established criteria, the hotels described in Table 4.5 were selected.
45
Table 4.5: List of selected hotels
Identification
Type
Characteristics
H1
Touristic apartments ****
86 apartments in mixed-ownership (part in timeshare), with interior and exterior pools, meeting rooms, gym, one bar and one restaurant (explored by a third party).
H2
Hotel ****
180 rooms, with meeting rooms, SPA, exterior pool, gym, one bar and one restaurant.
H3
Apartments hotel ****
158 rooms, with meeting rooms, exterior pool, one bar and one restaurant (just for breakfasts).
Apartments hotel *****
22 rooms, 2 suites and 80 apartments in mixedownership (part in fractional ownership) with meeting rooms, SPA, interior and exterior pools, tennis court, gym, two bars and one restaurant.
H4
Source: Author’s elaboration
The demonstration activity, in this first iteration, consisted of the presentation to the hoteliers, in one-to-one meetings, of the SRS document (artifact) with a walkthrough on the main topics. A brief presentation was made (see Appendix VI) inviting the hotels to participate, showing the project steps and offering the hotels full confidentiality about their participation and about the data gathered. Though only H1 asked for a “Non-disclosure agreement” (NDA), one was presented to all hotels (a template of this NDA is available in Appendix VII). All demonstrations occurred in the hotel’s installations and in the presence of the hotel’s general managers and other management team members, except in the demonstration to H1, where only the financial manager was present. 4.1.4 Evaluation 4.1.4.1 Obtaining hotels’ feedback and approval Although the evaluation could be developed within the research itself, since an internal evaluation could also be considered a valid position for evaluation (Cleven et al., 2009), the evaluation of the artifact was also undertaken by the hotels, so that the they could be involved from the first moment. The evaluation of an artifact can take multiple forms, according to the problem’s nature and artifact type (Peffers et al., 2007). Conceptually, it could include any
46
appropriate empirical evidence or logical proof. In this case, client (potential users) feedback, a valid form of evaluation according to Peffers et al. (2007), was the expected outcome from this activity. At the moment of the demonstration/presentation of the project, embodied in the SRS document (a copy was given to each hotel), all hotels, showed a very high degree of interest in participating in the project. Nevertheless, none confirmed the participation “on the hour”. It took almost two weeks until there was written confirmation of the participation of all four hotels. No hotel asked for any changes in the SRS document and unanimously showed enthusiasm about the project. However, H3 and H4 revealed some apprehension about the planned period prototype evaluation in production environment (high season). Having the hotels “on board” the project, the next iteration began, but not before each hotel was asked to define a competitive set (with five hotels), so that is could be used during the development and internal testing of the prototype. 4.2
Iteration 2
4.2.1 Solution objectives definition Despite the fact that the hotels didn’t make any changes to the specified requirements for the project prototype, as this was the first iteration where the prototype itself would be evaluated, the objectives for this iteration were planned beforehand the demonstration, so that the hotels could manifest their opinion and submit them, if agreed. Among the objectives established was the use of incremental “deliver” of functionalities. As an “Agile” methodology was used for the software development itself, where requirements prioritization and incremental deliver in each iteration is recognized as a way to deliver to users, it was essential to identify the functionalities that the hotels valued the most as soon as possible (Ratcliffe & McNeill, 2012; Racheva, Daneva, Herrmann, & Wieringa, 2010; Cao & Ramesh, 2008).
47
At the time of the demonstration it was explained to the hotels that this iteration was planned to implement functions regarding weather, competitive intelligence (prices and inventories) and social reputation (own hotel and competitive set), because this was the kind of information that most hotels didn’t have easy access to. The objectives at the end of this iteration were: 1. Assess the technical aspects of the development (technologies choices, performance, reliability and security); 2. Assess the performance of the system (agents, databases response, servers performance, reliability of data sources, uptime guarantee); 3. Assess the system usability and human-interaction interface; 4. Assess if the hotels identified any benefits for the use of the implemented functionalities; 5. Obtain feedback on changes that should be implemented on the functionalities or on the ones changes to be implemented on the following iteration. 4.2.2 Design and development 4.2.2.1 Metrics and indicators selection Taking into account the functionalities defined to be implemented in this first iteration and the variables available in the data sources, the metrics and indicators referenced in Appendix IX were implemented. 4.2.2.2 Design of the database models The project development itself started with the data warehouse design, a task that is complex and time-consuming (Storey, Thompson, & Ram, 1995). Due to previous experience with Microsoft SQ family of database tools12 and its set of development tools, this was the solution adopted for the task in hand.
12
More information available at http://www.microsoft.com/en-us/servercloud/products/sql-server-editions/sql-server-business-intelligence.aspx.
48
Another important factor in the decision to use this data warehouse technology is that while there are other technologies that could be considered for this purpose, at least in some aspects or specific uses (Howard, 2013), it was possible to access to this solution at no cost for both the development and the production environments. In this iteration, two relational database structures were designed: •
HPD_Master – the system’s main relational database that would hold data common to all applications/hotels. The diagram presented in Appendix XI illustrates this database’s tables. At this iteration, the tables Shared_ITSYSCalls, Market_Monthly and Market_Yearly and some of the fields regarding the “ITSYS” calls were not implemented;
•
HPD_Transactional_Base – database that was used has an original structure
to
clone
for
each
hotel
database.
The diagram presented in Appendix XII illustrates the tables in this database. In the DVD included in this document it’s also possible to view the complete database dictionary. The DVD attached to this document includes the complete database dictionaries for the above-mentioned databases. At this iteration only the base tables like users configuration, profiles, logs and those related to the functionalities implemented in the iteration were included in the design, specifically CI, social reputation and weather. 4.2.2.3 Software development (programming) To be coherent with the systems characteristics described in the Software Requirements Specification Document (see Appendix V), the system was designed not as one application by itself, but as a set of applications agents (system), designed in the principles of a distributed and resilient computing environment as defined by Castain & Squyres (2007): 1. Weather information: 2. CI (prices and inventories) information:
49
3. Social reputation information: All agents and the orchestrator applications are components of the PM system, but they also have their own dashboard, which displays information about their current status and the tasks being processed or on queue to be processed, as depicted in Figure 4.3. Figure 4.3: Orchestrator and agents running on the system server
Source: Author’s elaboration
4.2.3 Visualization layer As presented previously in Chapter 2, a very important characteristic in a dashboard is the visual presentation element. Consequently considerable effort was devoted to the development of the portal component, not only from the aesthetic and HCI points of view, but also from a wider scope, from the Interaction Design (ID) point of view as defined by Sharp et al. (2009) and depicted in Figure 4.4.
50
Figure 4.4: Relationship among disciplines, fields and practices in ID
Interdisciplinary fields
Academic disciplines
• Human factors • Cognitive engineering • Human-computer interaction • Cognitive ergonomics • Information systems
• Ergonomics • Psychology • Informatics • Enineering • Computer science • Social sciences
Design practices • Graphic design • Product design • Artistic design • Industrial design • Film industry
Interaction Design Source: Adapted from Sharp et al. (2009)
In terms of the website/portal design, it was followed what Sharp et al. (2009) cite from Jeffrey Vee in their seminal book “Interaction design” was followed. Here, they agree that, albeit all the research and literature available on website design, all website pages should be deconstructed in three areas (see Figure 4.5). These areas could be identified as answering three questions: 1. “Where I am”: Area where the users can easily established where they are; 2. “Where can I go”: This is the navigation/menu area where users select what they can do and where to go; 3. “What’s here”: This is the content area and the most important area in the website. The reason the user is using it.
51
Figure 4.5: Website areas
Source: Adapted from Sharp et al. (2009)
The development of this dashboard PM system tried to follow the main guidelines identified by two of the best known authors in this subject, Few (2006) and Eckerson (2011). 4.2.3.1 Testing and simulation in production servers In a classical software production deployment there are normally two parallel environments: one for testing - where tests on new versions of the software are made - and one for production - where the live processing occurs (Inmon, 2002). The production environment was installed in a datacenter classified as Tier III (redundant capacity components, dual-powered equipment and multiple uplinks with a guarantee of 99.982% availability)13 so that the features that any cloud system should have, as explained by Allen et al. (2012), could be guaranteed.
13
More information available at http://www.uptimeinstitue.org.
52
That system was installed in a unique server14 that would act as application server, running the orchestrator, weather, CI (prices and inventories) and social reputation ETL agents, as well as the PMS and Accounting WS and the website (portal) itself, but acting also as the database server. 4.2.3.2 Deployment of the prototype version 1 (artifact) 4.2.4 Demonstration The objective of this activity, within this iteration and on the next ones, was to demonstrate that the artifact, as defined in DSRM by Peffers et al. (2007), solved one or more instantiations of the problem, but also to demonstrate the knowledge base it was built upon. Moreover, it was a way to transmit some of the acquired knowledge to the hotels. At the beginning of each demonstration, a presentation (see Appendix XIV) was made to each hotel, to introduce the topics of the demonstration and also explain what they should expect from the developer and from the system, and also, what was expected from them. To demonstrate the functionalities implemented in this first version of the prototype, a walkthrough was made on the general aspects of the system website and then on each one of the functionalities. The demonstrations were undertaken at the hotels, at a previously scheduled time. The demonstrations took an average of 02h30m per hotel. It was the hotel manager who decided whom to invite to the project and therefore, be present at the first demonstration. The persons present were: •
Administrator;
•
General managers;
•
Assistant general manager.
•
Operations managers;
14
Intel Xeon processor CPU E3-1230 3.30 Ghz, with 32 Gb of RAM, 4 x 1Tb hard disks in RAID 5, with Windows 2012 standard edition (64 bits), Microsoft SQL 2014 BI edition and Microsoft Internet Information Server (IIS) 8.0.
53
•
Financial managers;
•
Assistant financial managers;
•
Reservations managers;
•
Public relations/e-commerce staff.
Prior to demonstrating the pages developed in this first iteration, an explanation of the general features was made (for more information about them see Appendix X). 4.2.4.1 Weather Current/forecast The first option demonstrated in all hotels, was also the first webpage developed. It displayed the current weather conditions and a 10-day forecast (see Appendix XV). This page’s design served as test to determine the aesthetic and minimalist design of the website as Sharp et al. (2009) say it should be. Dashboard This page (see Appendix XVI) is one of the pages with more charts on it, a total of 7. It was designed to provide quick information on the current weather conditions (top gauges: temperature, wind speed and direction, rain precipitation and UV factor) and also 2 charts with the forecast for the next 10 days. The first chart showed the minimum and maximum expected temperatures, plus the probability of rain. The second one focused on the temperatures amplitude and average. 4.2.4.2 Competitive intelligence This page had two subpages: one regarding prices and inventories and the other regarding the social reputation. The objective of both pages was to make possible for the hotel to easily compare its performance in terms of prices/inventory with the major OTA’s and also the social reputation against the competitive set established by the hotel.
54
Prices The CI information provided by the charts on this page is very important nowadays, especially for RM. With these charts the hotel can quickly analyze the behavior of its competitive set and take actions in the form of pricing or tactical rules application to maximize its revenue. As depicted in Appendix XVII, this page has four charts: •
Next 14 days best price/inventory analysis: chart that shows the best price at which each hotel is selling its rooms in OTA’s, for the next 14 days. A click in a data point of any of the hotel datasets shows the number of rooms being sold (Figure 4.6 illustrates where it’s possible to see on the upper right corner the “back” button to return to the main chart);
•
Next 14 days price amplitude: shows for each of the next 14 days, the price amplitude between the minimum and maximum price charged by the hotel and it competitive set (columns) and position of the hotel price according to that amplitude (line);
•
Next 14 days sorted by prices: chart that displays the price information. Similar to first chart but with a different visualization, making it easier to understand the position of each hotel, at each time period, price wise;
•
Price evolution for a date: chart that shows the price evolution for a particular day. This is an analytical chart that enables the hotel to comprehend the pricing behavior of its competitors, at previous time periods and, through that extrapolate the competitor’s occupancy or pricing strategy and adequate its own strategy accordingly.
55
Figure 4.6: Example of chart drilldown
Source: Author’s elaboration
In these charts it’s possible to segment/filter the information by board types, room types, suppliers and maximum number of persons. Social reputation With the big impact social reputation can have on the hotel’s economic performance (as previously commented), this page empowers hotels to compare their positioning with their competitive set and take external measures like capitalizing in the advertisement of their strengths, or internally by using the indicators to correct possible weaknesses. This page (see Appendix XVIII) includes five charts: •
Competitive set GRI15: chart that highlights the hotel’s GRI position, by category, against its competitive set. By clicking in a hotel bar it’s possible to drilldown to the number of reviews (per sentiment) that were made in the selected time period;
15
GRI stands for Global Review Index and it’s an aggregate online reputation score for an individual hotel, group of hotel, or chain. It is calculated with a proprietary algorithm based on scores given by reviewers on major online review websites and online OTA’s, in over 35 languages. More information available at http://www.reviewpro.com/products/features/global-review-index.
56
•
Competitive set comparison: icon and number metric that indicates the percentage points that the hotel overall GRI is above or below the average GRI of its competitive set;
•
Reviews type per hotel: heat map that displays the number of reviews each hotel obtained in the selected time period, mentioning each category;
•
GRI evolution per distributor: chart that depicts the weekly evolution of the GRI, for the selected hotel and category;
•
Top mentioned concepts: heat map that displays the top mentioned concepts (words) in reviews during the selected period, for each hotel.
Depending on the chart, it’s possible to segment/filter the information by time period, review sentiment (positive, neutral or negative), review languages and categories (overall, room and cleanliness, among others). 4.2.4.3 Hotel social reputation As other options, this option displays metrics/indicators in the form of charts, except in this case, the metrics/indicators on social reputation focus on the hotel itself, instead of its competitive set. The main objective behind the implementation of the six charts/graphics displayed in this page (see Appendix XIX) is to give the hotel quantitative information about it social reputation so that any negative points could be rapidly addressed, minimizing any adverse impact on the hotel’s social reputation. At the same time, any positive points could be used as an appraisal of the hotel department/team behind them. The charts/graphics on this page are: •
Global review index: this gauge shows the GRI value – both current or average for the selected time period, for the selected category;
•
Reviews distribution: this pie charts shows the distribution and frequency of reviews per sentiment (positive, neutral or negative) for the selected time period;
57
•
Tripadvisor ranking: this graphic shows the current Tripadvisor 16 position of the hotel in the local Tripadvisor ranking;
•
Evolution of reviews by source: area chart that depicts the distribution and frequency of reviews, per week and per source (distributor);
•
GRI evolution: chart that depicts the weekly evolution of the GRI, for the selected category;
•
Mentions in reviews: weighted list that shows the fifty most mentioned concepts (words) in reviews, where the frequency defines the size of each word and the sentiment balance (positive or negative), it’s color.
As with the CI social reputation pages, in these charts, according to the chart, it’s possible to segment/filter the information by period, review sentiment (positive, neutral or negative), reviews languages and categories (overall, room, cleanliness, among others). 4.2.5 Evaluation Due to the nature of this project, the evaluation activity started in parallel with the demonstration activity as a way to collect user’s feedback, a common fact in development of DSR artifacts (Peffers et al., 2007; Markus, Majchrzak, & Gasser, 2002). However, the evaluation activity did not end with the demonstration activity. More in accordance with “Agile” software development methodologies than DSR, it continued during the next iterations due to the need to gather data from system usage, to complement the users feedback and, in that way, use other relevant metrics and analysis techniques as any evaluation in DSRM should do (Peffers et al., 2007). In order to do the gathering of the usage data, functionalities to keep a record (log) of all user login/logout operations, all user menu options selection and all user option automatic refresh time (time that user stayed in each option) were implemented in the development of the system. 16
Tripadvisor ranking was selected as it is the most popular travel review website and therefore with a big impact in consumers (Statista, 2014).
58
If the analysis of the gathered data were mainly to be done in the last evaluation activity of the project, the users’ feedback on the first prototype demonstration would be overwhelming. First, because all users, from all hotels, understood the concept of the system and the importance of the information provided in the dashboards. Second, because the users really embraced the project and not only made concrete observations on how they benefit from the use of the system, but also gave suggestions for future versions. From what was observed in the demonstration activity and from the first two weeks of follow-up on the usage data we could assess that the system was performing as expected. At the end of each demonstration the hotel managers were asked to identify all users that should have access to the prototype, so that they could receive login credentials and also to ask them for their collaboration by using the system and sending back any questions or comments. 4.3
Iteration 3
4.3.1 Solution objectives definition Apart from minor “bugs” that were promptly corrected, no other substantial feedback resulted in changes to the system or to the previously defined requirements. Since hotel managers didn’t manifest the need for more team members to use the system, even though this was encouraged, the collaboration features that every PM system should have, as found in the literature presented in Chapter 2, were not developed in this iteration. Instead, efforts were put into integrating the data from the hotel PMS and provide the hotels operational performance metrics and indicators as well as the market supply and demand metrics and indicators. The two main objectives for this iteration were for the prototype to provide hotels with a way to see, at a glance, the main operational metrics and indicators through the use of dashboards and scorecards, as well as
59
benchmarking, so they could better understand how the competition was performing and what measures they would need to implement in order to achieve better results. The accomplishment of this second objective was even facilitated by adding a new data source to the system - Smith Travel Research (STR)17 hotel analytics data - taking advantage of the fact that the university had special conditions to obtain data from that source. 4.3.2 Design and development 4.3.2.1 Metrics and indicators selection The metrics and indicators referenced in Appendix IX were implemented in this iteration. All monetary values were used without the inclusion of VAT or other taxes. 4.3.2.2 Design of the database models In this iteration the structure of the databases was modified to accommodate the data for the new functionalities, namely: •
Main
relational
database:
the
tables
Shared_ITSYSCalls,
Market_Monthly and Market_Yearly were added as well as some fields in the preexisting tables to implement the new functionalities; •
Hotels transactional databases: were added the different tables for the PMS and Market data.
As defined in the SRS document, to enable fast access to view the PMS information from any point of view, a dimensional database for each hotel was created in this version. These databases’ ERD can be seen on Appendix XIII. 4.3.2.3 Software development (programming) In addition to the expected programming work to be developed in this iteration, it was also necessary to do two changes to the planned development:
17
More information available at http://www.strglobal.com.
60
1. Architecture change: for the system to be more distributed and prepared for scalability the web services for receiving the PMS and accounting data were separated. The inclusion of the STR market data source also brought some additional changes. The system’s architecture change is represented in Appendix XX. 2. Change to the CI prices and inventories data source: during the second week after the deployment of the prototype’s first version the supplier (Sletoh) informed that in order to continue the use of system the service had to be paid for and immediately revoked the access to the data. Hence, it was compulsory to look for alternative sources and develop a new ETL agent for the new supplier: ITSYS18. Apart from the referred changes nothing relevant was found or reported by the system users that required any other developments. 4.3.2.4 Deployment of the prototype version 2 (artifact) The deployment of the prototype’s new version was done on the 29th of July and involved the regular execution of backups of all types of information, so that the operation could be rolled back if any problem would arise – which turn out to be unnecessary. Prior to the deployment of the new version, the roll out of the version was previously confirmed with the hotels. The new demonstration activity was also scheduled. 4.3.3 Demonstration As in the previous iteration demonstrations, this demonstration was undertaken in the hotel premises and took from 2h00m to 3h30 depending on the hotel. The persons present were almost the same as in the previous iteration, except for H2 which brought the new revenue/e-commerce manager and an administration consultant to the demonstration.
18
More information available at http://www.itsyssolutions.com.
61
As
in
the
previous
iteration
a
walkthrough
of
the
implementation
options/features was made. 4.3.3.1 PMS Scorecard The first option presented in this iteration demonstration activity was the PMS metrics/indicators scorecard. This scorecard - as displayed in Appendix XXI - has only one table. This table exhibits a wide range of operational metrics/indicators and presents the values for the previous data, month-to-date (MTD) and year-to-date (YTD) and also the comparison and variation from the same period of the last/previous year (LY). It also includes the accumulated values of the last 12 months and for hotels that don’t have yearly closing periods, the daily average for the last 12 months. Although much of these metrics/indicators are available to the hotels through their PMS systems, the way the information is displayed on screen and the consolidation of all the information in the same screen makes it innovative. In addition, the speed at which it is presented and especially the possibility of applying filters/segmentation is a unique feature that is not available in most of the PMS systems, transforming this from a static report into an analytical tool as well. Analytics This page makes use of the tools and capabilities of DA to provide expert users a way to study patterns, trends, correlations and segmentation in operational metrics/indicators. As previously presented in Chapter 2, this is a feature that all PM systems should have and its importance is growing, particularly in hospitality with the multiplicity of customer segments and distribution channels. As presented in Appendix XXII this page is composed of four interactive charts: •
Booking frequency distribution analysis: histogram that makes possible the analyses of the frequencies distribution of the booking
62
window or the length of stay (nights) of the bookings made for the defined period. •
Metric trend analysis: line chart that enables the user to visualize the behavior of the selected metric/indicator over the selected time period. This is useful especially for observing seasonal behaviors and the overall trend by observing a regression line;
•
Study of two metrics correlation: scatter plot that enables the study of the correlation between two selected metrics/indicators, in a selected time period. It also presents the Pearson correlation coefficient and the coefficient of determination between the two selected metrics/indicators.
•
Metric analysis in two dimensions: “heat map” that allows a fast analysis of the combined metric/indicator from two selected dimensions, enabling the analysis of a 10 x 10 matrix of values in a very short time.
Filtering and segmentation by distribution channels, market segments, nationalities and room type dimensions can be applied to all the charts. 4.3.3.2 Market Official statistics This page, as presented in Appendix XXIII, includes three charts and one scorecard. The three charts are: •
Market share monthly analysis: combination of line and bar charts that display the monthly number of stays of the hotel against the total of stays in the region (independent of the type of hotel unit), as well as the stays fair share19 and market share;
•
Room occupation monthly benchmarking: line chart that compares the hotel room occupation rate against the region room occupancy rate (independent of the type of hotel unit);
19
To apply the fair and market share calculations formula, the monthly number of stays is calculated by dividing the yearly number of stays for the twelve months, since the monthly information is not provided by any official entity.
63
•
Stays occupation monthly benchmarking: line chart that compares the hotel stays occupation rate against the region stays occupancy rate (independent of the type of hotel unit).
All these outputs are independent of the type of hotel unit. The scorecard enables benchmarking the hotel’s yearly performance against the same type of properties in the same region and also against the total hospitality properties in the region, regardless of the type. The information for this scorecard is manually inserted into the system database from the INE official statistics. However, not all metrics/indicators are available directly in raw data, so, the signaled ones are calculated using the base metrics/indicators. STR competitive set From the supply and demand data delivered by STR three indicators were used: ARR, Room occupancy rate and Revenue Per Available Room (RevPAR). Although there aren’t yet many hotels in the Algarve region subscribing to the STR service, meaning that there is some difficulty in defining a competitive set, it was decided to implement this data source since the information is timely obtained than from the official entities (STR delivers its data on the 20th of the following month, while INE and TP sometimes up to five months to publish their data). Due to the previously mentioned small number of hotels associated with STR in the region it was decided to choose the same hotels to be part of the competitive set of all the hotels participating on the project. The only three parameters on this selection were that the competitive set should meet the conditions stipulated by STR and all hotels should be from the Algarve region and be classified as “upper upscale class”, which is the classification STR attributes to the hotels participating in the project. The three charts available on this page, as showed in Appendix XXIV are:
64
•
Metrics monthly analysis: line chart that allows the comparison of the monthly performance of the selected indicator, for the selected year, against the STR competitive set average;
•
Two-year trend analysis: line chart that shows the evolution of an indicator for both the hotel and the STR competitive set, over 2 years. It also shows the regression lines of both datasets so that trend of both the hotel and competitive set can be compared;
•
Yearly metric analysis: bar chart that enables a fast comparison between the hotel and the STR competitive set for the last three years performance for the selected indicator.
4.3.4 Evaluation The response from the hotels to the demonstration activity of this iteration was even more enthusiastic than on the previous occasion, to the point that three of four hotels ended up asking until when would the prototype be running, because not only was the system providing information that until then they didn’t have access to or even in the case where they already had, the access was now easier and faster. With the integration of the operational and market information, the H2 and H4 asked to create logins for more users. H2 asked to create logins for the 2 new users that were present at the meeting and H4 to create a login for the frontoffice manager. Apart from the suggestions from two hotels for in future versions to integrate forecasting and “what if scenarios”, and to do multiple selection on the charts filters, only small changes, like the inclusion of averages per hotel type and region in the “Market – official statistics page” scorecard (which were implemented at the beginning of the next iteration) no other changes or requirements were added by the users feedback. As in the previous iteration, the evaluation activity didn’t stopped at the demonstration activity as the system continued to collect data on its use.
65
4.4
Iteration 4
4.4.1 Solution objectives definition In this last iteration the system’s main objectives were maintained, but as in the other iterations, specific iteration objectives were added. In this case, the goal was to provide hotels financial results and metrics/indicators that combined data from the different data sources, in dashboards and scorecards that the hotels normally don’t have access to, enabling them to have better and timely information, to support improved decision making. This included the implementation of a financial demonstration page, a page with a BSC, a default page with the main operational KPIs and the ad hoc reports page, where users could be their own pivot tables. 4.4.2 Design and development 4.4.2.1 Metrics and indicators selection The metrics and indicators referenced in Appendix IX were implemented in this iteration. 4.4.2.2 Design of the database models As in the previous iterations, in this iteration the databases structure was modified to accommodate the data from the new data sources. However, only the hotels relational databases had their structure changed. Beyond
the
new
tables
necessary
to
hold
the
ad
hoc
reports,
accounting/financial data and the goals for the BSC tables to hold human resources data were also added. Although not foreseen being added to the prototype, when studying the implementation of the accounting ETL agent it was discovered that the information was available in the Primavera ERP and its use could be useful in terms of the prototype, as several hospitality KPIs require human resources data, therefore it was decided to add this data.
66
4.4.2.3 Software development (programming) Aside from small changes required by the users in the previous iteration that were implemented and deployed in the first days of this iteration’s development activity, no other changes or requirements were presented by the users, therefore, the development activity resumed to with programming of the Primavera ETL agent and the website/portal to implement the predefined requirements. 4.4.2.4 Deployment of the prototype version 3 (artifact) The deployment of this new version of the artifact was made on the 17th of August and involved the same preparation and actions as the previous new version deployments. Similar to the previous iterations hotels were informed of the new version’s deployment. 4.4.3 Demonstration Albeit the pre-deployment efforts to schedule meetings with the hotels for the prototype’s third demonstration activity was to be in August, as previously planned, all the hotels asked to postpone the meetings to September, due to peak season. Therefore, no demonstrations to the hotels took place in this iteration. All the implementation objectives were accomplished, but due to the hotel’s unavailability it was decided that the new features would be presented to them at the beginning of September, during the final scheduled meetings. The implemented features are described below. 4.4.3.1 Performance dashboard This page’s objective is to present to users, as they login into the system, the main operational metrics and indicators. This way users’ may have a quick glance at the operation’s performance.
67
Although the SRS document specified that users should be able to customize their own dashboards by using predefined widgets, gauges and tables, they did not show a particular interest in that feature during the previous iterations, being more concerned with the types of information they would like to have. Therefore, this functionality was not implemented in the prototype. Instead, a dashboard (as depicted in Appendix XXV) displaying the most common metrics/indicators that hotels use was implemented. Besides two charts already present in other menu options, one chart with the competitive set GRI and another with the next 14 days CI prices amplitude, this page also includes a tabled called “Operational KPIs” which introduced for the first time, the use of bullet graphs. The bullet chart is a variation of the bar chart developed by Few (2006), and widely used now in dashboards and other visual presentations, created with the objective of avoiding the communication problems that other graphs like gauges or meters have, by displaying a measure along a comparative measure and qualitative ranges to define the state of the measure. However, based on feedback obtained from the users after the new version deployment, some changes were made on the concept of the graph. This decision was made because because users expressed difficulty in understanding if the KPIs were showing a good, bad or “normal” result. Figure 4.7: Bullet chart
Source: Author’s elaboration based on Few (2006)
To bypass this problem, based on what Few (2006) calls “enrichment through evaluation” and provide users a qualitative representation to allow them a quick reading of the chart, it was decided to use colors in the chart actual
68
measurement bar. The color is selected according to the value, goal, tolerance limit(s) and the polarity20 of the metric/indicator as described in Table 4.6. Table 4.6: Bullet chart colors
Polarity Color
Band
Positive
Negative
Below tolerance limit
Above tolerance limit
Outside tolerance limits
Green
Above goal
Below goal
Inside tolerance limits
Yellow
Above tolerance limit, but below goal
Below tolerance limit, but above goal
Not used
Red
(lower and upper limits)
Source: Author’s elaboration
In this “Operation KPIs” table are displayed the KPIs performance for the previous day, MTD and YTD, along with the comparison to the same period LY. Since hotels were difficult to contact in this period of this implementation, it was decided to define a tolerance of 5% in all KPIs, based on the values from the previous year. This allowed the definition of goals to start to make sense of the data for performance evaluation. 4.4.3.2 Balanced scorecard This page was implemented as an example of the extension that the system could achieve and not as a proper implementation of a BSC, because, as previously mentioned, it’s outside this project’s scope to go over the full methodology that a BSC implementation requires. To implement this BSC a set of indicators were selected for each of the four BSC perspectives as defined by Kaplan & Norton (1992). This selection used two requirements as criteria: that would be possible to exemplify the use of 20
Polarity can be (Caldeira, 2013): - Positive: the bigger the value, the better (e.g. Total revenue); - Negative: the smaller the value, the better (e.g. Total costs); - Band: between lower and upper limits (e.g. “Number of employees per occupied room”).
69
metrics from different data sources and that their use would be relevant to the hospitality industry. As illustrated in Appendix XXVI the BSC’s format is not the most common. Even though the number of indicators was limited to the maximum of 25, since the information is gathered at least once each day, there was no need to have the “frequency” column. Also, since all indicators were calculated automatically, monthly and yearly performance values could be displayed, against the respective goals and deviations. To provide a better visualization aid, each indicator was displayed not only in numeric form, but also as a bullet graph. To make indicators more searchable a tooltip is displayed every time the user hovers the mouse over the indicator’s description. This tooltip displays not only all the data sources that are used and when the data was obtained, but also the formula used in calculating the indicator itself. In the case were accounting information is used, it also exhibits the number of the used accounts. As on the previous page, hotels didn’t have the time to provide monthly and yearly goals, therefore, for the purpose of the project, goals were manually introduced based on the previous year’s performance and arbitrary tolerance values were established. 4.4.3.3 Financial results This page presents the official financial demonstration results, as defined in the Portuguese Sistema de Normalização Contabilística (SNC), the national accounting standard for all types of businesses, but expurgating the data related with non-operating income and expenses. That is why, as shown in Appendix XXVII, it only displays values until the Net Operating Income, also known as EBITDA. The formulas used were based on what is defined by law (Portaria no 986/2009. Aprova o Sistema de Normalização Contabilística (SNC), 2009) and documentation from the national board of accounting technicians (Franco, 2010; Freitas, 2009). Nevertheless, it is worth noting that, this being a system for the hospitality industry, the format was adapted to the one used by the USALI. For this reason, Gross Operating Profit (GOP) is calculated differently from EBITDA because, as it is defined in the USALI “The summary 70
operating statement is prepared for analytical purposes and is not in accordance with generally accepted accounting principles” (American Hotel & Lodging Association et al., 2006), so that the GOP is analyzed up to the point up where the hotel manager has influence on the results. Beyond that point, the decisions that influence the results are made not by the manager, but by the board of administrators or owners. By providing this information in a friendly layout, fomenting the comparison of the last three years, it is expected that hotels get a powerful tool to faster analyze the financial results. 4.4.3.4 Ad hoc reports The last implemented page is one more suited to advanced/expert users, were they can create and modify their own reports, based on the facts and dimensions available in the dimensional database (at this phase of the prototype, the “cube” only includes facts and dimensions from the PMS data source). As seen in the examples of Appendix XXVIII, users can select themselves which measures to display as values, and select which dimensions to use in the rows and columns of the pivot table. With this pivot table it is possible for users to slice and dice, drill up/down and analyze the data from any perspective. 4.4.4 Evaluation The last evaluation activity was different from the previous ones because, as mentioned earlier, the demonstration to the users could not be executed on the planned dates, causing the final presentation to be done together with the final group interview. Nonetheless, this evaluation, in reality, was also the culmination of the data gathering process that had started with the deployment of the first version of the system. This evaluation was also different because it was more elaborated, as it involved the use of different metrics and evaluation methods in order to measure how the artifact was a solution to a problem as defined in DSRM
71
(Peffers et al., 2007). If these authors aren’t very specific about what methods should be used according to the artifact types, other authors like Hevner et al. (2004) identified five types of evaluation methods: observational, analytical, experimental, testing and descriptive. More recently, Cleven et al. (2009), having identified that there was a lack of research in this topic, introduced a framework both for the evaluation of the development process and of the artifact itself, based on a matrix of variables and values. To obtain results that could be used to answer the project’s initial questions, although Peffers et al. (2007) advocates that conceptually evaluation could include any empirical evidence or logical proof, it was decided to use a set of different methods based on the definitions by Hevner et al. (2004) and common evaluation methods used in ID (Sharp et al., 2009): •
Observational: o Field study: the use of the prototype in the participating hotels was monitored, using group interviews, but also logged information on the prototype usage.
•
Analytical: o Dynamic analysis: by logging database operations, website use, agents errors and server work variables, the performance, reliability and availability of the prototype was monitored; o Heuristic evaluation: by asking four experts21 were asked to conduct a heuristic evaluation of the prototype. The evaluation questions (see Appendix XXXII) were elaborated according the principles identified by Sharp et al. (2009).
•
Experimental: o Controlled experiment: using the development environment to test and identify problems with the artifact.
•
Testing: o Functional testing: undertaken by the prototype’s developers to identify failures and defects.
21
As presented by Sharp, Rogers, & Preece (2009) a set a number from three to five experts is considered representative.
72
The results of this last iteration evaluation activity, that encompassed the results of the previous iterations evaluation activities, are presented in the next Chapter. 4.4.5 Communication In DSRM the communication activity is of the most importance. Hevner et al. (2004) defined “communication” as one of its seven guidelines for DSR and advocate that DSR must be communicated to both technical and managerial audiences. Hevner et al. (2004) claim that communication must include sufficient detail for technology-oriented audiences to implement the artifact and use it within the appropriate organizational context, and that it should include sufficient detail for management-oriented audiences to determine if the organizational reports should be committed to the construction (or buying) of the artifact and its application for their specific organizational context. Other authors such as Zmud (1997) suggest that the presentation of DSR artifacts to managerial audiences should not emphasize in the inherent nature of the artifact itself, but on the knowledge effectively required to apply the artifact to the individual or organizational gain. But what most DSR authors like Geerts (2011), Peffers et al. (2007), Hevner et al. (2004) and Zmud (1997) agree is that the communication activity should emphasize the importance of the problem, the novelty, utility and effectiveness of the solution approach realized in the artifact. Due to the academic nature of this project, this document is naturally the communication objective of the research project. As asserted by Peffers et al., (2007), a nominal structure of an empirical research process was followed.
73
5
RESULTS
This chapter summarizes the evaluation activities results by the type of method and the order in which they were executed. 5.1
Experimental method
As is common in any software development project, experimental evaluation was conducted, mainly focused on the usability and ID of the system, during iterations 2 to 4, at the end of each of the design and development activities. Some of the issues that were found were modified, but others were left for future research or annotated to be included in a potential future commercial version of the system: •
Issues changed in the same or following iterations: o Not displaying the names of all hotels that participate in the project in the login page; o The BSC page’s format was changed in order to display information for the same time period (month and year) instead of having different periods depending on the indicator. Also, a variation column was added to allow an easy reading of the value, relative to the fixed objective; o The BSC page was redesigned so that it could be seen in different types of screens and compatible with the most popular browsers.
•
Issues annotated for future versions: o Improve the compatibility with tablets and other mobile devices; o Improve the chart resizing and reorder functionalities; o Improve the compatibility with a wider range of web browsers.
5.2
Testing
Also, as in any software development project, during the design and development activities of iterations 2 to 4, testing was conducted. In this case, the main purpose was to evaluate three issues: data quality, the rigor of the
74
metrics/indicators formulas and performance issues. From these tests some issues were found and corrected during the same iteration: •
Sometimes SR data was not updated by the supplier at the same time every day and, in one particular day, it wasn’t even updated;
•
CI (prices and inventories) agent stopped accessing the Sletoh data source;
•
In cases where the hotels had no rooms to sell online, the CI (prices and inventories) agent stopped working and generated an error, which caused other hotel’s prices and inventories tasks on queue for processing, to be left “on hold”;
•
The identification of one of the hotels that was part of the competitive set of a participating hotel was incorrect, stopping its prices and inventories from being collected;
•
In some conditions, the Primavera ERP ETL agent didn’t detect that the accounts had new transactions and therefore, didn’t assume that the data needed to be updated on the server.
Other issues were found, but since they are common software development issues, they are not mentioned here. 5.3
Observational method
Group interviews These interviews were conducted during the demonstrations of iterations 2 and 3, and again at a retrospective final interview, at the end of iteration 4. The interviews made during the walkthroughs of iterations 2 and 3 were quite informal but the last one was more formal and followed a script (see Appendix XXXI). Complementary to the script questions, the same heuristic evaluation questions that were presented to the experts (see Appendix XXXII) were also posed to the users. The interviews’ results can be summarized into the following points:
75
•
The system is of a major importance to the hotels, as it called their attention to some facts they were not aware before or, at least, not so easily and so quickly;
•
All hotels identified the speed at which they could observe the social reputation (theirs and their competitive set’s) and CI (prices and inventories) information as the two most relevant features of the system, as they enable them to quickly take actions;
•
Besides these, hotel managers and staff also mentioned they had better performance due to other information made available by the system, such as: o One hotel became aware of the fact that customers from a specific country and segment made bookings with an Average Booking Window (ABW) of more than 250 days, which meant that they already had lost their marketing window for the next season, so they decided to better plan the marketing investment for that nationality/segment in the following seasons; o The same hotel recognized that by having more timely information on the competitive set’s prices and inventories availability, in conjunction with the fact they had the better GRI in the region, they were able to increase prices and have better results; o Two hotels gave examples of how they used the SR information to involve other departments like housekeeping and reception, as a way to show them, in the weekly meetings, the quantitative values customers were assigning them in travel websites’ reviews. One of the hotels said that they were even considering the indexing of productivity prizes to the GRI; o Two hotels identified the analytic component that enables the study of the different metrics/indicators by nationalities, segments and distribution channels, as very important, since it helps them make better informed budgets, marketing plans and forecasts; o One of the hotels gave an example where the CI information called their attention to the electronic distribution, because it made them understand that, by having more rooms sold through that type of distribution they could have faster results for their actions 76
(until now, they work preferentially with “traditional tour operators”, but henceforward they are considering changing that policy); o One hotel, after analyzing the different ABW and Average Length of Stay (ALOS) patterns according to the distribution channels and nationalities of the customers, decided they need to hire or train someone in RM, to maximize the results in some of the segments; o Three hotels reported that they thought the ad-hoc reports have a lot of potential as an analytical tool, but they require more training and practice time before they can take advantage of it; o Two of the hotels said that they planned to use the analytical functionalities to better understand patterns and trends and with that, create better targeted Google Ads campaigns; •
All hotels said they started giving even more importance to SR;
•
Some data quality issues were identified in all hotels, namely: o One hotel had too many bookings with a zero booking window. It was found that some users weren’t following internal procedures when correcting invoices; o The same hotel also detected that deposits were being processed as room revenue on the date they were received, which adulterated their revenue reports. They have decided to change that from the beginning of next year; o One hotel had all its rooms configured with a maximum persons capacity of two, when some of the rooms could have three or four persons. This influenced some of the benchmarking metrics. They decided to revise this; o Another hotel had a lot of bookings with no distribution channel assigned to them, which they corrected afterwards; o Two hotels found problems with the attribution of nationalities to the guests; o The delay in the update of some of the hotels accounting information has been discussed and decisions to shorten that delay have been made. In some cases it was more than three months.
77
•
In terms of features, the hotels made some proposals on what to consider in future versions of the system, if it is to be considered for commercial purposes: o One hotel proposed the integration with Google Analytics and the hotel e-commerce/website platform, so that their metrics/indicators could also be viewed in the dashboards; o The same hotel also said that the system should have CI (prices and inventories) in a window of 90 days and not only 14 as it is currently; o Two hotels mentioned that a feature to compare prices parity in the different OTA’s could also be a beneficial feature in future versions; o Three hotels identified forecasting, “what if scenarios” and pricing recommendations as features that could bring more value to the system.
•
Although all the hotels said the system is easy to use and “user friendly”, due to its analytic capabilities and some of the more advanced concepts, they all agree that training is required prior to starting to use the system;
•
In terms of what the hotels would change in the current system the following suggestions were made: o One hotel mentioned the colors of each hotel in the CI (prices and inventories) page should have more contrast; o Another hotel said that weather information was irrelevant and it should be removed; o Another hotel mentioned that in all charts where information is displayed per week, it should display the first and last date of the week, as it’s hard for them to identify the week by the number.
•
All hotels asked until when they could continue to use the system, since they all think that after the peak season, they can even make better use of it, than they did during the evaluation period.
78
5.3.1 User information logs These results were compiled from the system logs and are about the period of the 1st of July until the 31st of August, a total of 62 days. All logs are from hotel’s users only. Data from other system users (e.g. developers) wasn’t accounted for. These logs enable the study of three types of usage: •
Total number of logins;
•
Number of pages visited by users (clicked and entered);
•
The time users spent within those pages.
Figure 5.1 shows the number of logins, per hotel, per day. A login was considered each time a hotel user identified himself/herself in the login page, was correctly authenticated and redirected to the default page of the website. If the same user logged into the system two times a day, it was considered “2 logins”. Figure 5.1: Logins per hotel, per day
Source: Author’s elaboration
To study which pages/menu options the users visited, a table with the number of visits each hotel user entered in each page/menu option was constructed (Table 5.1).
79
Table 5.1: Absolute number of visits per page/menu option
Source: Author’s elaboration
However, the absolute number of visits can’t be considered the most correct metric to evaluate this, as the data collected is from the 62 days of total evaluation, but some pages/options were only available for the users for 34 or 15 days (after demonstration activities of iterations 3 and 4). To compensate for this factor, another table was created where the number of visits was multiplied by a weighted number of available days calculated using the formula (1). The adjusted weighted table can be seen in Table 5.2. !"
1 𝑥 = !"#$%& !" !"#$ !"#$%&"! !"#$
Table 5.2: Weighted number of visits per page/menu option
Source: Author’s elaboration
The time that each user spent on each page can also be an important measure of the relevance of the information on the page to the user.
80
Table 5.3 shows the absolute time (in seconds) that each user, per hotel, spent on each page, independently of the number of times he visited the page. Table 5.3: Absolute time spent (in seconds) per page/menu option
Source: Author’s elaboration
As for the number of visits per page, since not all pages/options were available to users for the same time, the same weighted formula was applied to the values of Table 5.3 to have a weighted time spent per page (see Table 5.4). Table 5.4: Weighted time spent (in seconds) per page/menu option
Source: Author’s elaboration
Globally, as better depicted in Figure 5.2 and Figure 5.3 there is a distinction between the pages that users most visited, and the pages where they spent the most time. The system also logged changes to the configuration of each page refresh time (per user), but only one user in H3 change the “weather – current/forecast” default value. Regarding the re-configuration of the pages (resize and reorder) no user changed the default disposition.
81
Figure 5.2: Weighted global visits per page
Source: Author’s elaboration
Figure 5.3: Weighted global time spent per page
Source: Author’s elaboration
82
5.4
Analytical
5.4.1 Server performance Before the deployment of any of the system components on the server, with the SQL server already running, the server CPU was running between 2% to 3% of its maximum performance. With the deployment of the orchestrator, the weather, CI (prices and inventories) and SR agents, that value increased to values that oscillated between 10% and 14%. Even though there are other resources that consume disk space, the major share of this consumption is made by the system’s databases; therefore, only measures of their size (at the end of this evaluation period – see Table 5.5) are presented in this document.
Table 5.5: Databases size
Identification
Transactional
Dimensional
8.3 Gb
N/A
H1
475.8 Mb
14.1 Mb
H2
658.6 Mb
17.3 Mb
H3
662.6 Mb
16.7 Mb
H4
500.8 Mb
10.7 Mb
Master
Source: Author’s elaboration
In terms of server availability and response to users, Internet Information Server (IIS), windows and communication logs confirm a rate 100% time availability of the system (except from the foreseen short periods during the deployment of new versions – never longer than one hour) and no major errors are identified in the above-mentioned logs.
83
5.4.2 Data sources Although most of the general characteristics of primary and secondary data, as defined by Rabianski (2003), were found in the data sources used some issues were detected (some of which were also identified by users in the demonstration activities): •
Accounting/financial: o Appropriateness: since the hotels didn’t have analytical accounting (two of them were implementing) it was hard to correctly separate the values related to hotel operations from those that weren’t so (for e.g. property sales or timesharing operations); o Timeliness: as previously mentioned, even though the system was prepared to collect data every day, the accounting schedule on most hotels was delayed, ranging from two weeks, up to about three months; o Reliability: it wasn’t possible to assess, but more than once and in more than one of the hotels the local ETL agent was turned off, maybe due to security checks carried out automatically or by system’s supervisors not being fully informed about the project by their general managers, which meant that that until the situation was noticed, no data was uploaded to the server.
•
PMS: o Accuracy:
two
hotels
found
problems
in
the
bookings
classification. These were not serious problems, but problems like bookings created without distribution channel assignment or a large number of bookings mistakenly created on the arrival day, affected the veracity of the information displayed; o Reliability: as mentioned above, for the accounting and financial data, more than once and in more than one hotel, the local ETL agent was turned off, which affected the data source’s reliability. •
CI (prices and inventories):
84
o Reliability: as mentioned previously, Sletoh (the first data supplier chosen) changed their conditions after the first version was deployed so another provider had to be selected (Itsys). In the meantime, from the 9th to the 14th of July, no such data was collected; o Accuracy: both suppliers don’t harvest data from all OTA’s websites, just a few of the major ones (Itsys even less than Sletoh), so in reality, the sampled data doesn’t represent all the population. 5.4.3 Security Due to the nature of the data that the system uses, particularly the operational (PMS) and financial or accounting data, a high level of security was expected from the system. To assess the server’s security level, a test was made with the help of nmag tools22. The results for this test can be seen in Appendix XXX. 5.4.4 Heuristic evaluation From the heuristic evaluation made by the four experts in IS and hospitality systems, based on the questions presented in Appendix XXXII, the following results were compiled: •
In the heuristic evaluation guidelines on internal consistency, memory load and error prevention the experts did not report any issues or problems;
•
In terms of the simplicity of the dialogs and shortcuts all agreed that the system presents dialogs in a simple way and that it’s easy to use, but some metrics/indicators as well as some concepts are not very common, therefore, training for users should be provided to clarify this. Also, three of the experts also mentioned that the “Ad hoc reports” functionality should be for advanced users, hence it should require advanced training;
22
More information available at http://nmag.org.
85
•
In terms of feedback to users, one expert identified that in some longer queries in the “Ad hoc reports”, better information on what the system is processing should be provided to the users;
•
Regarding the “internal locus of control” point, two experts identified a need for an “undo” button in the “Ad hoc reports” option.
5.4.5 Hotels performance Although there wasn’t enough elapsed time from the end of the evaluation period (31st of August) to the scheduled date to submit this master’s project document to have official regional or national numbers to benchmark the participating hotels performance, Table 5.6 displays some common hospitality measures/metrics obtained during that period (by month) and their comparison with the same time period in the previous year, for each of the participating hotels and for the STR competitive set. Table 5.6: Common hospitality measures/metrics performance comparison
Source: Author’s elaboration
86
6
DISCUSSION
There is no doubt that the results shown helped answer the research questions. There is unanimity among hotels, users and experts about the technical feasibility and the market opportunity to transform the prototype into a commercial product since the hospitality professionals that used it during the testing period reported that the information it provides is of great relevance. To better interpret the results, they are presented from three different perspectives:
6.1
•
Technical;
•
Business;
•
Holistic. Technical perspective
Here, the system’s technical results of the system and their relevance to answer the research questions are interpreted, mainly “Q1 - Are there any technical issues that can limit the scope and performance of the system itself?” In the design of the system (see SRS document in Appendix V) three main technical objectives were established: 1. Evaluate potential problems with data accessibility and availability; 2. Understand potential problems with data quality; 3. Test the performance of the cloud environment. As Eckerson (2011) and Cokins (2009) stated, data is at the center of all PM processes. Assuring data is available, accessible and accurate in a timely manner is critical for a dashboard (Lorence, 2010b), thus, validating technical objectives 1 and 2 was very important for the outcome of this project. Although some issues were identified with the data sources, mainly involving appropriateness, timeliness, reliability and accuracy characteristics, mostly in the internal data sources (PMS and accounting), but also in the CI (prices and inventories), except for the accounts redefinition of the accounting system,
87
these issues were promptly solved or a solution was envisaged, as to the how and when. However, the redefinition of accounts in the accounting/financial system requires the existence of an analytical accounting system, since common hospitality metrics and indicators can’t be properly calculated based on financial accounting only. For instance, the companies that manage H1 and H4 also have real estate and timeshare/fractional ownership operations integrated in their accounting system. Since the financial accounting system did not separate each operation by its nature, the calculation of indicators as important as the Gross Operating Profit per Available Room (GOPPAR) (Mayock, 2014; Hayes & Miller, 2011; Kimes, 2010) didn’t reflect the reality of the hospitality operation, making it useless to measure an important aspect of the hotel’s performance. The problem that occurred with the initial supplier of CI (prices and inventories) data, causing the unavailability of that type of data for almost one week, forced the elaboration of two options, in the eventuality of the development of a commercial
version
of
the
prototype:
the
development
of
a
web
harvesting/scraping agent for the system (as initially designed in the SRS document) or contracting the service to a third party, but including a Service Level Agreement contract with highly penalizing clauses to prevent service unavailability. Due to the importance of CI as stressed by the hotels and as identified by prior research (Sauter, 2010; Davenport & Harris, 2007; Liebowitz, 2006), this should be a topic for future consideration and research. Even though some issues were found, it’s possible to infer that the two first technical objectives, about the data sources, were achieved. The results also demonstrated that the third objective, the system’s test in a cloud environment was also achieved with excellent results. The results show that, by using an agents-based architecture and a resilient distributed computing platform, as defined by Svobodova (1984), the main requisites for the SaaS/cloud based system (fault tolerance, load balancing, among others) (Rimal, Choi, & Lumb, 2009) were also achieved.
88
Although in the system’s concept presentation to the hotels some concerns on confidentiality and information were raised, as the group interviews revealed, the security measures put in place, corroborated by the results of the subsequent tests, led to the understanding/perception that the system could be distributed as a SaaS/cloud system with almost no risk. This is in line with what Demirkan
&
Delen
(2013)
concluded.
These
authors
advocate
that
organizations greatly benefit by using service-oriented, cloud-based DSS that bundle operating systems, data warehouses, online analytical processing and end-user components, as they facilitate economies of scale, scope and speed that exceed the potential risks in security, service level or data governance. Furthermore, as evidenced by Benlian, Hess, & Buxmann (2009), the adoption of SaaS applications is rapidly increasing. 6.2
Business perspective
Here, the results are interpreted from business/management perspective, mainly to answer the research questions: “Q2 - Does the hotel staff identify the benefits of using the system?” and “Q3 - Is it possible to identify quantifiable improvements in the hotels performance?” Regarding Q2, from a qualitative approach, based on what was declared by the users in the group interviews and from what was observed, considerable benefits identified. Although users recognized that during the evaluation period the main areas where they got benefits from were SR and CI, they acknowledge that bigger and better benefits could be obtained by using the system’s analytic features to recognize trends and patterns, in the different customer segments. Users confirmed that the fact that the system brought SR and CI information to them in an easier and more accessible way than they previously had. This together with the hotels’ increasing comprehension of the importance that SR (Abdelfattah, 2013; Anderson, 2012; Callarisa et al., 2012; Öğüt & Onur Taş, 2011; Sparks & Browning, 2011) and CI (C.-C. Chen & Schwartz, 2013; Hayes & Miller, 2011; Enz & Canina, 2010) have in today’s hospitality performance,
89
contributed as recognized by the users and registered by the logs (section 5.3.1), for SR and CI pages to be the most visited and where most time was spent. Also, looking at the log results, it is possible to confirm that almost two thirds of the logins were made during the month of July when, practically, only the weather, SR and CI pages were available. The month of August (peak of the season), even with more pages added to the system, only accounted for one third of the logins. This is probably due to the fact that, during the peak season, users were more concerned about operational than strategic matters. Nonetheless and albeit the short evaluation period, users were able to explore the analytic capabilities of the system. The number of visits and time spent on the PMS scorecard and analytics pages (only surpassed by the SR and CI pages) proves this. Moreover, the fact that in the group interviews the users recognized that they did not taken advantage of the full potential of the system, that they could use the system to execute better forecasts, better marketing plans and also, define budgets and communicate those budgets/goals to every hotel department, revealed that they understood what information they could obtain from the system and how to use it. Despite the increasing importance that benchmarking has as a tool to assess the performance of organizations, particularly in hospitality and tourism (Battersby, 2006; Kozak & Nield, 2001; Pyo, 2001), the results show that both the pages on market supply and demand benchmarking (official entities and STR) where among the least visited and used. However, this by itself doesn’t mean that users don’t consider it importance. As these metrics/indicators are updated only once a month, there is not much need to constantly verify them, at least accordingly to what was reported by the users. The same can’t be said for weather options and the ad hoc reports. If for the weather pages, at least one hotel said that they should be taken out of the system considering it unnecessary (contradicting the importance of weather in the economic performance of the hotels as presented in Chapter 3), for the ad
90
hoc reports page, the fact that it wasn’t much used, is related to the fact that it required more training and was only available in the last iteration, when most of the users didn’t have the time to use the system for more analytical and time consuming tasks, nor did they have time for better training. 6.3
Holistic perspective
From a global perspective, several important results were found: •
One of the hotels was able to raise its online prices by making use of its SR better ranking and better/faster notion of the prices of its competitive set;
•
Another hotel made changes after introducing the GRI analysis in its weekly housekeeping and reception departments’ meetings, stressing the importance of their service quality to achieve better rankings;
•
Other hotels identified several areas where they could take advantage of the analytical capabilities of the system;
•
Others stated that the system helped users make faster and better informed decisions, which is in accordance with Eckerson (2011) who wrote that there are three major benefits of a PM system: improved communication, improved coordination and improved control.
These and other examples given by the hotels on how they used the system metrics/indicators (see section 5.3), ratify the validity of the system as a tool to provide feedback and enable faster adoption/correction of actions to better align the hotel’s performance with its strategy and goals. Due to the users feedback and to the time constraint imposed by the school calendar, some of the features specified in the SRS document (see Appendix V) were deliberately removed from the prototype, which does not mean that they have to be removed from the “complete” system, on the contrary. Some of these features are part of the previously cited “three threes” features that a PM system must have as defined by Eckerson (2011):
91
•
Three applications: o Management: support for user collaboration was removed because it was observed that hotels were only engaging managers in the project and even they had little time to use the system, since the evaluation period, as described earlier, happened during the high season.
•
Three layers: o Detailed, transactional data: support for users reach to the transactional data was not provided, as it would require more development time and the users never raised the need for it in any of the demonstration/evaluation activities.
The fact that these features were not implemented and that the hotels didn’t even bring them up to discussion in the group interviews, not even as features that should be implemented in future versions, doesn’t mean that they wouldn’t benefit from their use. However, the fact that all participating hotels established that only general managers and assistant managers had access to pages where financial metrics/indicators were displayed (financial results and BSC pages), means that it shouldn’t be easy for hotels to use that type of metrics/indicators to communicate strategy and foster collaboration among staff. This could indicate that some mentality issues must be addressed prior the implementation of a PM system (Cokins, 2009; A. A. de Waal & Counet, 2009). Although the number of logins in the system could be considered low for two of the hotels, given the fact that the project was of academic and temporary nature, the period where the evaluation took place and that was not applied in the context of a full organizational PM implementation, the global results should be considered important, predominantly due to positive feedback given by the users on the system relevance. This highly positive feedback, not only on the aspects that users already used as an advantage, but also on what they identified that they can benefit in the future, mitigates the fact that at this time, is not possible to quantify the impact of the system on the participating hotel’s performance.
92
7
CONCLUSIONS
Looking to the system as an integrated and comprehensive solution, designed in accordance with DSRM (Peffers et al., 2007) to address an unsolved problem in a unique and innovative way (Hevner et al., 2004), it is possible to say that the objective of confirming the viability of developing a commercial service was achieved. Since no layered information system specific for the hospitality industry, allowing users to measure, monitor and manage business performance, thus enabling faster and better information-based decisions was found on the market, it was decided to build a prototype to assess the system suitability to address this “problem” (March & Storey, 2008). Even though the system’s complexity required a long development period and the academic calendar caused constraints on the time to evaluate the prototype in hotels, it was decided that the evaluation in “real conditions” would be beneficial to accomplish the research objective, even if that meant having a short evaluation period, in the high season. The implementation and evaluation of the prototype in four hotels confirmed the fulfillment of the two fundamental requirements a DSR artifact should have: relevance and rigor. Relevance, by addressing a real business need and rigor, by appropriately applying the existing body of knowledge (Cleven et al., 2009; Hevner et al., 2004). The prototype enabled hotels not only to have access to dashboards with timely key metrics/indicators from different data sources (operational, financial, social reputation, competitive intelligence, market benchmarking and weather) and, from a single system, measure and monitor the hotels performance, but also provided analytical capabilities, essential for performance optimization and strategic objectives persecution (Eckerson, 2011; Davenport & Harris, 2007). The results obtained from the prototype evaluation in the hotels strongly support the system’s viability in the three initially defined perspectives:
93
•
Q1 - Are there any technical issues that can limit the scope and performance of the system itself?
•
Q2 - Does the hotel’s staff identify the benefits of using the system?
•
Q3 - Is it possible to identify quantifiable improvements in the hotels performance?
The system usage logs and other performance logs confirms the adequacy and suitability of the system architecture and implementation, thus answering Q1 positively. The users highly positive feedback validates Q2 and supports Q3. Although the STR competitive set operating indicators performance seemed to be aligned with the performance of the indicators of hotels H2, H3 and H4, at this moment, with the information available is not possible to establish any relation to the implementation of this system and reach objective conclusions regarding Q3. However, the overall results complemented by the request of all the participating hotels to continue to use the prototype and their willingness to pay for a commercial service that provides the same information as the prototype, confirms its commercial viability. Moreover, this project also created an appealing by-product, the hotels’ dimensional databases, that can be used in other systems (e.g. Central Reservation Systems, Revenue management Systems or Self-Service BI systems), thus leveraging their potential. In addition, this project also confirmed, as challenged by van Aken (2005, 2004), that technologic solution-oriented research, based in the design sciences, can be used to solve relevant problems in management. 7.1
Limitations and recommendations
It’s possible to conclude that the system is viable from the technical and market acceptance perspectives. However, from a business perspective, since that was outside the scope, further research is required to determine it, probably with the elaboration of a business plan.
94
However, even on the technical aspect, to translate this prototype to a commercial service, the evaluation revealed that there are still some situations that should be implemented or revised, namely: •
Better multi-browser and multi-device compatibility;
•
Revision of UI features identified by users (colors in CI prices charts);
•
Dates on weeks labels;
•
Use “friendly” names on the facts and dimensions of the ad hoc reports page, etc.);
•
Creation of a back-office so that system administrators can themselves create users, enter budgets and KPIs goals/tolerances.
Complementary to the capabilities and other functionalities that some of the participating hotels suggested to be available in a commercial version, others were identified and have the potential to increase the value of the system. The complete list capabilities and functionalities is presented here: 8
Inclusion of additional data sources like hotel website analytics, airport arrivals, official tourism forecasts for the region, among others, that could strengthen even more the analytics capabilities, in accordance to what Cokins (2009) advocates for PM systems and to what Piccoli et al. (2011) defined in their electronic maturity model for hospitality organizations;
9
Users should be able to create their own metrics/indicators and define where they want to put them on their personal dashboard and BSC;
10 Users should be able to create and program visual or email alerts based on the behavior of metrics/indicators; 11 The CI page should be able to have prices and inventories from the competitive set, at least, up to 120 days in advance; 12 The CI page should have a chart to compare the parity of prices between the different OTA’s; 13 Inclusion of forecast and “what-if scenarios” that with the use of the different data sources data can help users do better planning. Some of the limitations found during the development of the system, like the short evaluation period, the time of the year that evaluation took place (peak
95
season), the system not being implemented as part of the organization’s strategy and planning processes (if the strategy/processes are unclear, unaligned or uncoordinated) and the lack of commitment to involve all hotel staff on the prototype implementation, are some of the issues that should be addressed and taken into consideration in further PM research or in the implementation of PM systems. Another limitation to the project was what was found during the implementation of the financial results and the creation of the BSC: the difficulty to have timely and accurate operating values from the accounting system. To some extent, this could also be related to the hotels not having a clear strategy or to that strategy not being aligned/coordinated with the operation, which translates in the financial accounts not reflecting the operational accounts. To overcome this, hotels should have cost accounting or at least, separate accounts for the hospitality business area and for the other business areas that the hotel’s parent companies work with. Also very important, is the need for the accounting system to have updated information. Otherwise important indicators like GOP, GOPPAR, Total Revenue Per Square Foot (Kimes, 2010), among others, can’t be used, as their values won’t reflect the authenticity at each given moment. This limitation could also be the subject of further research, since, although at different degrees, it was verified in all the participating hotels. Although Q3 could be considered answered positively by the results identified by the users, one other limitation was the inexistence of official benchmark indicators to complement this answer. To solve this, the time elapsed between the evaluation period on the hotels and the communication of the results should be bigger, so that the publication of regional official statistics together with the STR reports could allow the comparison of the hotel’s KPIs with the region’s ones. In alternative, a control group could be used to compare the performance results between participating and non-participating hotels. Any of these solutions could be of considerable pertinence to validate Q3.
96
BIBLIOGRAPHIC REFERENCES Abdelfattah, M. (2013). A comparison of several performance dashboards architectures. Intelligent Information Management, 05(02), 35–41. doi:10.4236/iim.2013.52005 Abildgaard, T., Bell, T., & Poulsen, D. (2009, May 29). Combining Design Science and Agile tools. Retrieved February 16, 2014, from http://vbn.aau.dk/ws/files/61074999/1243579599.pdf Allen, B., Bresnahan, J., Childers, L., Foster, I., Kandaswamy, G., Kettimuthu, R., … Tuecke, S. (2012). Software As a Service for Data Scientists. Communications of the ACM, 55(2), 81–88. doi:10.1145/2076450.2076468 Allio, M. K. (2012). Strategic dashboards: designing and deploying them to improve implementation. Strategy & Leadership, 40(5), 24–31. doi:10.1108/10878571211257159 Amadeus. (2013, July 24). Travel industry stands at a “big data crossroads.” Retrieved October 30, 2013, from http://www.4hoteliers.com/features/article/7781?awsb_c=4hdm&awsb_k =dnws American Hotel & Lodging Association, Hospitality Financial and Technology Professionals, & Hotel Association of New York City. (2006). Uniform system of accounts for the lodging industry (10th revised ed.). Lansing, MI, USA: American Hotel & Lodging Educational Institute. Anderson, C. K. (2012). The impact of social media on lodging performance. Cornell Hospitality Report, 12(15), 4–11. Ballard, C., White, C., McDonald, S., Myllymaki, J., McDowell, S., Goerlich, O., & Neroda, A. (2005). Business Performance Management... Meets Business Intelligence. New York, NY, USA: IBM. Battersby, D. (2006, November 2). Importance of benchmarking. Caterer & Hotelkeeper, pp. 18–18. Beaudouin-Lafon, M., & Mackay, W. (2003). Prototyping tools and techniques. In J. A. Jacko & A. Sears (Eds.), The human-computer Interaction Handbook (pp. 1006–1031). Hillsdale, NJ, USA: L. Erlbaum Associates Inc. Benlian, A., Hess, T., & Buxmann, P. (2009). Drivers of SaaS-Adoption – An empirical study of different application types. Business & Information Systems Engineering, 1(5), 357–369. doi:10.1007/s12599-009-0068-x Bichler, M., & Kwei-Jay, L. (2006). Service-oriented computing. Computer, 39(3), 99–101. doi:10.1109/MC.2006.102
97
Bititci, U. S., Mendibil, K., Nudurupati, S., Garengo, P., & Turner, T. (2006). Dynamics of performance measurement and organisational culture. International Journal of Operations & Production Management, 26(12), 1325–1350. Bose, R. (2009). Advanced analytics: opportunities and challenges. Industrial Management & Data Systems, 109(2), 155–172. doi:10.1108/02635570910930073 Brown, M. G. (1996). Keeping Score: Using the right metrics to Drive worldclass performance. New York, NY, USA: AMACOM/American Management Association. Caldeira, J. (2010). Dashboards: Comunicar eficazmente a informação de gestão. Coimbra, Portugal: Almedina. Caldeira, J. (2013). 100 Indicadores da gestão. Coimbra. Portugal: Actual. Callarisa, L., García, J. S., Cardiff, J., & Roshchina, A. (2012). Harnessing social media platforms to measure customer-based hotel brand equity. Tourism Management Perspectives, 4, 73–79. doi:10.1016/j.tmp.2012.04.005 Cao, L., & Ramesh, B. (2008). Agile requirements engineering practices: An empirical study. Software, IEEE, 25(1), 60–67. doi:10.1109/MS.2008.1 Castain, R. H., & Squyres, J. M. (2007). Creating a transparent, distributed, and resilient computing environment: the OpenRTE project. The Journal of Supercomputing, 42(1), 107–123. doi:10.1007/s11227-006-0040-1 Chen, C.-C., & Schwartz, Z. (2013). On revenue management and last minute booking dynamics. International Journal of Contemporary Hospitality Management, 25(1), 7–22. doi:10.1108/09596111311290192 Chen, C., Härdle, W., & Unwin, A. (2008). Handbook of data visualization. Berlin, Germany: Springer. Chen, H., Chiang, R. H., & Storey, V. C. (2012). Business Intelligence and Analytics: From big data to big impact. MIS Quarterly, 36(4), 1165–1188. Chen, Y.-C., Wang, W.-C., & Chu, Y.-C. (2011). A case study on the business performance management of Hilton hotels corporation. International Business Research, 4(2), 213–218. doi:10.5539/ibr.v4n2p213 Chiang, W.-C., Chen, J. C. H., & Xu, X. (2007). An overview of research on revenue management: current issues and future research. Internanational Journal Revenue Management, 1(1), 97–128. doi:10.1504/IJRM.2007.011196 Cleven, A., Gubler, P., & Hüner, K. M. (2009). Design alternatives for the evaluation of Design Science research artifacts. In Proceedings of the 4th International Conference on Design Science Research in Information
98
Systems and Technology (pp. 19:1–19:8). New York, NY, USA: ACM. doi:10.1145/1555619.1555645 Cokins, G. (2009). Performance management: Integrating strategy execution, methodologies, risk, and analytics. Hoboken, NJ, USA: John Wiley & Sons, Inc. Coleman, K. (2013a, March 5). Business intelligence. What it is and why It matters to hospitality. Retrieved October 27, 2013, from http://www.intelligent-hospitality.com/news/article-by-kevin-colemanbusiness-intelligence-what-it-is-and-why-it-matters-to-hospitality/ Coleman, K. (2013b, April 19). Hotel Business Intelligence begins with data, data management begins with BI. HotelMarketing.com. Retrieved from http://hotelmarketing.com/index.php/content/article/hotel_business_intelli gence_begins_with_data_data_management_begins_with_bi Conway, D. (2010, September 30). The data science Venn diagram. Retrieved January 1, 2014, from http://drewconway.com/zia/2013/3/26/the-datascience-venn-diagram Creamer, D. (2013, February 13). Tech secrets behind revenue management success. Hospitality Magazine. Retrieved from http://hospitalitytechnology.edgl.com/top-stories/Tech-Secrets-BehindRevenue-Management-Success84719 Cruz, I. (2007). How might hospitality organizations optimize their performance measurement systems? International Journal of Contemporary Hospitality Management, 19(7), 574–588. doi:10.1108/09596110710818310 Cuddeford-Jones, M. (2013). Effective revenue management in the hospitality industry. London, UK: Eye For Travel. Retrieved from http://www.eyefortravel.com/revenue-and-data-management/effectiverevenue-management-hospitality-industry-white-paper Danubianu, M., & Hapenciuc, V. C. (2008). Improving Customer Relationship Management In hotel industry by Data Mining techniques. Annals of the University of Craiova, Economic Sciences Series, 7(36), 3261. Davenport, T. H. (2006). Competing on analytics. Harvard Business Review, 84(1), 98. Davenport, T. H., & Harris, J. G. (2007). Competing on analytics: The new science of winning. Boston, MA, USA: Harvard Business School Press. Day, J., Chin, N., Sydnor, S., & Cherkauer, K. (2013). Weather, climate, and tourism performance: A quantitative analysis. Tourism Management Perspectives, 5, 51–56. doi:10.1016/j.tmp.2012.11.001 Dean, S. F. (2011, March 22). Hotel business intelligence seeking its identity. HotelNewsNow.com. Retrieved from 99
http://www.hotelnewsnow.com/Article/5212/Hotel-business-intelligenceA-teenager-seeking-its-identity Demirkan, H., & Delen, D. (2013). Leveraging the capabilities of serviceoriented decision support systems: Putting analytics and big data in cloud. Decision Support Systems, 55(1), 412–421. doi:10.1016/j.dss.2012.05.048 Dover, C. (2004). How dashboards can change your culture. Strategic Finance, 86(4), 43–48. Drucker, P. F. (1993). Management: Tasks, responsibilities, practices. New York, NY, USA: Harper Business. Eckerson, W. W. (2004). Best practices in business performance management: business and technical strategies. The Data Warehouse Institute (TDWI). Retrieved from http://download.101com.com/tdwi/research_report/2004_Best_Practices _Business_Report.pdf Eckerson, W. W. (2009). How to create and deploy effective metrics. The Data Warehouse Institute (TDWI). Retrieved from http://tdwi.org/research/2009/01/bpr-1q-performance-managementstrategies.aspx Eckerson, W. W. (2011). Performance dashboards measuring, monitoring, and managing your business (second ed.). Hoboken, NJ, USA: John Wiley & Sons, Inc. Enz, C. A., & Canina, L. (2010). Competitive pricing in European hotels. In J. S. Chen (Ed.), Advances in Hospitality and Leisure (Vol. 6, pp. 3–25). Emerald Group Publishing Limited. Few, S. (2006). Information dashboard design. Sebastopol, CA, USA: O’Reilly. Folan, P., & Browne, J. (2005). A review of performance measurement: Towards performance management. Computers in Industry, 56(7), 663– 680. doi:10.1016/j.compind.2005.03.001 Franceschini, F., Galetto, M., & Maisano, D. (2007). Management by measurement: Designing key indicators and performance measurement systems. Berlin, Germany: Springer. Franco, P. (2010, January). POC versus SNC explicado. Retrieved March 2, 2014, from http://www.otoc.pt/fotos/editor2/SNC_web_12MAR.pdf Franco-Santos, M., Lucianetti, L., & Bourne, M. (2012). Contemporary performance measurement systems: A review of their consequences and a framework for research. Management Accounting Research, 23(2), 79–119. doi:10.1016/j.mar.2012.04.001
100
Freitas, G. (2009). O sistema de normalização contabilistica. Preparação das demonstrações financeiras. Retrieved February 3, 2014, from http://www.otoc.pt/fotos/editor2/sebenta_dis3109.pdf Gambhir, A. (n.d.). Understanding the new hotel performance dashboard. Retrieved October 27, 2013, from http://hotelexecutive.com/business_review/3037/understanding-the-newhotel-performance-dashboard Garret, G. (2012). How to create a business intelligence strategy. Presented at the SAS Global Forum 2012, Orlando, FL, USA. Retrieved from http://support.sas.com/resources/papers/proceedings12/021-2012.pdf Garrow, L., & Ferguson, M. (2008). Revenue management and the analytics explosion: Perspectives from industry experts. Journal of Revenue & Pricing Management, 7(2), 219–229. doi:10.1057/rpm.2008.3 Geerts, G. L. (2011). A design science research methodology and its application to accounting information systems research. International Journal of Accounting Information Systems, 12(2), 142–151. doi:10.1016/j.accinf.2011.02.004 Göbel, H., & Cronholm, S. (2012). Design science research in action experiences from a process perspective. Presented at the IT Artefact Design & Workpractice Intervention, Barcelona, Spain. Retrieved from http://www.vits.org/uploads/IT_Artifact/Design_Science_Research_In_Ac tion.pdf Gonzalez, R. A., & Sol, H. G. (2012). Validation and design science research in information systems. In M. Mora, O. Gelman, A. L. Steenkamp, & M. Raisinghani (Eds.), Research Methodologies, Innovations and Philosophies in Software Systems Engineering and Information Systems (pp. 403–426). Hershey, PA, USA: IGI Global. Haktanir, M., & Harris, P. (2005). Performance measurement practice in an independent hotel context: A case study approach. International Journal of Contemporary Hospitality Management, 17(1), 39–50. doi:10.1108/09596110510577662 Hales, J. A. (2005). Accounting and financial analysis in the hospitality industry. Burlington, MA, USA: Elsevier Butterworth-Heinemann. Harris, P. J., & Mongiello, M. (2001). Key performance indicators in European hotel properties: general managers’ choices and company profiles. International Journal of Contemporary Hospitality Management, 13(3), 120–128. Hayes, D. K., & Miller, A. A. (2011). Revenue management for the hospitality industry. Hoboken, NJ, USA: John Wiley & Sons, Inc. Henschen, D. (2013, July 3). Big data analysis drives revolution In travel. Retrieved October 31, 2013, from http://www.informationweek.com/big101
data/commentary/big-data-analytics/big-data-analysis-drives-revolutionin-t/240157769 Hevner, A. R., March, S. T., Park, J., & Ram, S. (2004). Design science in information systems research. MIS Quarterly, 28(1), 75–105. Hope, J., & Player, S. (2012). Beyond performance management: Why, when, and how to use 40 tools and best practices for superior business performance. Boston, MA, USA: Harvard Business School Publishing. Howard, P. (2013, September). Considerations for maximising analytic performance. Bloor. Retrieved from http://public.dhe.ibm.com/common/ssi/ecm/en/iml14378usen/IML14378U SEN.PDF Howson, C. (2007). Successful business intelligence: Secrets to making Bl a killer app. New York, NY, USA: McGraw-Hill Osborne Media. Hubbard, D. W. (2010). How to measure anything finding the value of “intangibles” in business (second ed.). Hoboken, NJ, USA: John Wiley & Sons, Inc. Huefner, R. J., & Largay III, J. A. (2008). The role of accounting information in revenue management. Business Horizons, 51(3), 245–255. doi:10.1016/j.bushor.2008.01.013 Hursman, A. (2013, October 16). Effective dashboard design. Technology. Retrieved from http://www.slideshare.net/hursman/effective-dashboarddesign-presentation IEEE Computer Society. (1998). IEEE recommended practice for software requirements specifications (IEEE Std 830-1998). New York, NY, USA: Institute of Electrical and Electronics Engineers. Inmon, W. H. (2002). Building the data warehouse (3rd ed.). New Jersey, NJ, USA: John Wiley & Sons, Inc. Instituto Nacional de Estatística. (2013, July). Estatísticas do Turismo 2012. Retrieved November 3, 2013, from http://www.ine.pt/ngt_server/attachfileu.jsp?look_parentBoui=162530912 &att_display=n&att_download=y Instituto Nacional de Estatística. (2014, July). Estatísticas do Turismo 2013. Retrieved July 26, 2014, from http://www.ine.pt/ngt_server/attachfileu.jsp?look_parentBoui=219354880 &att_display=n&att_download=y Ip, C., Leung, R., & Law, R. (2011). Progress and development of information and communication technologies in hospitality. International Journal of Contemporary Hospitality Management, 23(4), 533–551. doi:10.1108/09596111111130029
102
Ivankovič, G., Janković, S., & Perišić, M. (2010). Framework for performance measurement in hospitality industry - case study Slovenia. Economic Research, 23(3), 12–23. Jennings, F., & Yates, J. (2009). Scrapping over data: are the data scrapers’ days numbered? Journal of Intellectual Property Law & Practice, 4(2), 120–129. doi:0.1093/jiplp/jpn232 Johnson, P. A., Sieber, R. E., Magnien, N., & Ariwi, J. (2011). Automated web harvesting to collect and analyse user-generated content for tourism. Current Issues in Tourism, 15(3), 293–299. doi:10.1080/13683500.2011.555528 Juice
Analytics. (2009). Retrieved October 26, 2013, http://www.juiceanalytics.com/wpcontent/uploads/2010/11/Guide_to_Dashboard_Design.pdf
from
Kaplan, R. S., & Norton, D. P. (1992). The balanced scorecard - Measures that drive performance. Harvard Business Review, (January-February), 70– 79. Kautz, K. (2011). Investigating the design process: participatory design in agile software development. Information Technology & People, 24(3), 217– 235. doi:10.1108/09593841111158356 Kimes, S. E. (2010). The future of hotel revenue management. Cornell Hospitality Reports, 10(14). Retrieved from https://www.hotelschool.cornell.edu/chr/pdf/showpdf/1535/chr/research/ki mesrmfuture.pdf Korte, D., Ariyachandra, T., & Frolick, M. (2013). Business intelligence in the hospitality industry. International Journal of Innovation, Management and Technology, 4(4), 429–434. doi:10.7763/IJIMT.2013.V4.435 Kotrba, B. (2012). Managing data to maximise revenue. Caterer & Hotelkeeper, 202(4729), 34–36. Kozak, M., & Nield, K. (2001). An overview of Benchmarking literature: Its strengths and weaknesses. Journal of Quality Assurance in Hospitality & Tourism, 2(3-4), 7–23. doi:10.1300/J162v02n03_02 Lebas, M. J. (1995). Performance measurement and performance management. International Journal of Production Economics, 41(1–3), 23–35. doi:10.1016/0925-5273(95)00081-X Leventhal, B., & Langdell, S. (2013). Embedding advanced analytics into business applications. Oxford, UK: Numerical Algorithms Group. Retrieved from http://www.nag.co.uk/market/articles/nag-embeddinganalytics.pdf Liebowitz, J. (2006). Strategic intelligence. Boca Raton, FL, USA: Auerbach Publications. 103
Lodging Magazine. (2013). Profit prophets: A quick guide do revenue management software. Lodging Magazine, (January 2013), 48. Lorence, M. J. (2010a, January 15). One if by land, two if by sea: Using dashboards to revolutionize your performance management system. Balanced Scorecard Report, 12(1). Retrieved from http://hbr.org/product/one-if-by-land-two-if-by-sea-using-dashboards-tor/an/B1001C-PDF-ENG Lorence, M. J. (2010b, March 15). Using dashboards to revolutionize your performance management system. Balanced Scorecard Report, 12(2). Retrieved from http://hbr.org/product/using-dashboards-to-revolutionizeyour-performance/an/B1003C-PDF-ENG Mahmoud, Q. H., & Langendoerfer, P. (2008). Guest Editorial: Service-oriented Computing. ACM Trans. Internet Technol., 8(3), 11:1–11:3. doi:10.1145/1361186.1361187 Malik, S. K., & Rizvi, S. A. M. (2011). Information extraction using web usage mining, web scrapping and semantic annotation. In 2011 International Conference on Computational Intelligence and Communication Networks (CICN) (pp. 465–469). doi:10.1109/CICN.2011.97 March, S. T., & Storey, V. C. (2008). Design Science in the Information Systems discipline: An introduction to the special issue on Design Science Research. MIS Quarterly, 32(4), 725–730. Markus, M. L., Majchrzak, A., & Gasser, L. (2002). A design theory for systems that support emergent knowledge processes. Mis Quarterly, 26(3), 179– 212. Mayock, P. (2014, August 25). Getting to GOPPAR a challenge, RMs say. Retrieved August 25, 2014, from http://www.hotelnewsnow.com/Article/14306/Getting-to-GOPPAR-achallenge-RMs-say McGuire, K. (n.d.). Today’s revenue management systems just aren’t working anymore; So what needs to be done? Retrieved November 18, 2013, from http://hotelexecutive.com/business_review/3180/todays-revenuemanagement-systems-just-arent-working-anymore-so-what-needs-to-bedone Mehrotra, R., & Ruttley, J. (2006). Revenue management (second ed.). Washington, DC, USA: American Hotel & Lodging Association (AHLA). Monteiro, C., & Almeida, F. (2012). Análise de Balanços e Estudos de Indicadores Económicos com Base nos Modelos SNC. Retrieved February 20, 2014, from http://conteudos.otoc.pt/2012/dis2512/sebenta_dis2512.pdf Neumann, B. R., & Cauvin, E. (2008). Financial and nonfinancial performance measures. Cost Management, 22(November/December), 5–14. 104
Nielsen, J., & Landauer, T. K. (1993). A mathematical model of the finding of usability problems. In Proceedings of the INTERACT ’93 and CHI ’93 Conference on Human Factors in Computing Systems (pp. 206–213). New York, NY, USA: ACM. doi:10.1145/169059.169166 Offermann, P., Soren, B., Schonheee, M., & Bub, U. (2010). Artifact types in Information Systems Design Science – A literature review. In R. Winter, J. L. Zhao, & S. Aier (Eds.), Global perpectives on Design Science research (Vol. 6105, pp. 77–92). Heidelberg, Germany: Springer-Verlag Berlin. Retrieved from http://link.springer.com/chapter/10.1007/978-3642-13335-0_6 Öğüt, H., & Onur Taş, B. K. (2011). The influence of internet customer reviews on the online sales and prices in hotel industry. The Service Industries Journal, 32(2), 197–214. doi:10.1080/02642069.2010.529436 O’Neill, S. (2014, August 20). Study: At upscale hotels, guest acquisition costs are devouring room revenue growth [Study: At upscale hotels, guest acquisition costs are devouring room revenue growth]. Retrieved from http://www.tnooz.com/article/major-study-hotel-spending-guestacquisition-outpacing-revenue-growth/ Papazoglou, M. P., & Georgakopoulos, D. (2003). Introduction: Service-oriented Computing. Communications of the ACM, 46(10), 24–28. doi:10.1145/944217.944233 Parmenter, D. (2010). Key performance indicators: Developing, implementing, and using winning KPIs (second ed.). Hoboken, NJ, USA: John Wiley & Sons, Inc. Paulk, M. C. (2002, October). Agile methodologies and process discipline. CROSSTALK The Journal of Defense Software Engineering, 15–18. Pauwels, K., Ambler, T., Clark, B. H., LaPointe, P., Reibstein, D., Skiera, B., … Wiesel, T. (2009). Dashboards as a service: Why, what, how, and what research is needed? Journal of Service Research, 12(2), 175–189. doi:10.1177/1094670509344213 Peffers, K., Tuunanen, T., Rothenberger, M. A., & Chartterjee, S. (2007). A Design Science research methodology for Information Systems research. Journal of Management Information Systems, 24(3), 45–78. doi:10.2753/MIS0742-1222240302 Phillips, P. A. (1999). Performance measurement systems and hotels: a new conceptual framework. International Journal of Hospitality Management, 18(2), 171–182. doi:10.1016/S0278-4319(99)00016-X Piccoli, G., Carroll, B., & Hall, L. (2011). Network exploitation capability: Mapping the electronic maturity of hospitality enterprises. Cornell Hospitality Report, 11(18). Retrieved from https://www.hotelschool.cornell.edu/chr/pdf/showpdf/1473/chr/research/pi ccolicarroll.pdf 105
Portaria no 986/2009. Aprova o Sistema de Normalização Contabilística (SNC), 1a Série Diário da Républica § No 173 6006–6029 (2009). Retrieved from http://dre.pt/pdfgratis/2009/09/17300.pdf Pyo, S. (2001). Benchmarks in hospitality and tourism. Binghamton, NY, USA: Haworth Hospitality Press. Rabianski, J. S. (2003). Primary and secondary data concepts, concerns, errors, and issues. Appraisal Journal, 71(1), 43 (13). Racheva, Z., Daneva, M., Herrmann, A., & Wieringa, R. J. (2010). A conceptual model and process for client-driven agile requirements prioritization. In 2010 Fourth International Conference on Research Challenges in Information Science (RCIS) (pp. 287–298). doi:10.1109/RCIS.2010.5507388 Randev, A. (2013, August 6). Why data and analytics is hotel revenue management’s reason for being. Retrieved October 31, 2013, from http://www.eturbonews.com/36823/why-data-and-analytics-hotelrevenue-management-s-reason-being Rasmussen, N., Chen, C. Y., & Bansal, M. (2009). Business dashboards: A visual catalog for design and deployment. Hoboken, NJ, USA: John Wiley & Sons, Inc. Ratcliffe, L., & McNeill, M. (2012). Agile experience design a digital designer’s guide to agile, lean, and continuous. Berkeley, CA, USA: New Riders. Rimal, B. P., Choi, E., & Lumb, I. (2009). A Taxonomy and survey of cloud computing systems. In Fifth International Joint Conference on INC, IMS and IDC, 2009. NCM ’09 (pp. 44–51). Seoul, Korea: IEEE. doi:10.1109/NCM.2009.218 Sainaghi, R. (2010). Hotel performance: state of the art. International Journal of Contemporary Hospitality Management, 22(7), 920–952. doi:10.1108/09596111011066617 Sauter, V. L. (2010). Decision support systems for business intelligence. Hoboken, NJ, USA: John Wiley & Sons, Inc. Scarisbrick-Hauser, A. (2007). Data analysis and profiling. Direct Marketing: An International Journal, 1(2), 114–116. doi:10.1108/17505930710756860 Schläfke, M., Silvi, R., & Möller, K. (2013). A framework for business analytics in performance management. International Journal of Productivity and Performance Management, 62(1), 110–122. doi:10.1108/17410401311285327 Schultz, G. J. (2004). Enterprise performance management: Strategic decision analytics from deep data. Information Strategy: The Executive’s Journal, 20(3), 14–24.
106
Serra, F. (2013). Estratégias de negócio: Os conceitos de yield e de revenue management e a sua aplicação às operações hoteleiras. In C. Henriques, I. Monteiro, F. Serra, J. Santos, & P. Águas (Eds.), Inovação e Qualidade na Hotelaria (pp. 161–172). Faro, Portugal: Universidade do Algarve, Escola Superior de Gestão, Hotelaria e Turismo. Sharp, H., Rogers, Y., & Preece, J. (2009). Interaction Design: Beyond Human Computer Interaction (second ed.) (2nd edition.). Chichester, West Sussex, U.K: John Wiley & Sons Ltd. Sheivachman, A. (2011, June 20). Social media matures, forcing hotels to focus on reputation. Hotel Management, 226(8), 38. Simon, H. A. (1996). The sciences of the artificial (3rd edition). Cambridge, MA, USA: MIT Press. Sparks, B. A., & Browning, V. (2011). The impact of online reviews on hotel booking intentions and perception of trust. Tourism Management, 32(6), 1310–1323. doi:10.1016/j.tourman.2010.12.011 Statista. (2014, April). Market share of the most popular hotel review sites 2014 | Statistic. Retrieved September 28, 2014, from http://www.statista.com/statistics/309966/most-popular-hotel-reviewsites/ Stehle, T. (n.d.). Top 10 benefits of a business intelligence software solution. Retrieved October 27, 2013, from http://hotelexecutive.com/business_review/2235/top-10-benefits-of-abusiness-intelligence-software-solution Storey, V. C., Thompson, C. B., & Ram, S. (1995). Understanding database design expertise. Data & Knowledge Engineering, 16(2), 97–124. doi:10.1016/0169-023X(95)00012-H Svobodova, L. (1984). Resilient distributed computing. IEEE Transactions on Software Engineering, SE-10(3), 257–268. doi:10.1109/TSE.1984.5010234 Truyens, M., & Van Eecke, P. (2014). Legal aspects of text mining. Computer Law & Security Review, 30(2), 153–170. doi:10.1016/j.clsr.2014.01.009 Tufte, E. R. (2007). The visual display of quantitative information (second ed.). Cheshire, CN, USA: Graphics Press. Turban, E., Sharda, R., & Delen, D. (2011). Decision support and business intelligence systems (9th ed.). New Jersey, NJ, USA: Prentice Hall. Turban, E., Sharda, R., Delen, D., & King, D. (2010). Business intelligence: A managerial approach (second ed.). Boston, MA, USA: Prentice Hall. Van Aken, J. E. (2004). Management research based on the paradigm of the design sciences: the quest for field-tested and grounded technological
107
rules. Journal of Management doi:10.1111/j.1467-6486.2004.00430.x
Studies,
41(2),
219–246.
Van Aken, J. E. (2005). Management sesearch as a Design Science: Articulating the research products of Mode 2 knowledge production in management. British Journal of Management, 16(1), 19–36. doi:10.1111/j.1467-8551.2005.00437.x Venkatraman, N., & Ramanujam, V. (1986). Measurement of business performance in strategy research: A comparison of approaches. Academy of Management Review, 11(4), 801–814. doi:10.5465/AMR.1986.4283976 Virzi, R. A. (1992). Refining the test phase of usability evaluation: How many subjects is enough? Human Factors, 34(4), 457–468. Waal, A. A. de, & Counet, H. (2009). Lessons learned from performance management systems implementations. International Journal of Productivity and Performance Management, 58(4), 367–390. doi:10.1108/17410400910951026 Waal, A. de, & Kourtit, K. (2013). Performance measurement and management in practice: Advantages, disadvantages and reasons for use. International Journal of Productivity and Performance Management, 62(5), 446–473. doi:10.1108/IJPPM-10-2012-0118 Walters, M. (n.d.-a). 7 Steps to driving profit using guest analytics. Retrieved October 27, 2013, from http://hotelexecutive.com/business_review/3102/7-steps-to-driving-profitusing-guest-analytics Walters, M. (n.d.-b). Establishing the new hotel data ecosystem. Retrieved October 27, 2013, from http://hotelexecutive.com/business_review/3478/establishing-the-newhotel-data-ecosystem Wang, S., & Wang, H. (2010). Towards innovative design research in Information Systems. Journal of Computer Information Systems, 51(1), 11–18. Webster, J., & Watson, R. T. (2002). Analyzing the past to prepare for the future: Writing a literature review. MIS Quarterly, 26(3), xiii–xxiii. Williams, S., & Williams, N. (2007). The profit impact of business intelligence. San Francisco, CA, USA: Elsevier. Woodley, M. (n.d.). The growing number of channels leads to growing complexity of Revenue Management and a need for convergence among disciplines. Retrieved December 30, 2013, from http://hotelexecutive.com/business_review/3635/the-growing-number-ofchannels-leads-to-growing-complexity-of-revenue-management-and-aneed-for-convergence-among-disciplines 108
Yangyong, Z. H. U., & Yun, X. (2011, June 16). Dataology and Data Science: Up to now. Retrieved January 1, 2014, from http://www.paper.edu.cn/en_releasepaper/content/4432156 Yasin, M. M., & Gomes, C. F. (2010). Performance management in service operational settings: a selective literature examination. Benchmarking: An International Journal, 17(2), 214–231. Yigitbasioglu, O. M., & Velcu, O. (2012). A review of dashboards in performance management: Implications for design and research. International Journal of Accounting Information Systems, 13(1), 41–59. doi:10.1016/j.accinf.2011.08.002 Zak, P. (2013, July 4). Measurement myopia [The Drucker Exchange]. Retrieved from http://thedx.druckerinstitute.com/2013/07/measurementmyopia/ Zheng, G. (2009). A Multidimensional and Visual Exploration Approach to Project Portfolio Management. Geogia State University, Georgia, USA. Retrieved from http://scholarworks.gsu.edu/cis_diss/12/ Zmud, B. (1997, June). Editor’s Comments. MIS Quarterly, 21(2), xxi–xxii.
109
APPENDIXES
110
Appendix I- Summary of recent publications that address the need for BI/DA approaches in hospitality
Publication
Author (date)
Title
4 Hoteliers
Amadeus (2013)
Travel industry stands at a "big data crossroads"
Intelligent Hospitality
Coleman (2013a)
Business Intelligence. What it is and why it matters to hospitality
HotelMarketing.com
Coleman (2013b)
Hotel business intelligence begins with data, data management begins with BI
Hospitality Magazine
Creamer (2013)
Tech secrets success
EyeForTravel.com
Cuddeford-Jones (2013)
Effective revenue management in the hospitality industry
HotelNewsNow.com
Dean (2011)
Hotel business intelligence seeking its identity
HotelExecutive.com
Gambhir (n.d.)
Understanding dashboard
Information Week
Henschen (2013)
Big data analysis drives revolution in travel
Caterer & Hotelkeeper
Kotrba (2012)
Managing data to maximize revenue
Numerical Algorithms Group
Leventhal & Langdell (2013)
Embedding advanced analytics into business applications
HotelExecutive.com
McGuire (n.d.-b)
Today's revenue management systems just aren't working anymore; So what needs to be done?
eTN
Randev (2013)
Why data and analytics is management’s reason for being
HotelExecutive.com
Stehle (n.d.)
Top 10 benefits of a business intelligence software solution
HotelExecutive.com
Walters (n.d.-a)
7 steps to driving profit using guest analytics
HotelExecutive.com
Walters (n.d.-b)
Establishing the new hotel data ecosystem
HotelExecutive.com
Woodley (n.d.)
The growing number of channels leads to growing complexity of Revenue Management and a need for convergence among disciplines
behind
the
revenue
new
management
hotel
performance
hotel
revenue
Source: Author’s elaboration
111
Appendix II- List of BI/dashboard systems/applications Application
Subject
Description
Website
Amadeus
BI, RM
Using advanced forecasting models combined with detailed historical and future booking data, Amadeus makes intelligent rate and inventory recommendations
www.amadeus.com
Business Dashboards
Dashboards, BI
Application to create dashboards with the capability to explore the data in a reach and detailed way, including drill down
www.tableausoftware.com
Business Objects suite
Dashboards, BI, DA
Offers a broad family of BI tools and applications
www.businessobjects.com
Domo
Dashboards, BI
Platform to integrate organization’s data and promote the creation of dashboards and reports
www.domo.com
EasyRMS
BI, RM
Using a proprietary set of algorithms applied to historical and channel data, forecasts accurately, optimize product prices and availability
www.easyrms.com
Geckoboard
Dashboards
Highly customizable and widget based application to create dashboards
www.geckoboard.com
IBM Cognos
Dashboards, BI, DA
Offers a wide range of BI capabilities on a single, serviceoriented architecture (SOA)
www.ibm.com
iDashboards
Dashboards
Application to create dashboards based on real-time information
www.idashboards.com
Dashboards, BI, DA, RM
Analyses bookings and groups patterns, providing trends and exceptions with impact on RM, using an extensive set of BI tools (company specialized in hospitality, owned by SAS)
www.ideas.com
iRates
BI, DA, RM
Permits the definition of actions to be taken in order to achieve highest yield from operations. Organizes and automates the pricing and RM business processes, including data analysis and decision-making
www.i-rates.com
Klipfolio
Dashboards
Online platform for building realtime business dashboards
www.klipfolio.com
Ideas
112
BI, RM
Forecasts booking behavior by micro-segment, by pricesensitivity and distribution channel profitability and presents forecasts and availability recommendations
www.maximrms.com
Micro Strategy Analytics Platform
Dashboards, BI, DA
Application that supports a full range of analytical functionality, from dashboards, to sophisticated statistical analysis and data mining
www.microstrategy.com
SAS suite
Dashboards, BI, DA
Offers a broad family of BI, DA and dashboard tools, applications and services
www.sas.com
Zoho Reports
Dashboards, BI, DA
Online reporting and business intelligence service that helps analyze business data and create insightful reports and dashboards
www.zoho.com
MaximRMS
Source: Author’s elaboration with parts adapted from Bose (2009) and Lodging Magazine (2013)
113
External data sources procurement
Activity 3 - Design and development
8
9
Software development (programming)
Testing and simulation in production servers
Deployment of the prototype version 1 (artifact)
21
22
23
28
27
26
25
Presentation of artifact to hotels
23 days
25 days
30 days
15 days
10 days
80 days
60 days
60 days
Thu 20-02-14
Thu 20-02-14
Wed 12-02-14
Wed 12-02-14
Mon 20-01-14
Mon 20-01-14
Thu 26-12-13
Tue 26-11-13
Mon 11-11-13
Fri 01-11-13
Fri 01-11-13
Mon 02-09-13
Mon 02-09-13
Tue 25-02-14
Tue 25-02-14
Project Summary Inactive Task
Milestone
31 days
2 days
2 days
2 days
2 days
0 days
10 days
75 days
20 days
15 days
Fri 04-07-14
Wed 02-07-14
Wed 02-07-14
Mon 30-06-14
Mon 30-06-14
Sun 29-06-14
Fri 20-06-14
Sun 06-04-14
Mon 17-03-14
Sun 02-03-14
120 days Sun 02-03-14
5 days
5 days
129 days Tue 25-02-14
5 days
5 days
8 days
8 days
Split
Task
Interaction 3
Obteinment of hotels feedback
Activity 5 - Evaluation
Summary
Design of the database models
20
Activity 4 - Demonstration
Metrics and indicators selection
19
24
Activity 3 - Design and development
Revision of requirements
Activity 2 - Definition of objectives and solution
Interaction 2
Obteinment of hotels feedback and approval
Activity 5 - Evaluation
Presentation of artifact to hotels
Activity 4 - Demonstration
18
17
16
15
14
13
12
11
Start
176 days Mon 02-09-13
Duration
Software requirements specification document (SRSD) 23 days - Artifact
Data sources identification
7
10
Metrics and indicators identification
6
Activity 2 - Definition of objectives and solution
Literature revision
Activity 1 - Definition of problem and motivation
Interaction 1
Task Name
System concept
Task Mode
5
4
3
2
1
Project: HPD Activities Chart
ID
Finish
Manual Task
Inactive Summary
Inactive Milestone
Sun 03-08-14
Thu 03-07-14
Thu 03-07-14
Tue 01-07-14
Tue 01-07-14
Sun 29-06-14
Sun 29-06-14
Thu 19-06-14
Sat 05-04-14
Sun 16-03-14
Sun 29-06-14
Sat 01-03-14
Sat 01-03-14
Thu 03-07-14
Mon 24-02-14
Mon 24-02-14
Wed 19-02-14
Wed 19-02-14
Tue 11-02-14
Tue 11-02-14
Sun 19-01-14
Wed 25-12-13
Mon 25-11-13
Sun 10-11-13
Sun 19-01-14
Thu 31-10-13
Thu 31-10-13
Mon 24-02-14
August
October
Manual Summary
Manual Summary Rollup
Duration-only
September
December
Page 1
External Tasks
Finish-only
Start-only
November
January
Progress
Deadline
External Milestone
February
March
Manual Progress
April
May
June
29-06
July
August
September
October
November
Appendix III- Project activities Gantt chart
114
115
Software development (programming)
Deployment of the prototype version 2 (artifact)
34
35
Presentation of artifact to hotels
Design of the database models
Software development (programming)
Deployment of the prototype version 3 (artifact)
45
46
47
Presentation of artifact to hotels
Document submission
56
Project Summary Inactive Task
Milestone
0 days
27 days
27 days
2 days
6 days
6 days
14 days
2 days
2 days
0 days
8 days
1 day
3 days
12 days
2 days
2 days
57 days
1 day
1 day
4 days
4 days
0 days
17 days
5 days
2 days
24 days
2 days
2 days
Duration
Split
Task
Elaboration of project documentation
55
Summary
Obteinment of hotels feedback
53
Activity 6 - Communication
Elaboration of materials for hotel/experts final evaluation
52
54
Evaluation of artifact usage data
Activity 5 - Evaluation
51
50
49
Activity 4 - Demonstration
Metrics and indicators selection
44
48
Activity 3 - Design and development
Revision of requirements
Activity 2 - Definition of objectives and solution
Interaction 4
Obteinment of hotels feedback
Activity 5 - Evaluation
43
42
41
40
39
38
37
Activity 4 - Demonstration
Design of the database models
33
36
Metrics and indicators selection
32
Revision of requirements
Activity 2 - Definition of objectives and solution
Task Name
Activity 3 - Design and development
Task Mode
31
30
29
Project: HPD Activities Chart
ID
Start
Mon 29-09-14
Wed 03-09-14
Wed 03-09-14
Mon 01-09-14
Tue 26-08-14
Wed 20-08-14
Wed 20-08-14
Mon 18-08-14
Mon 18-08-14
Sun 17-08-14
Sun 10-08-14
Sat 09-08-14
Wed 06-08-14
Wed 06-08-14
Mon 04-08-14
Mon 04-08-14
Mon 04-08-14
Sun 03-08-14
Sun 03-08-14
Wed 30-07-14
Wed 30-07-14
Tue 29-07-14
Sun 13-07-14
Tue 08-07-14
Sun 06-07-14
Sun 06-07-14
Fri 04-07-14
Fri 04-07-14
Finish
Manual Task
Inactive Summary
Inactive Milestone
Mon 29-09-14
Mon 29-09-14
Mon 29-09-14
Tue 02-09-14
Sun 31-08-14
Mon 25-08-14
Tue 02-09-14
Tue 19-08-14
Tue 19-08-14
Sun 17-08-14
Sun 17-08-14
Sat 09-08-14
Fri 08-08-14
Sun 17-08-14
Tue 05-08-14
Tue 05-08-14
Mon 29-09-14
Sun 03-08-14
Sun 03-08-14
Sat 02-08-14
Sat 02-08-14
Tue 29-07-14
Tue 29-07-14
Sat 12-07-14
Mon 07-07-14
Tue 29-07-14
Sat 05-07-14
Sat 05-07-14
August
October
Manual Summary
Manual Summary Rollup
Duration-only
September
December
Page 2
External Tasks
Finish-only
Start-only
November
January
Progress
Deadline
External Milestone
February
March
Manual Progress
April
May
June
July
29-07
August
17-08
September
29-09
October
November
Appendix IV- List of characteristics a PM system should have
•
Data access: o Should be able to use data from several sources. o Should be able display metrics that combine measures from different sources. o Should be able to retrieve data at predefined intervals/schedules.
•
Data transformation: o All data should be “cleaned”, transformed and loaded to the system before being presented to the users. o All transformations should be done in “background” so that the presentation to users should be from already processed data, therefore fastest. o All transformations should be stored in the data warehouse so that the same measures shouldn’t be transformed more than one time, even if they are used on different metrics.
•
Data management: o All data should be stored in the cloud’s own data warehouse. o Each hotel should use its own databases, avoiding therefore any misusing or wrongful access to information. o All indicators should be constructed using OLAP databases so that responses to requests are fast.
•
System architecture: o Fully web based and multi browser compatible. o Should be available as SaaS (Software as a Service). o Should run on all Internet enabled devices with a minimum screen resolution of 1280 x 800 pixels (recommended 1280 x 1024) o The system should be highly scalable. o An adequate backup/restore system should be put in place prior to deployment of the system.
•
Charting: o All charts should be purely HTML5 and Javascript so that they run on almost all Internet enabled devices.
116
o All images should be cacheable for system faster performance. o Users should be able to select their charts and indicators. o When applied, segmentation of chats should be possible. •
Analytics: o Users should be able to drill down on data from charts, by applying filters and segmentation. o Users should be able to view metrics in multiple dimensions. o Regression, forecasts and other predictive advanced analytics features should be used.
•
Security and administration: o The system should have a user authentication mechanism. o Access to certain metrics should be restricted to users with permission. o Users should only be able to access their “personal dashboard”. o Only the author should be able to administer the system.
•
Design environment: o The system should come with predefined templates. o Any user should be able to design/modify his/her dashboard, by selecting the indicators to use. o No kind of scripting should be necessary. o Design should be easy and intuitive.
•
Dashboard functionalities: o Should have the possibility to provide dimensional analysis. o Should be able to print/export dashboard or tabular data. o Should have annotation/collaboration features. o Should have predictive analytics. o Should have customized alerts. o Should have a “click” to drill on data and metadata. o Should be flexible to the point that the users can select the presentation format that best suits them.
117
Appendix V- Software requirements specification
Hospitality Performance Management
Software Requirements Specification
118
TABLE OF CONTENTS 1. INTRODUCTION ......................................................................................... 121 1.1. Purpose .............................................................................................................................121 1.2. Scope ................................................................................................................................121 1.3. Definitions, acronyms, and abbreviations .....................................................................124 1.4. References ........................................................................................................................124 1.5. Overview ...........................................................................................................................124
2. OVERALL DESCRIPTION .......................................................................... 125 2.1. Product perspective .........................................................................................................125 2.1.1. System architecture ....................................................................................................125 2.1.2. System interfaces .......................................................................................................129 2.1.3. User interfaces ............................................................................................................129 2.1.4. Hardware interfaces ....................................................................................................130 2.1.5. Software interfaces .....................................................................................................130 2.1.6. Communication interfaces ..........................................................................................131 2.1.7. Memory constrains......................................................................................................131 2.1.8. Operations ...............................................................................................................132 2.2. Product functions ............................................................................................................135 2.3. User characteristics .........................................................................................................136 2.4. Constrains ........................................................................................................................136 2.5. Assumptions and dependencies ....................................................................................137
3. SPECIFIC REQUIREMENTS ...................................................................... 138 3.1. External interfaces ...........................................................................................................138 3.2. Functions ..........................................................................................................................138 3.3. Performance requirements .............................................................................................140 3.4. Logical database requirements ......................................................................................141
119
3.5. Design constrains ............................................................................................................142 3.6. Software system attributes .............................................................................................142 3.6.1. Reliability.....................................................................................................................142 3.6.2. Availability ...................................................................................................................143 3.6.3. Security .......................................................................................................................143 3.6.4. Maintainability and portability ......................................................................................143
120
1. INTRODUCTION 1.1. Purpose This document describes the expected behavior of the Performance Management system to be developed as the final work project to obtain the degree of Master of Science in Hotel Administration and Management. The core purpose of this work is to develop a functional prototype of a system that uses Business Intelligence and Data Analytics capabilities as the foundations for a hospitality Performance Management system [1], that, by the use of dashboards, enables users at a glance, to understand the hotel’s performance and if necessary, explore the data to better understand the reasons behind the dashboard gauges, scorecards, charts and tables. This document has two target audiences: 1. Author/Supervisor – the author and the supervisor are the owners of the document and are responsible for the definition of most of the requirements specifications. 2. Hoteliers – act simultaneously as stakeholders and customers. Their input is crucial for the definition, revision and validation of specifications. It’s important to have hoteliers participating in the specifications definition, as a way to ensure the system is adequate for the hotel requirements, as well as a way to get their commitment to implementing the system. 1.2. Scope The system that is the subject of this work will be named “Hotel Performance Dashboard” (HPD). It will be a cloud-based system, to be hosted on the addresses HotelPerformanceDashboard.com and HotelDataAnalytics.com and made available to hotels in the SaaS model. The system will use data from several sources to calculate metrics and Key Performance Indicators (KPIs), presenting them to users throughout the use of dashboards, tables, reports and pivot tables.
121
Since this system will be a prototype, the scope of the data sources will be restricted as a way to simplify the development and to have it ready in the limited time frame available for the project completion. For this prototype the following data sources should be used (even though not to their full extent): •
Property Management System (PMS);
•
Accounting system;
•
Weather data (historic and forecast);
•
Social reputation;
•
Competitive intelligence;
•
Market supply/demand.
Due to the previously mentioned constrictions and despite their importance in hospitality performance measurement, for this prototype, other important data sources must be left out, such as: •
Human resources;
•
Building automation;
•
Stocks and inventory;
•
Additional competitive intelligence (STR);
•
Flight capacity and effective arrivals (historic and expected).
By limiting the access to data sources, the possibility of creating some metrics and KPIs is being explicitly limited. The main objectives behind the development of this functional prototype can be divided into four categories: •
Generic: o Assess users perception of alignment of their actions to the strategic objectives of the organization; o Gather pros/cons reported by users; o Identify areas that should require revision and improvement in a more complete, commercial version.
•
Extract, Transform and Load (ETL) process: o Evaluate potential problems with data accessibility and availability; 122
o Understand potential problems with data quality; o Test the performance of the cloud environment. •
Usability and interaction: o Understand up to what level users will adopt the system; o Identify most/least used metrics/KPIs and reasons behind it; o Compare usage between users of same areas/departments.
•
Contribution to organization performance: o Verify alignment to strategic objectives; o Identify areas/departments that most/least took advantage of the system and reasons behind it; o Identify major impacts caused by the availability of the information to the different hierarchies of staff.
As any PM system, by using HPD should be able to have relevant benefits such as defined by Eckerson [1]: 1. Improved communication – using dashboards and scorecards tailored to individual roles, executives can better communicate strategy and expectations to managers and staff at all levels. 2. Improved coordination – by fostering collaboration through the exchange of ideas and information between the organization levels, units and departments. 3. Improved control – using up-to-date information on market conditions and operational processes, the staff can better adjust plans and fix/improve operations in a timely manner. The overall goal of the development of this system is to have the prototype being used by a minimum period of two months, in three to five hotels, and evaluate the usefulness and benefits that users perceive by using the system as well as if there is technical and commercial viability for the creation of such a product1 (with more features and specifications).
1
Although this document references the application as a product, in a marketing definition it is a service, because it’s an intangible benefit that commercially should only be made available to hotels as long as they pay for it. 123
1.3. Definitions, acronyms, and abbreviations •
API – Application Programming Interface. Set of functionalities with a specific format that makes possible the interaction between different systems.
•
ERD – Entity-Relationship Diagram. Data model that describes a relational database.
•
ETL – Extract, Transform and Load. Process by which data is read from data sources, verified, transformed in the desired format/metrics and loaded in the data warehouse.
•
HPD – Hotel Performance Dashboard. This is the name of the application/system.
•
KPI – Key Performance Indicator. Measure that permits organizations to evaluate the success of their activities.
•
PMS – Property Management System. Applications used to manage hospitality businesses. Automates functions like bookings, invoicing, room allocation, etc.;
•
SaaS – Software as a Service. Software delivering model where the software and its data is centrally hosted, meaning that users only need an internet browser and internet connection to access it, without having the need to install the software or having its data locally.
•
UI – User Interface.
1.4. References [1] Eckerson, W. W. (2011). Performance dashboards measuring, monitoring, and managing your business (second ed.). Hoboken, NJ: John Wiley & Sons, Inc. 1.5. Overview The rest of this document contains the detailed requirements specifications that should be implemented on an HPD prototype. In chapter 2 an overall description of the product is made along with an architecture
overview,
interfaces,
required
functionalities,
constrains,
assumptions and dependencies. 124
In chapter 3 all software requirements are described in a low level of detail, in plain, non-technical language where possible, not because the author will be the designer and author of the system, but primarily to permit the easy interpretation by hoteliers. Apart from functional specifications related to the subject of the work itself, other specifications such as databases, hardware, performance and other requirements are also presented in this chapter.
2. OVERALL DESCRIPTION 2.1. Product perspective 2.1.1. System architecture As depicted in Figure 1 the system should be comprised of three logical layers highly associated to the same number of physical layers: •
Data sources: this first layer is all about data gathering, cleaning and loading. It’s the foundation that makes possible the collecting of the indispensable data for the system to process and present the expected results. Since the system requires data from several data sources, the type of handling needed in this layer depends on the type of data. For this prototype four different types of sources will be used: o Hotel own data: raw data from transactions and records of the PMS and Accounting systems databases. To execute the ETL process, an agent application should be developed as a component of the system. This agent will have the task of cyclically extracting the raw data from the databases, do a basic cleaning and transformation process and load the data to the warehouse, using the web services of the “Data center” layer.
125
Figure 1: System architecture diagram
Source: Author’s elaboration
It’s the only agent that will be installed locally by the hotel. The reason is not only for having a better performance, as it sometimes could have to process high volumes of data, but mostly because of security reasons, otherwise hotels should have to permit direct external connections to their applications databases and that could be seen as a major security threat. 126
o External providers data: historic, present and forecast data obtained from Internet partners, using their webservices API. For this prototype only data about weather and social reputation will be used. o Web scraping data: data on pricing and inventory availability from the hotel competitive set, collected with the use of web scraping techniques. o Manually input data: for this prototype two types of data will have to be introduced manually: §
Historic supply and demand: entered by the author into the system database to enable the creation of metrics on market share and market fair share.
§
Budget and goals: entered by the users of the system to enable the verification of performance alignment against goals and budgeted values.
•
Data center: this layer is the core of the system. It’s where the vast majority of applications and databases that form the system are. It’s composed of three components, each of them with their own subcomponents, that will be physically installed at the data center where the system will be hosted: o Applications: aggregation of four applications, grouped in two different categories, which will work in coordination to perform the ETL process. This coordination should be made possible by the use of queues of tasks, which would be the backbone for enabling scalability of the system (if performance issues arise), making it possible to run multiple, distributed instances, of the same application. §
ETL: applications related to the ETL process. This group of applications consists of: •
Load web services: application that receives the PMS and accounting data gathered by the agent in the hotel, does any final transformation steps required and loads it into the corresponding databases. 127
•
External data agent: application that has the assignment
of
contacting
the
external
data
providers, extracting the required data, transforming it and loading it into the databases. •
Scraper agent: application that makes use of web pages content extraction techniques to gather prices and inventory availability of the hotel’s competitive set and loads the information into the system databases.
§
Orchestrator: application that has the task of coordinating the work of the different ETL agents by managing the tasks queues and defining tasks that should be done by each agent.
o Data warehouse: also one of the very important components of the system. It comprises different groups of databases: §
Application relational database: database that will hold the data about the system itself, including the data of the several queues necessary for the correct and timely ETL processing of data from the different sources.
§
Hotel databases: each hotel using the system will have a set of two databases. One relational with the atomic transactional details as well as the related data that describe the transactions and, one OLAP database built on the structure of the relational database to provide fast and multi-dimensional access to the data.
o Web server: it’s also an application, but only related to presentation. It’s the web-based application that enables users to access the data. Actually, for users, it’s the “system” itself, because it should be the only application that they will have access to. •
Data visualization: layer that can be identified as the visible part of the system. Although physically be a component (web server) of the data center, the visualization is the only component that is observable by hotels, therefore should be treated as a different conceptual level. 128
The application should be a portal with some generic information about the system with the capacity for users to authenticate and have access to their dashboards. From the dashboards users should be able to slice and dice, drill up/down or use pivot tables to view exceptions and trends in data from any perspective. 2.1.2. System interfaces Interfaces with other systems are an important component of this system, since only these interfaces enable the system to access data from several different sources, which is a key requirement of any PM system. HPD as detailed in Figure 1 should have interfaces with the following systems: •
PMS: the hotel data ETL agent should have direct access to the hotel’s PMS. For that to be possible, a driver or script structure should be implemented in a way that at any time, compatibility with the different PMS’s available on the market can be added to HPD.
•
Accounting: similarly to the PMS system, a structure that enables the implementation of drivers/scripts to support the communication with the hotel’s
accounting
systems
to
extract
information.
Should
be
implemented on the hotel data ETL agent. •
Weather: the interface with the weather related data should be made by the external data ETL agent using the provider API webservices, being the selected provider Weather Underground2.
•
Social reputation: like the weather data, the social reputation data should also be retrieved by the external data ETL agent, but in this case using the API from Reviewpro3, the selected provider.
•
Competitive intelligence: competitive set information on prices and inventory should be gathered by the scraper agent application, by applying content extraction techniques on the Booking.com website.
2.1.3. User interfaces 2 3
More information at http://www.wunderground.com. More information at http://www.reviewpro.com. 129
The system should have two different types of user interfaces (UI): •
Web responsive: this type of UI design approach should be applied to the web server/data visualization components with the objective of making the system usable in a wide range of Internet enabled devices, from PC’s to tablets and smartphones.
•
Windows application: because all other applications and agents will be used internally (not presented to users) the UI should be very minimalistic and only provide feedback on the application status, therefore standard windows UI should be used.
Due to the experimental character of the system and also to the novelty of the subject, no UI prototypes are presented. The UI should be assembled according to the technological and time constraints found during the development process. 2.1.4. Hardware interfaces HPD should have a minimalistic hardware interface. Apart from the need to support the two different types of UI’s, which should have graphical interfaces compatible with the devices where the system should be used, no particular hardware interfaces should exist. 2.1.5. Software interfaces The following table (Figure 2) details the different software products that the system should use and interface with. Apart from those, all ETL agents require an operating system compatible with Microsoft Windows 7. The hotel’s own data ETL agent should also have an interface with the PMS and accounting systems databases. Because the web server should be responsive and have multi-browser support, the devices used by the users to access the system, should be able to support any of the major operating systems (Microsoft Windows, Linux, MacOS, iOS and Android, among others).
130
Figure 2: Data center software interfaces list
Name
Mnemonic
Windows Server
Windows
2012
Operating system that supports the system and web application publishing
Microsoft SQL Server
SQL
2012
Relational and OLAP databases server
Microsoft Framework
Framework
4.5
Framework used get better time of development and more reliable source code
Chrome
11.0
Browser used to access the portal
Google Chrome
.NET
jQuery
jQuery
jQueryUI
jQueryUI
Highcharts
Version
Highcharts
Purpose
1.10.2
Client-side scripting component that facilitates the implementation of Javascript and the development of highly interactive web applications
1.10
Client-side UI components produced in jQuery. Should be used to create an attractive and easy UI
3.09
Library of highly customizable Javascript charts with a powerful API. Should be used to create interactive charts and gauges.
Source: Author’s elaboration
2.1.6. Communication interfaces There are only two relevant communications interfaces that should be used by the system: •
ETL agents: between ETL agents and the data sources will be used the TCP/IP protocol for consuming web services and therefore, port 80 is necessary to be open for communication. Whenever possible, the Secure-Socket Layer (SSL) protocol should be used (port 443).
•
Microsoft SQL: the database server uses TCP/IP port 1433 to communicate with its clients.
2.1.7. Memory constrains
131
Apart from the software interfaces specific requirements on RAM and disk memory, for the system itself for the development and evaluation period it’s estimated that no more than 500 Gb of disk memory should be necessary. 2.1.8. Operations From the user point of view (Front-Office - FO), the flow of the operations is very simple. By deciding when to log in and explore the data through the use of dashboards users have full control of the workflow and what operations to execute (visualize gauges, reports or pivot tables). From the administration/data processing point of view (Back-Office - BO), except from the data sources that require manually input, the majority of the system should function autonomously with no administration required, except for the initial setup and configuration. Every task should run cyclically at predefined time intervals as described in the diagrams of the main algorithms of the orchestrator application and the ETL application agents,
Figure 3
and
Figure 4,
respectively.
132
Figure 3: Orchestrator main algorithm
Source: Author’s elaboration
133
Figure 4: ETL agents main algorithm
Source: Author’s elaboration
134
2.2. Product functions From the FO point of view, HPD should have the following main functions: 1. Portal (no user authentication required): 1.1. The website should have a main menu. 1.2. The website should have an option for users to authenticate and have access to the business specific functions. 2. Business specific (authentication required): 2.1. Immediately after login the “personal dashboard” should be presented to the user. 2.2. The user should be able to customize his/her dashboard, by using predefined widgets, gauges and tables with the different metrics and KPIs. 2.3. By pressing widgets and gauges, users should be able to access tables of data that originated in the metrics/KPIs. 2.4. Data tables should have slice and dice, and drill down capabilities, so that users can explore the data in different dimensions, going, when possible, to the transactional or raw data level. 2.5. Users should be able to create their own pivot tables, by selecting the facts and dimensions, with the ability to create hierarchies. 2.6. On the dashboard users should be able to add shortcuts to other pages with other gauges, reports or pivot tables. 2.7. Users should be able to define the amount of time between data updates from the different data sources. From the BO point of view, the functions that HPD should have are mostly system requirements that have impact on the system overall performance and user acceptance: 3. Business specific (only authenticated system administrators): 3.1. The system should be able to acquire the raw data in almost real time. 3.2. The ETL process should be fast, so that metrics and KPIs should be available to users in a timely way.
135
3.3. The system should be able to deliver the information required by users in a fast way, independent of the facts and dimensions that the users select for the basis of their metrics and KPIs. 2.3. User characteristics Since HPD is a system that ultimately should be used by members of all departments of the hotel, its usability design should accommodate a broad range of users in terms of IT knowledge. To use the dashboards users should only be required to be familiar with the main metrics and KPIs relevant to theirs department’s performance evaluation, as well as generic hospitality metrics and KPIs. However, to build their own reports/tables, users should have some technical expertise in pivot tables and the concepts of dimensional databases (facts and dimensions). 2.4. Constrains As a prototype of a system that aggregates data from different sources and that requires a high level of processing within a short period of time, HPD has some issues that can become impediments or limitations during it’s development and deployment: •
Data sources: o Accessibility: security, hotel policy or software producer reasons could make access to the PMS or accounting databases difficult. o Readability: unavailability/difficulty to obtain PMS and accounting databases Entity-Relationship Diagrams (ERD’s) or dictionaries could make it impossible to obtain important data required for the elaboration of important metrics/KPIs. o Quality: if poor quality data is obtained from the data sources, the system should could take longer to be developed, as more advanced data transformation functions should be developed. o Availability: if the data sources availability is not constant or doesn’t respond with timely data, some of the requirements of the system, such as presenting information almost in real-time could not be fulfilled. 136
•
Infrastructure: o Database response: the database server should be able to process all relational and OLAP databases requests for a maximum of the five hotels where the prototype is to be implemented, otherwise, the project cost would go outside the budget. o Data warehouse dimension: the volume of information could prove to be a problem to the viability of the project if the space to store it goes outside the project budget. o Response: overall system response is a critical issue for its acceptance by users, therefore all applications should be prepared as “distributed computing” so that if a problem occurs, it should be possible to add more processing power to the infrastructure. o Availability: the availability and uptime of the infrastructure is a critical issue in an SaaS system, therefore the infrastructure should be reliable and guarantie a very high level of availability.
•
Security: o Privacy: all private information should be sanitized as the disclosure of confidential information could jeopardize the project viability. o Information accessibility: the access to the information should be limited to the hotel’s own users. Unauthorized access to any data could compromise the project viability.
2.5. Assumptions and dependencies Since HPD depends on data supplied by other systems, the quality, availability and correctness of that data is a vital factor for HPD success. Consequently, any changes to the format of the defined data sources should take to a requirements revision. Also, if some data source is not available for some period, HPD should not stop working, but should display gracefully to the users why the metrics/KPIs are not presented. 137
3. SPECIFIC REQUIREMENTS 3.1. External interfaces The interfaces with the data sources described in point 2.1.2. should be made using its web services API’s or in the case of direct access to databases, to the ERD’s or database dictionaries. The selected web services API’s are already available through the suppliers, the same is not true for the PMS and accounting databases. That will only occur when hotels willing to participate in the evaluation of the system will accept the invitation and then contact their IT departments/suppliers to provide that information. 3.2. Functions From the FO point of view, HPD should have the following functions: 1. Portal (no user authentication required): 1.1. The website should have a main menu: 1.1.1. Options in the menu should be: 1.1.1.1.
Home – Main page with sample screens of the system FO
and a brief description. 1.1.1.2.
Presentation – Detailed description of the project.
1.1.1.3.
Contacts – Form for contacting the author.
1.1.1.4.
About – Details of the version, releases and project phases.
1.1.1.5.
Login/Logout – Option to log in or log out of the system.
1.1.2. All content should adapt to the device display (responsiveness). 1.2. The website should have an option for users to authenticate and have access to the business specific functions: 1.2.1. If a user doesn’t remember his/her login/password, they should be able to retrieve it by email. 1.2.2. If a user fails the password more than five times, the user should be blocked and an email be sent to the administrators. 2. Business specific (authentication required): 2.1. Immediately after login the “personal dashboard” should be presented to the user.
138
2.1.1. In the first use a default dashboard with generic metrics/KPIs should be presented. This dashboard should have both gauges and tables data displays. 2.2. The user should be able to customize his/her dashboard, by using predefined widgets, gauges and tables with the different metrics and KPIs. 2.2.1. The system should present a list of available metrics/KPIs and the appropriated gauges for the user to select which to use. 2.2.2. The system should present a list of tables with common hotel reports that the user can add to his/her dashboard. 2.3. By pressing widgets and gauges, users should be able to access tables of the data that originated the metrics/KPIs. 2.3.1. All gauges and tables should permit the slice and dice and/or the drilling down into the data used to calculate the presented values. 2.4. Data tables should have slice and dice, and drill down capabilities, so that users can explore the data in different dimensions, going, when possible, to the transactional or raw data level. 2.4.1. When possible, users should be able to explore the data using pivot tables. 2.5. Users should be able to create their own pivot tables, by selecting the facts and dimensions, with the ability to create hierarchies. 2.5.1. When possible, users should be able to create their own pivot tables, name them and add them to their dashboard. 2.6. On the dashboard users should be able to add shortcuts to other pages with other gauges, reports or pivot tables. 2.6.1. Users should be able to add more pages (levels) to their main dashboard and add widgets, gauges and tables to those pages. 2.7. Users should be able to define the amount of time between data updates from the different data sources. 2.7.1. “Administrators” should be able to configure the amount of time between each data source data extraction and check the system health. 2.7.2. Users should be able to configure the dashboard update interval.
139
BO functions: 3. Business specific (only authenticated system administrators): 3.1. The system should be able to acquire the raw data almost in real time. 3.2. The ETL process should be fast, so that metrics and KPIs should be available to users in a timely way. 3.3. The system should be able to deliver the information required by users in a fast way, independently of the facts and dimensions that the users select for the basis of their metrics and KPIs. 3.3. Performance requirements To considerer the system viable, apart from capacity to obtain the data for all established metrics and KPIs, three types of measurements should present results according to the following specifications: •
System setup ETL processes: o The initial ETL process, should take no longer than 48 hours to complete. This process should at least load three years of historic data into the system (if information is available and required). o The initial ETL process of a new hotel should not interfere or cause any significant delays (>10%) to the normal day-to-day ETL processes of other hotels.
•
Day by day ETL processes: o The system should be able to do the full ETL process from relevant sources in a minimum of two-minute cycles. o A peak in the volume of data of a determined data source should not cause delays in the processing of other sources by more than 30 seconds.
•
FO usability: o The time necessary to insert a yearly budget should not be more than two hours. o The time to collect data and to display or update any dashboard should not exceed five seconds.
140
o The drilling down, hierarchy navigation or table opening for the purpose of exploring the data, should never take more than 10 seconds to display the required information. o The maximum acceptable downtime per month is 03h30m (0.05% of time). 3.4. Logical database requirements As one of the pillars of the system, the databases that make up the data warehouse must be designed in a way that they can fulfill all specifications. To do that, and as described in Figure 1 there should be two logical database sets. One global and common set to all system execution (Figure 5) and one that should incorporate databases specific to each hotel (Figure 6). Figure 5: System logical database diagram
Source: Author’s elaboration
141
Figure 6: Hotel logical database diagram
Source: Author’s elaboration
3.5. Design constrains Because this project is part of a Thesis and must be submitted in a predefined timeframe, the prototype should be developed according to the project schedule so that it can be deployed for evaluation at the expected time. Therefore, all decisions on design that could affect the project deadline should be revised and alternatives should be found. 3.6. Software system attributes 3.6.1. Reliability The system should present: •
Timely data;
•
Correct and auditable metrics/KPIs;
•
Consistent data across all system.
142
3.6.2. Availability The data center infrastructure, as well the ETL application agents installed locally in hotels and their required infrastructure, should have in place disaster/recovery methods that in the event of a crisis permits the rapid deployment of the system on different hardware or the restoration of database backups. 3.6.3. Security Security wise, the system has two critical points that need to be addressed: •
Communication and data reading: the ETL processes should read information from the data sources and transform it always using secure communications protocols like SSL or encrypt the data when that is not possible. Also, when presenting the information to users, all information should be communicated using SSL to avoid “sniffing”.
•
Access to data warehouse: the high sensitive content of the data stored on the system and the value it could have for other hotels that compete with the hotels using the system, could prove a tempting reason for unauthorized data access trials. For that reason, the access to the data warehouse should be restricted to the applications inside the data center or applications that pass through a minimum of two layers of authentication.
3.6.4. Maintainability and portability No operations should interfere with the availability of the system. The only exception should be major upgrades on the data center servers that eventually require any reset or changes to the webserver application. For that reason, all other applications should be constructed in a way that they can be run distributed on different servers and in multiple instances if necessary. That way maintenance of the system should be made without the need to suspend the system availability.
143
Appendix VI- Presentation slides made to hoteliers These are the slides of the presentation made to invite hoteliers to participate in the project.
144
145
146
147
148
Appendix VII- Non-disclosure agreement template
!
CONFIDENTIALITY,AGREEMENT,
! ! I, _________________________________________________________ (a) as
point
of
contact
on
___________________________________________________________ (b) for the implementation of the Hotel Performance Dashboard project developed by Nuno Miguel da Conceição António, student number 46630 of Escola Superior de Gestão, Hotelaria e Turismo of Universidade do Algarve, as part of his work to obtain the Master degree in Hotel Management and Direction, took acknowledge that he compromises to guarantee the confidentiality and anonymity of the hotel data used in this project, as well to guarantee that the data is only used in the scope of the project.
Portimão, ___, of March of 2014 ! ! _____________________________________________!
____________________________________________!
Signature!of!(a)!
Signature!of!the!student!
!
!
!
! ! (a) Full!name!of!hotel!point!of!contact! (b) Hotel!name!
! !
149
Appendix VIII- System architecture diagram – iteration 2
Source: Author’s elaboration
150
Appendix IX- List of measures, metrics and indicators
Data sources ID#
Designation CI
ERP
MKT
PMS
SR
STR
WEA
Bibliographic reference (when applied)
Iteration
001
Air temperature (current)
✓
2
002
Air temperature (minimum forecasted)
✓
2
003
Air temperature (maximum forecasted)
✓
2
004
Precipitation (last hour)
✓
2
005
Qualitative (icon)
✓
2
006
Rain probability (percentage – forecast)
✓
2
007
Ultra violet factor
✓
2
008
Wind direction
✓
2
009
Wind speed
✓
2
010
Global (GRI)
011
forecast
✓
Anderson (2012)
2
Number of reviews
✓
Anderson (2012)
2
012
Number of concepts mentions in reviews
✓
013
Minimum price per room type
✓
2
014
Inventory available for sale
✓
2
015
review
index
Number/average guests per room
2
✓
American Hotel & Lodging Association et al. (2006)
3
3
016
Number of stays/guests
✓
American Hotel & Lodging Association et al. (2006)
017
Stays/guests occupancy rate
✓
Hayes & Miller (2011)
3
018
Room nights available (for sale)
✓
American Hotel & Lodging Association et
3
151
al. (2006)
019
020
Room capacity/total inventory
nights room
Room nights occupied
✓
American Hotel & Lodging Association et al. (2006)
3
✓
American Hotel & Lodging Association et al. (2006)
3
✓
American Hotel & Lodging Association et al. (2006)
3
3
021
Room nights occupancy rate
022
Room nights out-ofuse/not available for rent
✓
American Hotel & Lodging Association et al. (2006)
023
Booking time
✓
Hayes & Miller (2011)
3
✓
American Hotel & Lodging Association et al. (2006)
3
3
024
window/lead
Length of stay (LOS)
025
Room arrivals
✓
American Hotel & Lodging Association et al. (2006)
026
Non room revenue
✓
Hayes & Miller (2011)
3
027
Non quota
✓
Hayes & Miller (2011)
3
028
Room revenue
✓
Hayes & Miller (2011)
3
029
Room revenue quota
✓
Hayes & Miller (2011)
3
030
Total revenue
✓
Hayes & Miller (2011)
3
031
Average booking window/lead time (ABW)
✓
Hayes & Miller (2011)
3
032
Average length of stay (ALOS)
✓
American Hotel & Lodging Association et al. (2006)
3
✓
American Hotel & Lodging Association et al. (2006)
3
033
room
Average (ARR)
revenue
room
rate
152
034
Multiple occupancy rate
✓
American Hotel & Lodging Association et al. (2006)
035
Number of guests st staying for the 1 time (unique stays)
✓
Hayes & Miller (2011)
3
036
Number of guests that have stayed before in the hotel (repeat stays)
✓
Hayes & Miller (2011)
3
037
Repeat guests ratio
✓
Hayes & Miller (2011)
3
038
Revenue per available room (RevPAR)
✓
American Hotel & Lodging Association et al. (2006)
3
039
Total revenue available (TRevPAR)
✓
American Hotel & Lodging Association et al. (2006)
3
040
Market share (stays)
✓
✓
Adapted from Hayes & Miller (2011)
3
041
Fair share (stays)
✓
✓
Adapted from Hayes & Miller (2011)
3
042
Average (ARR)
✓
American Hotel & Lodging Association et al. (2006)
3
3
room
per room
rate
3
043
Average Length of stay
✓
American Hotel & Lodging Association et al. (2006)
044
Non room revenue
✓
Hayes & Miller (2011)
3
045
Non quota
✓
Hayes & Miller (2011)
3
046
Room revenue
✓
Hayes & Miller (2011)
3
047
Room revenue quota
✓
Hayes & Miller (2011)
3
048
Total revenue
✓
Hayes & Miller (2011)
3
049
Number of properties
✓
050
Room capacity/total inventory
room
revenue
nights room
✓
3 American Hotel & Lodging Association et al. (2006)
3
153
051
Room nights occupied
052
Room (nights) occupancy rate
053
Room nights out-ofuse/not available for rent
054
Number of stays/guests
✓
American Hotel & Lodging Association et al. (2006)
3
✓
American Hotel & Lodging Association et al. (2006)
3
✓
American Hotel & Lodging Association et al. (2006)
3
✓
American Hotel & Lodging Association et al. (2006)
3
✓
American Hotel & Lodging Association et al. (2006)
3
✓
American Hotel & Lodging Association et al. (2006)
3
055
Revenue per available room (RevPAR)
056
Total revenue available (TRevPAR)
057
Stays/guests capacity
✓
Hayes & Miller (2011)
3
058
Stays/guests occupancy rate
✓
Hayes & Miller (2011)
3
059
Average (ARR)
✓
American Hotel & Lodging Association et al. (2006)
3
✓
American Hotel & Lodging Association et al. (2006)
3
✓
American Hotel & Lodging Association et al. (2006)
3
060
room
per room
rate
Room (nights) occupancy rate
061
Revenue per available room (RevPAR)
062
Changes in production inventories
✓
Freitas (2009)
4
063
Cost of the consumed materials and of the sold goods
✓
Freitas (2009)
4
064
External services
✓
Freitas (2009)
4
065
Gain/losses attributed to subsidiaries, associates and joint ventures
✓
Freitas (2009)
4
supplies
and
154
066
Gross Operation Profit (GOP)
✓
Adapted from Freitas (2009) and Gross Operation Profit (GOP)
067
Impairment of accounts receivable (losses/reversals)
✓
Freitas (2009)
4
068
Impairment inventories (losses/reversals)
✓
Freitas (2009)
4
069
Impairment of nondepreciable investments (losses/reversals)
✓
Freitas (2009)
4
070
Increases/decreases fair value
✓
Freitas (2009)
4
✓
Adapted from Monteiro & Almeida (2012) and American Hotel & Lodging Association et al. (2006)
4
✓
Adapted from Monteiro & Almeida (2012) and American Hotel & Lodging Association et al. (2006)
4
071
4
of
in
Inventory balance
072
Inventory (days)
turnover
073
Net operating income or Earnings Before Interests, Taxes, Depreciations and Amortizations (EBITDA)
✓
Freitas (2009)
4
074
Other expenses losses
✓
Freitas (2009)
4
075
Other income and gains
✓
Freitas (2009)
4
076
Other expenses losses
✓
Freitas (2009)
4
077
Provisions (increases/reductions)
✓
Freitas (2009)
4
078
Sales of goods
✓
Freitas (2009)
4
079
Sales of services
✓
Freitas (2009)
4
080
Staff costs
✓
Freitas (2009)
4
081
Total costs
✓
Adapted from Freitas (2009)
4
082
Total credits (accounts receivable)
✓
Adapted from Freitas (2009)
4
and
and
155
and Hales (2005)
083
Total debits (accounts payable)
✓
Adapted from Freitas (2009) and Hales (2005)
4
084
Works made entity itself
✓
Freitas (2009)
4
085
Number of employees
✓
Hales (2005)
4
086
Employee percentage
✓
Hales (2005)
4
087
Average cost to acquire each new guest room night
✓
✓
Adapted from Hales (2005) and (O’Neill, 2014)
4
088
Average number of employees per occupied room
✓
✓
Hales (2005)
4
089
Gross operating profit per available room (GOPPAR)
✓
✓
American Hotel & Lodging Association et al. (2006)
4
090
Percentage of labor costs over revenue
✓
Adapted from Hales (2005)
4
091
Percentage of labor costs over total costs
✓
Adapted from Hales (2005)
4
092
Percentage of training costs over labor costs
✓
Adapted from Hales (2005)
4
093
Ratio of commissions over revenue
✓
Adapted from Hayes & Miller (2011)
4
for
the
turnover
Legend: •
Data sources: o CI – Competitive Intelligence prices and inventories; o ERP – Enterprise resource planning system; o MKT – Market supply and demand; o PMS – Property management system; o SR – Social reputation; o STR – Market (Smith Travel Research); o WEA – Weather.
•
Iteration – number of the iteration where the metric/indicator started to be use.
156
Appendix X- General features of the website Figure X. 1 and Figure X. 2 demonstrate the login and the general characteristics of the website, illustrated and explained respectively. Figure X. 1: Login page
Source: Author’s elaboration
SSL certificate seal that authenticates the security of communications
Figure X. 2: First page - main characteristics
Hotel name
Page refresh time configuration
Application “about”
Source: Author’s elaboration
Application menu
User name 157
Figure X. 3 depicts how information about the metrics/indicators was obtained. This information is displayed in a box that can be seen in every chart/window by pressing the icon on the upper left corner of every window/chart. In this box detailed information is displayed about what the user is seeing, the data sources where the information come from and the date it was last updated. By doing this, the system enforces two characteristics that metrics and indicators must have accordingly to Eckerson (2011): that is simple and ability to be referenced. Figure X. 3: Metric/indicator information on social reputation page
Source: Author’s elaboration
Other kind of information displayed is the tooltip that can be viewed by hovering the mouse or pressing a data point in any dataset of a chart. The example Figure X. 4 shows the tooltip displayed when hovering on the price of a particular hotel dataset, in the CI prices and inventories chart analyses. Most of these charts and graphics can be resized by dragging the lower or right extremities of the chart and their order in the page can also be changed, by pressing the title of the chart and dragging it to another position on the webpage, thus permitting users to adapt the dashboard to their preferences as recommended by and Eckerson (2011) and Few (2006).
158
Figure X. 4: Tooltip with data point information
Source: Author’s elaboration
Another important characteristic of the system is the simple way in which analytic features are implemented. As characterized by Eckerson (2011) in the “MAD Framework” (see Chapter 2), a PM system must have analytics capabilities. To do so, the system must have drilldown, segmentation and filter capabilities, among others. These analytic features are easy accessible. In Figure X. 5 it’s displayed a chart with different datasets (prices per hotel, per day). If pressed the name of the dataset in the label area of the chart, as depicted in Figure X. 6 the dataset information is hidden and comparisons are easily made. Figure X. 5: Chart with next all datasets displayed
Source: Author’s elaboration
159
Figure X. 6: Chart with four datasets turned off
Source: Author’s elaboration
Another important analytical feature can also be seen in the chart depicted in the above two figures. The dropdown lists in the bottom of the chart enable the user to segment/filter the information displayed.
160
Appendix XI- Master database Entity Relationship Diagram 1 Hotel
FK_CompSet_Hotel CompSet CompSetID: INTEGER HotelID: INTEGER (FK)
FK_CompSet_Hotel1
CompetitorID: INTEGER (FK)
Shared_SletohCalls
HotelID: INTEGER
ID: INTEGER
Name: VARCHAR(35)
SletohHotelID: INTEGER
HotelURLID: VARCHAR(20)
CallRequestDateTime: DATETIME
Type: TINYINT(3)
RequestParameters: BLOB
OnlyCompetitor: BIT
CallResponseDateTime: DATETIME
LocationID: INTEGER (FK)
FullResponse: TEXT
StarsClassification: TINYINT(3)
HotelsUpdateDateTime: DATETIME
WebservicesUsername: VARCHAR(15) WebservicesPassword: VARCHAR(15) DatabaseServerName: VARCHAR(100)
Shared_ITSYSCalls
DatabaseName: VARCHAR(100)
ID: INTEGER
DatabaseServerUserLogin: VARCHAR(15)
CallRequestDateTime: DATETIME
DatabaseServerUserPassword: VARCHAR(15)
RequestParameters: BLOB
ReviewproPID: INTEGER
CallResponseDateTime: DATETIME
SletohHotelID: INTEGER
FullResponse: TEXT
ITSYSHotelID: VARCHAR(100)
HotelsUpdateDateTime: DATETIME
FK_Hotel_Location
Shared_ReviewproCalls ID: INTEGER PID: INTEGER
Shared_MarketData
CallRequestDateTime: DATETIME
ID: INTEGER LocationID: INTEGER (FK) Type: TINYINT(3)
RequestParameters: BLOB FK_Shared_MarketData_Location
CallResponseDateTime: DATETIME
Location
StarsClassification: TINYINT(3)
LocationID: INTEGER
FullResponse: TEXT
LastUpdateDateTime: DATETIME
Designation: VARCHAR(30)
HotelsUpdateDateTime: DATETIME
HotelsUpdateDateTime: DATETIME
NUTSIIRegion: TINYINT(3) WundergroundCountryCode: VARCHAR(2) WundergoundCityName: VARCHAR(20)
Shared_WundergoundCalls ID: INTEGER LocationID: INTEGER CallRequestDateTime: DATETIME RequestParameters: VARCHAR(200) CallResponseDateTime: DATETIME FullResponse: TEXT HotelsUpdateDateTime: DATETIME
ExternalProvidersQueue
Market_Yearly
Market_Monthly
ExternalProvidersQueueID: INTEGER
ID: INTEGER
CreationDateTime: DATETIME
Year: SMALLINT(5)
Year: SMALLINT(5)
AgentType: TINYINT(3)
Type: TINYINT(3)
Month: TINYINT(3)
TaskDetails1: VARCHAR(20)
StarsClassification: TINYINT(3)
GuestsTotal: INTEGER
TaskDetails2: DATE
NumberHotels: INTEGER
GuestsOccupationPercentage: REAL(7)
TaskDetails3: VARCHAR(20)
GuestCapacity: INTEGER
RoomsOccupationPercentage: REAL(7)
ProcessingDateTimeBeginning: DATETIME
RoomCapacity: INTEGER
LastUpdate: DATETIME
ProcessingAgentIP: VARCHAR(15)
TotalGuests: INTEGER
SourceInformation: BLOB
ErrorCounter: SMALLINT(5)
GuestsOccupationRate: REAL(7)
ProcessingDateTimeEnd: DATETIME
RoomOccupationRate: REAL(7)
Void: BIT
RoomRevenue: INTEGER
ID: INTEGER
TotalRevenue: INTEGER RevPAR: FLOAT(15) ALOS: REAL(7) LastUpdate: DATETIME SourceInformation: BLOB
161
Appendix XII- Transactional databases Entity Relationship Diagram 1 AdhocReport
BSCGoals ID: INTEGER
ID: INTEGER
Year: SMALLINT(5)
Name: VARCHAR(100)
IndicatorID: SMALLINT(5)
ReportLayout: TEXT
BoardTypeID: TINYINT(3)
ToleranceType: TINYINT(3)
CreationDateTime: DATETIME
Name: VARCHAR(15)
Polarity: TINYINT(3)
CreatedByUserID: INTEGER (FK)
Tolerance: FLOAT(15)
LastUpdate: DATETIME
Goal_Jan: FLOAT(15)
LastUpdateByUserID: INTEGER (FK)
CI_BoardType
Goal_Feb: FLOAT(15) Goal_Mar: FLOAT(15) Goal_Apr: FLOAT(15) Goal_May: FLOAT(15) Goal_Jun: FLOAT(15)
FK_AdhocReport_User
Goal_Jul: FLOAT(15) Goal_Aug: FLOAT(15)
FK_AdhocReport_User1
CI_RoomType
Goal_Sep: FLOAT(15)
RoomTypeID: TINYINT(3)
Goal_Oct: FLOAT(15)
Name: VARCHAR(10)
Goal_Nov: FLOAT(15) Goal_Dec: FLOAT(15) Goal_Year: FLOAT(15) LastUpdate: DATETIME
User FK_User_User
UserID: INTEGER (FK) Name: VARCHAR(30) Email: VARCHAR(250) Password: VARCHAR(66) UserProfileID: INTEGER (FK)
FK_UserPageConfig_User
UserPageConfig
FK_Log_BackOffice_User
FK_UserPageLayout_User
UserLog
UserPageID: INTEGER
FK_User_UserProfile
UserID: INTEGER (FK)
LogID: INTEGER DateAndTime: DATETIME
Webpage: VARCHAR(250)
UserID: INTEGER (FK)
RefreshInSeconds: INTEGER
Operation: TINYINT(3)
FK_PageLog_BackOffice_User
ExternalIP: VARCHAR(45) HostIP: VARCHAR(45)
UserPageLayout UserPageID: INTEGER
FK_SocialRepSM_Hotel
UserID: INTEGER (FK) PageID: INTEGER
UserProfile
SortOrder: INTEGER
UserProfileID: INTEGER
ChartType: INTEGER
Designation: VARCHAR(30)
Width: INTEGER
WeatherGeneral: BIT
Height: INTEGER
SocialReputationGeneral: BIT
FK_SocialRepSWD_Hotel
PMSReputationGeneral: BIT AccountingGeneral: BIT CompetitiveIntelligence: BIT BudgetInformation: BIT MarketInformation: BIT UserPageLog LogID: INTEGER UserID: INTEGER (FK) Webpage: VARCHAR(250) EnterDateAndTime: DATETIME
FK_SocialRepLRI_Hotel
LastPingDateAndTime: DATETIME
162
2 CompetitiveIntelligence FK_CompetitiveIntelligence_CI_BoardType
FK_CompetitiveIntelligence_CI_RoomType
FINAccountsMonthlyAccumulates
CIID: INTEGER
ID: INTEGER
Shared_SletohCallID: INTEGER
AccountID: INTEGER (FK)
HotelID: INTEGER (FK)
ObservationDateTime: DATETIME
ObservationDateTime: DATETIME
LastUpdate: DATETIME
LookupDateTime: DATETIME
M0DB: FLOAT(15)
SupplierID: SMALLINT(5) (FK)
M1DB: FLOAT(15)
RoomTypeID: TINYINT(3) (FK)
M2DB: FLOAT(15)
MaxPersonsOnRoom: TINYINT(3)
M3DB: FLOAT(15)
QuantityAvailable: SMALLINT(5)
M4DB: FLOAT(15)
BoardTypeID: TINYINT(3) (FK)
M5DB: FLOAT(15)
Price: FLOAT(15)
M6DB: FLOAT(15)
Currency: VARCHAR(3)
M7DB: FLOAT(15) M8DB: FLOAT(15) M9DB: FLOAT(15)
FK_CompetitiveIntelligence_Hotel
M10DB: FLOAT(15) M11DB: FLOAT(15) FK_CompetitiveIntelligence_CI_Supplier
M12DB: FLOAT(15) M13DB: FLOAT(15) M14DB: FLOAT(15) M15DB: FLOAT(15)
HotelDimension
M0CR: FLOAT(15)
HotelID: INTEGER
M1CR: FLOAT(15)
Name: VARCHAR(35)
M2CR: FLOAT(15)
OnlyCompetitor: BIT
CI_Supplier
HotelURLID: VARCHAR(20)
M3CR: FLOAT(15)
SupplierID: SMALLINT(5)
M4CR: FLOAT(15)
Name: VARCHAR(40)
M5CR: FLOAT(15)
Shared_SletohCallID: INTEGER
M6CR: FLOAT(15) M7CR: FLOAT(15) M8CR: FLOAT(15) M9CR: FLOAT(15) M10CR: FLOAT(15) M11CR: FLOAT(15) M12CR: FLOAT(15) M13CR: FLOAT(15) M14CR: FLOAT(15) M15CR: FLOAT(15) M1BU: FLOAT(15) M2BU: FLOAT(15) M3BU: FLOAT(15) M4BU: FLOAT(15) M5BU: FLOAT(15) M6BU: FLOAT(15) M7BU: FLOAT(15) M8BU: FLOAT(15) M9BU: FLOAT(15)
FK_SocialRepLD_Hotel
M10BU: FLOAT(15) M11BU: FLOAT(15) M12BU: FLOAT(15)
PMSDimDistributionChannel DistributionChannelID: VARCHAR(3) FK_SocialRepLRD_Hotel
Designation: VARCHAR(25)
PMSDimCompany CompanyID: INTEGER Name: VARCHAR(30)
FK_SocialRepAS_Hotel
PMSDimNationality NationalityID: SMALLINT(5) Designation: VARCHAR(25) ISO3166a2: VARCHAR(2) ISO3166a3: VARCHAR(3)
SocialRepLD SRLDID: INTEGER Shared_ReviewproCallID: INTEGER HotelID: INTEGER (FK) LanguageID: VARCHAR(2) (FK)
PMSDimCardex CardexID: INTEGER Name: VARCHAR(70)
ObservationDateTime: DATETIME LookupDateTime: DATETIME NegativeReviews: INTEGER NeutralReviews: INTEGER PositiveReviews: INTEGER
163
3 FINResultsDemoConfig
FINDimAccountPlan
FINYearsOnDB
ID: INTEGER
ID: INTEGER
Year: SMALLINT(5)
Year: SMALLINT(5)
ID: INTEGER Year: SMALLINT(5)
AccountNumber: VARCHAR(20)
Order: SMALLINT(5)
LastUpdate: DATETIME
Description: VARCHAR(100)
Description: VARCHAR(75)
LastUpdate: DATETIME
Accounts: TEXT AggregationLevel: TINYINT(3) LastUpdate: DATETIME
FK_FINAccountsMonthlyAccumulates_FINDimAccountPlan
HREmployee ID: INTEGER
Market_Yearly ID: INTEGER
HREmployeeMap ID: INTEGER
HRSystemID: VARCHAR(10)
Year: SMALLINT(5)
Name: VARCHAR(80)
HRSystemID: VARCHAR(10)
AdmissionDate: DATE
Name: VARCHAR(80)
DemissionDate: DATE
AdmissionDate: DATE
HabilitationCode: VARCHAR(3)
DemissionDate: DATE
LastUpdate: DATETIME
HabilitationCode: VARCHAR(3) LastUpdate: DATETIME
Year: SMALLINT(5) Type: TINYINT(3) StarsClassification: TINYINT(3) NumberHotels: INTEGER
Market_Monthly_STR
Market_Monthly
GuestCapacity: INTEGER
ID: INTEGER
ID: INTEGER
RoomCapacity: INTEGER TotalGuests: INTEGER GuestsOccupationRate: REAL(7) RoomOccupationRate: REAL(7) RoomRevenue: INTEGER TotalRevenue: INTEGER RevPAR: FLOAT(15)
Year: SMALLINT(5)
Year: SMALLINT(5)
Month: TINYINT(3)
Month: TINYINT(3)
GuestsTotal: INTEGER
RoomsCapacity: INTEGER
GuestsOccupationPercentage: REAL(7)
RoomNightsOccupied: INTEGER
RoomsOccupationPercentage: REAL(7)
RoomsOccupationPercentage: REAL(7)
LastUpdate: DATETIME
ARR: FLOAT(15)
SourceInformation: BLOB
RoomRevenue: INTEGER
ALOS: REAL(7)
RevPAR: FLOAT(15)
LastUpdate: DATETIME
LastUpdate: DATETIME
SourceInformation: BLOB
SourceInformation: BLOB
PMSDimMeal
PMSDimMarketSegment
MealID: CHAR(1) Designation: VARCHAR(10)
MarketSegmentID: VARCHAR(2)
FK_PMSFactProduction_PMSDimMeal1 FK_PMSFactProduction_PMSDimMeal
Abbreviation: VARCHAR(3)
Designation: VARCHAR(25)
PMSFactProduction Date: DATETIME FolioNumber: INTEGER (FK) ReservationStatusID: CHAR(1) (FK) MealID: CHAR(1) (FK) NationalityID: SMALLINT(5) (FK)
PMSDimRoomType
MarketSegmentID: VARCHAR(2) (FK) FK_PMSFactProduction_PMSDimDistributionChannel
DistributionChannelID: VARCHAR(3) (FK)
RoomTypeID: CHAR(1) FK_PMSFactProduction_PMSDimRoomType
Designation: VARCHAR(5) ShouldAffectStatistics: TINYINT(3)
CardexID: INTEGER (FK) CompanyID: INTEGER (FK) RoomID: VARCHAR(5) (FK) ReservedRoomTypeID: CHAR(1) (FK) FK_PMSFactProduction_PMSDimCompany
FK_PMSFactProduction_PMSDimRoomType1
RealRoomTypeID: CHAR(1) (FK) RoomQtyForStatistics: INTEGER Adults: TINYINT(3) Children: TINYINT(3) ChildrenNoPay: TINYINT(3) Babies: TINYINT(3)
FK_PMSFactProduction_PMSDimNationality
TotalGuestsAffectStatistics: INTEGER Total_Dep_A: DECIMAL(12, 2) Total_Dep_B: DECIMAL(12, 2) Total_Dep_C: DECIMAL(12, 2) Total_Dep_D: DECIMAL(12, 2)
FK_PMSDimRoom_PMSDimRoomType
Total_Dep_E: DECIMAL(12, 2) Total_Dep_F: DECIMAL(12, 2) FK_PMSFactProduction_PMSDimCardex
Total_Dep_G: DECIMAL(12, 2) IsArrival: TINYINT(3) BookingWindow: INTEGER IsRepeatedGuest: TINYINT(3)
FK_PMSFactProduction_PMSDimRoom FK_PMSFactProduction_PMSDimReservationStatus
FK_PMSFactProduction_PMSDimReservation
164
5
SocialRepLRI
SocialRepSM
SRLRIID: INTEGER
SRSMID: INTEGER
Shared_ReviewproCallID: INTEGER
Shared_ReviewproCallID: INTEGER HotelID: INTEGER (FK) ObservationDateTime: DATETIME
FK_SocialRepSM_SocialRepConcepts
HotelID: INTEGER (FK) SocialRepConcepts
ObservationDateTime: DATETIME
SRConceptID: INTEGER
LookupDatetime: DATETIME
LookupDateTime: DATETIME
Shared_ReviewproCallID: INTEGER
Qualification: TINYINT(3)
HotelID: INTEGER
SRConceptID: INTEGER (FK)
SRRatingTypeID: INTEGER (FK) RatingValue: FLOAT(15)
LanguageID: VARCHAR(2) (FK)
NumberOfReviews: INTEGER
SemanticID: INTEGER SocialRepSWD SRSWDID: INTEGER
SemanticDescription: VARCHAR(50) ObservationDateTime: DATETIME
FK_SocialRepLRI_SocialRepRatingsType
Shared_ReviewproCallID: INTEGER HotelID: INTEGER (FK) FK_SocialRepLD_SocialRepLanguage
ObservationDateTime: DATETIME LookupDateTime: DATETIME SRDistributorID: INTEGER (FK)
FK_SocialRepConcepts_SocialRepLanguage SocialRepRatingsType
ScoreOf: INTEGER
SRRatingTypeID: INTEGER
PreviousGRI: FLOAT(15)
Designation: VARCHAR(15)
Score: FLOAT(15) Recommendation: FLOAT(15) GRI: FLOAT(15) RankingOf: INTEGER Ranking: INTEGER
SocialRepLanguage LanguageID: VARCHAR(2) Designation: VARCHAR(15)
FK_SocialRepSWD_SocialRepDistributors
FK_SocialRepAS_SocialRepDistributors
SocialRepDistributors SRDistributorID: INTEGER Name: VARCHAR(40) Shared_ReviewproCallID: INTEGER
165
6
Weather
SocialRepLRD
WeatherID: INTEGER
SRLRDID: INTEGER
Shared_WundergoundCallsID: INTEGER
SRRatingTypeID: INTEGER (FK)
ObservationDateTime: DATETIME
Shared_ReviewproCallID: INTEGER
TemperatureInCelsius: FLOAT(15)
HotelID: INTEGER (FK)
RelativeHumidityInPercentage: VARCHAR(5)
ObservationDateTime: DATETIME
WindDirection: VARCHAR(5)
LookupDateTime: DATETIME
WindDegrees: SMALLINT(5)
NegativeReviews: INTEGER
WindInKph: FLOAT(15)
NeutralReviews: INTEGER
WindGustInKph: FLOAT(15)
PositiveReviews: INTEGER
UV: FLOAT(15) Precipitation1HourInMeters: FLOAT(15)
FK_SocialRepLRD_SocialRepRatingsType
PrecipitationTodayInMeters: FLOAT(15) IconURL: VARCHAR(150) ForecastedPeriods: TINYINT(3)
SocialRepAS SRASID: INTEGER
FK_WeatherForecast_Weather
Shared_ReviewproCallID: INTEGER HotelID: INTEGER (FK) ObservationDateTime: DATETIME LookupDateTime: DATETIME SRDistributorID: INTEGER (FK) NegativeReviews: INTEGER
WeatherForecast
NeutralReviews: INTEGER
WeatherForecastID: INTEGER
PositiveReviews: INTEGER
WeatherID: INTEGER (FK) Period: TINYINT(3) DateAndTimeOfForecast: DATETIME MaxTemperatureInCelsius: TINYINT(3) MinTemperatureInCelsius: TINYINT(3) ConditionsInText: VARCHAR(50) IconURL: VARCHAR(150) ProbabilityOfPrecepitation: TINYINT(3) QuantityOfPrecipitationInMM: SMALLINT(5) MaxWindDirection: VARCHAR(5) MaxWindDegrees: SMALLINT(5) MaxWindInKph: SMALLINT(5) AvgWindDirection: VARCHAR(5) AvgWindDegrees: SMALLINT(5) AvgWindInKph: SMALLINT(5)
166
7
PMSDimReservationStatus
PMSDimRoom
ReservationStatusID: CHAR(1)
RoomID: VARCHAR(5)
Designation: VARCHAR(20)
RoomTypeID: CHAR(1) (FK) ShouldAffectStatistics: TINYINT(3) RegularOccupation: SMALLINT(5)
FK_PMSDimReservation_PMSDimReservationStatus
PMSDimReservation PMSFactRoomTotals ID: DATETIME TotalRooms: INTEGER OutOfOrder: INTEGER Occupied: INTEGER Available: INTEGER ArrivalRooms: INTEGER DepartureRooms: INTEGER LastUpdate: DATETIME
DimTime
FolioNumber: INTEGER
PK_Date: DATETIME
Name: VARCHAR(70)
Date_Name: VARCHAR(50)
ArrivalDate: DATETIME
Year: DATETIME
Nights: INTEGER
Year_Name: VARCHAR(50)
DepartureDate: DATETIME
Month: DATETIME
Quantity: INTEGER
Month_Name: VARCHAR(50)
ReservationDate: DATETIME
Week: DATETIME
ReservationStatus: CHAR(1) (FK)
Week_Name: VARCHAR(50)
ReservationStatusDate: DATETIME
Day_Of_Year: INTEGER
BookingWindow: INTEGER
Day_Of_Year_Name: VARCHAR(50)
IsCanceled: TINYINT(3)
Day_Of_Month: INTEGER
CancelationWindow: INTEGER
Day_Of_Month_Name: VARCHAR(50) Day_Of_Week: INTEGER Day_Of_Week_Name: VARCHAR(50) Week_Of_Year: INTEGER Week_Of_Year_Name: VARCHAR(50) Month_Of_Year: INTEGER Month_Of_Year_Name: VARCHAR(50)
167
Appendix XIII- Dimensional databases diagram
168
Appendix XIV- Slides of presentation made to hoteliers on iteration 2
Final&work&to&achieve&the°ree&of&&
Master&in&Science&in&Hotel&Direc8on&and&Management& & & & &
&
Author:&Nuno&António& Oriented&by:&Prof.&Francisco&Serra,&Phd&
expected'(me'frame' 01'Jul.' • Hotels'evalua(on'–'Phase'1'
11'Aug.'
21'Jul.' • Hotels'evalua(on'–'Phase'2'
• Hotels'evalua(on'–'Phase'3'
01'Sep.'
31'Aug.' • End'of'evalua(on'in'hotels'
• Data'collec(on'and'report'elabora(on'
30'Sep.' • Project'end'
169
phases& data$sources$to$implement$$ • Phase&1:&
– Weather& – Compe00ve&Intelligence&(comp&set):& • Prices& • Social&Reputa0on&
– Social&Reputa0on&
• Phase&2:&
– Market&supply/demand& – PMS&
• Phase&3:&
– Accoun0ng/finance&
phase&1& why$these$data$sources$ • Weather& is& a& very& important& factor& in& the& Algarve&hotels&occupancy& • Most& hotels& have& access& to& PMS& and& finance& data,& but& not& for& social& reputa>on& or& compe>>ve&intelligence&
170
Price! and! Guest* Experience* Factors! could! be! influenced! by!the!hotel!team!
social'reputa-on'
Source:'ReviewPro'
171
social'reputa-on' factors(that(influence(classifica1on( Algorithm'evaluates:' • Number'of'reviews' • Frequency'of'reviews' • Reviews'quality' • Among'others'
compe&&ve(intelligence( prices'and'inventory' “The%importance%of%understanding%the%pricing% behavior%of%direct%compe6tors%is%cri6cal%to% effec6ve%strategy%formula6on%and%meaningful% industry%analysis”%
172
phase&1& expecta'ons+ • Provide&informa1on&that&could&be&used&to& respond&quicker&to&market&and&environmental& changes&(comp&set&prices/inventory&and&weather)& • &Provide&informa1on&on&the&hotel&and& compe11ve&set&social&reputa1on&so&that&the& hotel&can:& – Correct&the&less&good&aspects&& – Take&advantage&on&the&beBer&aspects&it&has&over&the& compe11ve&set& – Engage&guests&in&a&way&to&increase&the&number&of& reviews&
We…$ • Will$be$wai*ng$for:$ – Comments$ – Sugges*ons$ – Any$kind$of$ques*ons$
• Are$available$for$any$addi*onal$clarifica*ons$
173
Thank&your&for&your&,me!& &
& & & &
Author:&Nuno&António& Oriented&by:&Prof.&Francisco&Serra,&Phd&
174
Appendix XV- Weather – current/forecast page
Source: Author’s elaboration
175
Appendix XVI – Weather – dashboard page
Source: Author’s elaboration
176
Appendix XVII- CI prices and inventories page
Source: Author’s elaboration
177
Appendix XVIII- CI - social reputation page
Source: Author’s elaboration
178
Appendix XIX- Social reputation page
Source: Author’s elaboration
179
Appendix XX- System architecture diagram – iteration 3
Source: Author’s elaboration
180
Source: Author’s elaboration
Appendix XXI- PMS – Scorecard page
181
Appendix XXII- PMS – Analytics page
Source: Author’s elaboration
182
Appendix XXIII- Market – official statistics page
Source: Author’s elaboration
183
Appendix XXIV- Market – STR competitive set
Source: Author’s elaboration
184
Source: Author’s elaboration
Appendix XXV- Performance dashboard page (default)
185
Appendix XXVI- Balanced scorecard page
Source: Author’s elaboration
186
Source: Author’s elaboration
Appendix XXVII- Financial results page
187
Appendix XXVIII- Ad hoc reports page
Source: Author’s elaboration
Source: Author’s elaboration
188
Appendix XXIX- SSL certificate
189
Appendix XXX- Server security assessment report # Nmap 6.00 scan initiated Fri Aug 29 13:47:40 2014 as: nmap -p- -sV -A -oXitbase.xml 176.61.147.24 Nmap scan report for 176.61.147.24 Host is up (0.025s latency). Not shown: 65520 filtered ports PORT STATE SERVICE VERSION 21/tcp open ftp Microsoft ftpd | ssl-cert: Subject: commonName=Parallels Panel/organizationName=Parallels, Inc./stateOrProvinceName=Virginia/countryName=US | Not valid before: 2014-03-10 10:37:10 |_Not valid after: 2015-03-10 10:37:10 25/tcp open smtp MailEnable smptd 8.00-| smtp-commands: home [89.152.251.193], this server offers 4 extensions, AUTH LOGIN, SIZE 51200000, HELP, AUTH=LOGIN, |_ 211 Help:->Supported Commands: HELO,EHLO,QUIT,HELP,RCPT,MAIL,DATA,RSET,NOOP 53/tcp open domain Microsoft DNS 80/tcp open http Microsoft IIS httpd 8.0 |_http-methods: No Allow or Public header in OPTIONS response (status code 401) |_http-title: itBase 135/tcp open msrpc Microsoft Windows RPC 143/tcp open imap MailEnable imapd |_imap-capabilities: IMAP4 completed OK CAPABILITY UIDPLUSA0001 AUTH=LOGIN IMAP4rev1 IDLE CHILDREN AUTH=CRAM-MD5 443/tcp open https? 587/tcp open smtp MailEnable smptd 8.00-| smtp-commands: home [89.152.251.193], this server offers 4 extensions, AUTH LOGIN, SIZE 51200000, HELP, AUTH=LOGIN, |_ 211 Help:->Supported Commands: HELO,EHLO,QUIT,HELP,RCPT,MAIL,DATA,RSET,NOOP 3389/tcp open ms-wbt-server Microsoft Terminal Service 8172/tcp open ssl/http Microsoft IIS httpd 8.0 |_http-methods: No Allow or Public header in OPTIONS response (status code 404) | ssl-cert: Subject: commonName=WMSvc-ITBASE-PLESK | Not valid before: 2014-03-10 11:00:26 |_Not valid after: 2024-03-07 11:00:26 8401/tcp open http Microsoft IIS httpd 8.0 |_http-title: Plesk MSSQL Web Administrator | http-methods: Potentially risky methods: TRACE |_See http://nmap.org/nsedoc/scripts/http-methods.html 8443/tcp open ssl/http Microsoft IIS httpd 8.0 |_http-title: Parallels Plesk Panel 11.5.30 for Microsoft Windows |_http-favicon: Parallels Control Panel |_http-methods: No Allow or Public header in OPTIONS response (status code 200) | ssl-cert: Subject: commonName=Parallels Panel/organizationName=Parallels, Inc./stateOrProvinceName=Virginia/countryName=US | Not valid before: 2014-03-10 10:37:10 |_Not valid after: 2015-03-10 10:37:10 8880/tcp open http Microsoft IIS httpd 8.0 |_http-methods: No Allow or Public header in OPTIONS response (status code 200) |_http-title: Parallels Plesk Panel 11.5.30 for Microsoft Windows |_http-favicon: Parallels Control Panel 49154/tcp open msrpc Microsoft Windows RPC 49155/tcp open msrpc Microsoft Windows RPC Warning: OSScan results may be unreliable because we could not find at least 1 open and 1 closed port Device type: general purpose Running (JUST GUESSING): Microsoft Windows 7|2008|Vista (87%) OS CPE: cpe:/o:microsoft:windows_7::professional cpe:/o:microsoft:windows_server_2008:r2 cpe:/o:microsoft:windows_vista::- cpe:/o:microsoft:windows_vista::sp1 Aggressive OS guesses: Microsoft Windows 7 Professional (87%), Microsoft Windows Server 2008 R2 (85%), Microsoft Windows Server 2008 SP1 (85%), Microsoft Windows Vista SP0 or SP1, Windows Server 2008 SP1, or Windows 7 (85%) No exact OS matches for host (test conditions non-ideal). Network Distance: 7 hops Service Info: Host: ITBASE-PLESK.home; OS: Windows; CPE: cpe:/o:microsoft:windows TRACEROUTE (using port 21/tcp) HOP RTT ADDRESS 1 ... 6 7 21.12 ms 176.61.147.24 OS and Service detection performed. Please report any incorrect results at http://nmap.org/submit/ . # Nmap done at Fri Aug 29 14:15:36 2014 -- 1 IP address (1 host up) scanned in 1677.44 seconds
190
Appendix XXXI- Script of retrospective group interview
1. Did the system give you any new insights or called your attention to any specific issues of your business performance? If yes, can you give examples? 2. Did the system provide you access to information that helped you to make better and faster decisions? If yes, can you give examples? 3. Did the system give you access to some information to which you didn’t have access before or, at least, faster, simpler and/or easier? If yes, could you elaborate? 4. Did the system make you aware of any data quality problems existing in the systems that feed the primary data to this system? If yes, could you describe them? 5. In the actual version/phase of the prototype is there anything you would change? 6. Are there any benefits you consider worth mentioning, by continuing to use the prototype in the near future? And in the medium-long run? 7. If it was your decision and the prototype was transformed into a commercial product, would you consider paying to have it at the disposal of your hotel? 8. What other functions or data sources do you think a full commercial version of the product should include?
191
Appendix XXXII– Heuristic evaluation questions
1. Internal consistency: a. Are the same terms/phrases used to reference the same “things” on all screens and options (e.g. different description for a Key Performance Indicator acronym)? b. Are there any actions that should produce the same outcome, but produce a different one according to the option/screen where it is executed? c. Is there consistency among visual interface and interaction among the different options/screens? d. Is it easy to identify the sources of data and their date of update? e. Do the same KPIs or metrics use different data sources on different screens/options? 2. Simple dialog: a. Is the terminology used familiar to the expected users? b. Is the terminology used adequate to the business area or is it more information systems oriented? c. Do all dialogs and messages display any irrelevant, unnecessary or rarely necessary information? d. Do all charts present information complying with the principles of good data visualization practices? e. Is the menu simple to navigate and with shallow depth? 3. Shortcuts: a. Does the interface accommodate both novice and expert users? b. Is prior training necessary before starting to use the system? c. Can expert users take advantage of better understanding of the system? 4. Minimizing the user’s memory load: a. Does the user have to memorize any codes to use the different options/screens? b. Is the user required to remember information from one option/screen to other? 192
c. Do not so common terms or KPIs have detailed explanations? 5. Preventing errors: a. Are there any options/functions that generate error messages? b. Are there any non-graceful or technical error messages displayed to users? 6. Feedback: a. Does the system always inform the user of “where” he/she is? b. Does the system always inform the user of what is being done? c. Does the system inform the user of what is being done in long operations? 7. Internal locus of control: a. Can the user cancel any wrong/miscalled operation that was called by him/her? b. Can the user do any operation without the need to go through a big questionnaire or in-depth procedures?
193