Engine Fuel Injection Control using Fuzzy Logic S.H.Lee, R.J.Howlett & S.D.Walters Intelligent Systems & Signal Processing Laboratories, Engineering Research Centre, University of Brighton, Moulsecoomb, Brighton, BN2 4GJ, UK. Email:
[email protected],
[email protected] &
[email protected]
ABSTRACT: This paper describes a cost-effective fuzzy control system applied to a small spark-ignition internal-combustion engine to achieve regulation of the fuel injection system. The system determines the amount of fuel required from a fuzzy algorithm that uses the engine speed and manifold air pressure as input values. The parameters of the fuzzy control paradigm were a collection of rules and fuzzy-set membership functions. These were intuitively comprehensible by the operator. This facilitated the calibration process, leading to quick and convenient tuning. Experimental results show that a considerable improvement in fuel regulation was achieved compared to the original carburettor-based engine configuration. In addition measurements of HC and CO emissions show a corresponding reduction.
1 Introduction Electronic control of the air-fuel ratio (AFR) and ignition timing of a spark ignition (SI) engine is an effective way to achieve improved combustion efficiency and performance, as well as a reduction in exhaust emissions. The AFR essentially sets the operating point of the engine, and in conjunction with the ignition timing angle, determines the output power and the resulting levels of emissions. In an engine with electronic control, the amount of fuel that is supplied to the engine is controlled by an engine control unit (ECU). This is a microprocessor based system that controls the frequency and width of the control pulses supplied to the fuel injector. The AFR is important in the combustion and calibration processes. If there is too much fuel, not all of it will be burnt, causing high fuel consumption and increased emissions of HC and CO. Too little fuel can result in overheating and engine damage such as burnt exhaust valves. Conventional ECUs use three-dimensional mappings (3-D maps), in the form of look-up tables, to represent the non-linear behaviour of the engine in real-time [1]. In addition the engine will be equipped with a wide range of sensors. A major disadvantage of the look-up table representation is the time taken to determine the values it should contain for optimal engine operation; a process known as calibration of the ECU. The calibration process is an iterative one that requires many cycles of engine measurements and is very time consuming. Techniques that reduce the time and effort required for the calibration process are of considerable interest to engine manufacturers. Legislative controls on emission have concentrated on motor vehicles, and hence research on the reduction in emissions has been concentrated on automotive engines. As a result, emission reduction technologies for small engines has not been a major design consideration. Consequently, an unregulated small engine contributes more emissions per hour of use than a much larger car engine which has complex emission control technology [2]. The aim of the work described in this paper was to develop tools, techniques and experience in fuzzy control, applied to engines and ECUs. The motivation was that the use of a fuzzy paradigm could result in relatively fast and convenient calibration. In the short term, the intention was to develop a fuzzy control system to regulate the fuel injection of a small engine. In the longer term it was intended that the techniques could be applicable to the automotive domain.
2
Fuzzy control
Fuzzy logic is a ‘soft computing’ technique, which mimics the ability of the human mind to learn and make rational decisions in an uncertain and imprecise environment [3]. Fuzzy control has the potential to decrease the time and effort required in the calibration of engine control systems by easily and conveniently replacing the 3-D maps used in conventional ECUs. Fuzzy logic provides a practicable way to understand and manually influence the mapping behaviour. In general, a fuzzy system contains three main components, the fuzzification, the rule base and the defuzzification. The fuzzification is used to transform the so-called crisp values of the input variables into fuzzy membership values. Afterwards, these membership values are processed within the rule base using conditional ‘if-then’ statements. The outputs of the rules are summed and defuzzified into a crisp analogue output value. The effects of variations in the parameters of a Fuzzy Control System (FCS) can be readily understood and this facilitates optimisation of the system. The system inputs, which in this case are the engine speed and the throttle angle, are called linguistic variables, whereas ‘large’ and ‘very large’ are linguistic values which are characterised by the membership function. Following the evaluation of the rules, the defuzzification transforms the fuzzy membership values into a crisp output value, for example, the fuel pulse width. The complexity of a fuzzy logic system with a fixed input-output structure is determined by the number of membership functions used for the fuzzification and defuzzification and by the number of inference levels. The advantage of fuzzy methods in the application of engine control over conventional 3-D mappings is the relatively small number of parameters needed to describe the equivalent 3-D map using a fuzzy logic representation. The time needed in tuning a FCS compared to the same equivalent level of 3-D map look-up control can be significantly reduced. 3
The fuzzy control system
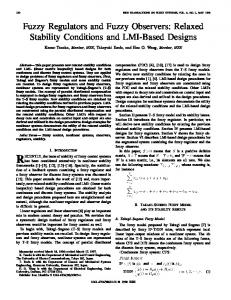
3.1 Feedforward fuzzy control For this work, the aim of the control strategy here was to govern the value of AFR in the engine, keeping it at a desired optimal value, and minimising the influence of changes in speed and load. Figure 1 shows the block diagram of the test system. Engine load was estimated indirectly by measurement of the inlet manifold air pressure (MAP). The parameters of the fuzzy control system and rule-base contents in the fuzzy control system were determined during test-rig trials and implanted as a system reference into the control unit. The details of the creation of such a control algorithm for this experiment are explained in the next section of the paper. The minor drawback of this feedforward control is lack of feedback information; factors such as wear and spark plug deterioration will detract from optimum fuel injection quantity in what is still effectively an open-loop system. Feedback control of AFR is often provided in automotive engines, but this is seldom economic on small engines. A suitable model was created to predict throttle position by using the MAP and the engine rotating speed. The feedforward fuzzy control scheme was used in order to reduce deviations in lambda value or λ, where λ is an alternative method of expressing AFR (λ = 1.0 for an AFR of approximately 14.7:1, the value for complete combustion of gasoline). The scheme also has the benefit of reducing the sensitivity of the system to disturbances which enter the system outside the control loop. This fuzzy model offers the possibility of identifying a single multi-input single-output non-linear model covering a range of operating points [4]. Set point Throttle pos.
Control system Measurement • MAP • Speed
Fuzzy controller & rule base
FPW
Fuel injector driver
Engine system
Disturbance Engine load
Power & Torque Lambda 4-gas analyser
Figure 1: Block diagram for feedforward and fuzzy logic control scheme 3.2 Emissions testing methodology In order to determine the engine's emission levels, the engine was tested on an emissions test bed, which simulated actual working conditions. Operations in the test bed offers the advantage of allowing tests to be conducted at predefined test cycles in different speeds and loading conditions without having to take environmental disturbance into consideration. This is to ensure that individual emissions tests remain mutually comparable. The measurement of exhaust emission levels is typically based on a simulated test cycle, which progresses through defined operating points incorporating various engine speeds and loads. The exhaust gases produced during test cycle are passed through the sample probe, located further downstream of the lambda checker, where a quantity of gas will be sampled by the analyser and vented back to the open air. Emissions data are taken at each sampling point in its steady state. 3.3 Experimental arrangement The experimental fuzzy control algorithm was implemented using a test facility based on a Bosch Suffolk singlecylinder engine having a capacity of 98 cc. The engine parameters are summarised in Table 1. The engine had a single camshaft and sidevalve arrangement, and was capable of generating manufacturer-listed peak power and torque outputs of 1.11kW at 3000 revolutions per minute (RPM) and 3.74Nm at 2100 RPM respectively. Load was applied to the engine via a DC dynamometer with a four-quadrant speed controller. A strain gauge load cell system was incorporated and a frequency-to-voltage converter was used to provide speed information. The dynamometer was capable of either motoring or absorbing power from the engine. A PC-based data acquisition system utilising an Advantech PCL-818HD analogue-to-digital converter (ADC) card was used. Various sensors were provided to measure the engine operating parameters: speed, torque, MAP, temperatures, AFR, etc. An Oliver K9000 emission 4-gas exhaust emissions analyser was used to measure the engine exhaust emissions. This approved piece of MOT equipment is capable of measuring CO, CO2, HC and O2. The principle of this emission test system is that of infrared analysis. The instrument counts the number of molecules of HC, CO that pass through the gas cell, in which individual exhaust gas components absorb infrared light at different specific rates, according to their characteristic wavelengths. The ignition system used was the standard fitment magneto. A modification was made to the air-induction system in order to accommodate a fuel injector as well as the original carburettor. Thus, the engine could be conveniently switched so as to use the carburettor or the fuel injection system. The fuel injection electronic system consisted of a programmable counter/interval timer (Intel 82C54) which generated a pulse of the required length, feeding an automotive specification Darlingtonconfiguration power transistor, thereby driving the fuel injector solenoid. The fuel pulse width (FPW) governed the quantity of fuel injected into the engine. Table 1: Basic Engine specification Bore (mm) Stroke (mm) Compression ratio Capacity Valve arrangement Carburettor Ignition system
57.15 38.1 5.2 : 1 98cc Sidevalve Fixed jet Flywheel magneto
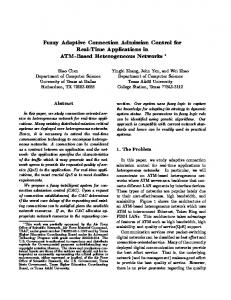
3.4 Engine load estimation In a spark-ignition engine the induction manifold pressure varies with engine speed and throttle opening according to a non-linear mapping. Figure 2 shows the three dimensional relationship between these operating parameters for the Bosch Suffolk engine. By measuring these two variables, the engine load/throttle position can be determined. A conventional look-up table can be used, although in the case of this work fuzzy logic was used to represent the non-linear relationship between functions. An optical sensor was used for speed measurement, and a low-cost gas/air pressure sensor was applied to measure the MAP. These formed the major control inputs to the fuzzy control loop.
3.5 Fuzzy control algorithm The fuzzy control system was devised using a Fuzzy Development Environment (FDE) which was the outcome of a linked piece of work. The FDE is an MS Windows-based application that consists of a Fuzzy Set Editor and Fuzzy Rule Editor. Fuzzy sets, membership functions and rule sets for this project were all created, and modified where required, using the FDE. Parameters derived from the FDE, specific to the particular set-up devised, were transferred to an execution module, known as the Fuzzy Inference Kernel (FIK). The FIK was a module programmed in C++ code. To make it possible to embed the FIK directly into an ECU, the code was compiled to .obj format, and incorporated into the rest of the control code by the linker. 35 30 25 2 0 A ir P re ss u re (k P a )
Fuzzy control loop
Fuel Pulse Width
Fuel injector drive
15 10
Fuel Injection Pulse
5 2700
2600
2400
2200
2000
100 1800
50
75
T h ro ttle P o s itio n (% )
25
0
0
E n g in e s p e ed (R P M )
Figure 2: Variation of MAP with speed and throttle opening
Crisp Engine Speed Crisp Manifold Pressure
Engine
Figure 3: Air-fuel ratio fuzzy control loop
The fuzzy control loop illustrated in Figure 3 was implemented in order to optimise the AFR. To determine the effectiveness of the control loop, the AFR was monitored using a commercial instrument, known as an Horiba Lambda Checker. The engine speed was determined by an optical sensor while the MAP was measured by a pressure sensor located in the intake manifold. These instruments sampled individual parameters and through the medium of signal conditioning circuitry provided analogue output voltage levels proportional to their magnitude. These were converted to digital form and the crisp digital signals were then applied to a fuzzy algorithm implemented in the C programming language on a PC. The crisp output from the algorithm was the width of the pulse applied to the fuel injector (the FPW). The fuzzy sets show in Figures 4 and 5 were used in the fuzzy controller. The engine speed fuzzy set used three trapezoidal membership functions for classes Low, Medium and High. The MAP fuzzy set consisted of four trapezoidal membership functions for classes Very Low, Low, High, and Very High. Experimental adjustment of the limits of the membership classes enabled the response of the control kernel to be tailored to the physical characteristic of the engine.
Figure 4: Fuzzy input set – engine speed
Figure 5: Fuzzy input set – vacuum pressure
The contents of the rule-base underwent experimental refinement as part of the calibration process. The final set of rules contained in the rule-base is shown in Figure 6. The fuzzified values for the outputs of the rules were classified into membership sets similar to the input values. An output membership function of output singletons, illustrated in Figure 7, was used. This was defuzzified to a crisp value of FPW.
Figure 7: Fuzzy output set – FPW (ms)
Figure 6: The fuzzy rule base
3.6 The mapping Engine control typically requires a two-dimensional plane of steady state operating points with engine speed along the horizontal axis and throttle position along the vertical axis. The control surface in Figure 8 shows the crisp value of FPW at different combinations of speed and vacuum pressure using FCS. Each of these intersection points indicates the differing requirement for fuel, which is determined by the design of fuzzy sets and membership functions. The control surface acts as a means of determining the FPW needed for each combination of speed and MAP value.
Figure 8: Three-dimensional FCS map 4 Results and discussion The performance of the engine running with the FCS was experimentally compared with that of the engine running using the conventional mechanical fuel regulation and delivery system. A monitoring sub-routine was created to capture performance data, under conventional operation and using the FCS, under the experimental conditions described in Table 2. The experimental evaluation was carried out using a combination of six speed settings and five values of Throttle Position Setting (TPS). Values of engine torque and power were recorded for each combination of speed and TPS. Table 2: Experimental conditions Engine speed (RPM) Throttle Position (%)
1800, 2000, 2200, 2400, 2600, 2700 0, 25, 50, 75, 100
4.1 Power and Torque Figures 9 and 10 illustrate the power produced by the basic engine set-up and FCS respectively, the latter exhibited an increase of between 2% and 21% with an average of approximately 12% compared to the original mechanical fuel delivery system. A corresponding improvement in output torque also resulted from the use of the fuel injection system with the FCS compared to when the original fuel delivery system was used. Figures 11 and 12 show the mean torque exhibited an increase of between 2% and 20% with an overall average of 12%. These increases in engine performance are partly due to the improvement in charge preparation achieved by the
fuel injection process; the improvement in fuel metering also results in improved combustion efficiency hence increased engine power and reduced exhaust emissions.
1.0
5 .0 4 .5
0.8
4 .0 3 .5
0.6 P ow er (kW )
T o r q u e (N m )
0.4
3 .0 2 .5
Figure 9: Basic engine power output (kW)
2200
50%
T P S (% )
25% 1800
100%
S peed (R P M )
75%
1 .5 1 .0
2600
2200
50%
25% 1800
100%
T P S (% )
75%
0.0
2600
2 .0
0.2
S p e e d (R P M )
Figure 11: Basic engine torque output (Nm)
1.0
5 .0 4 .5
0.8
4 .0 3 .5
0.6 P ow er (kW )
T o rq u e (N m )
3 .0
0.4
2 .5
0.2
2 .0
Figure 10: FCS engine power output (kW)
2600
2200
50%
T P S (% )
25% 1800
100%
1 .0
S p eed (R P M )
75%
2200
50%
25% 1800
100%
75%
T P S (%)
2600
1 .5
0.0
S p e e d (R P M )
Figure 12: FCS engine torque output (Nm)
4.2 Air-fuel ratio The AFR was monitored, over a range of speeds and load conditions, using both the original fuel delivery system and the fuzzy-controlled fuel-injection system to comparatively evaluate the variation in AFR that occurred. The control objective was to stabilise the AFR such that λ=0.9 was achieved under all engine operating conditions. Figures 13 and 14 illustrate how the value of λ varied with different combinations of speed and throttle position using the original fuel regulation system and the fuzzy-controlled fuel-injection system, respectively. Figure 13 shows that wide variations in λ occurring when the original fuel regulation system was used, this being due to non-linearities in the characteristic of the carburettor. This resulted in an excessively rich mixture at small throttle openings and an excessively weak mixture when the throttle opening was large. The large variations in λ suggested poor combustion efficiency and higher, harmful, exhaust emissions. An improved and refined contour was found to occur when the FCS was employed. Reasonable regulation of λ was achieved, the value being maintained between 0.8 and 1.0 in approximately 90% of the experimental operating region. Exceptions occurred in two extreme conditions, which were (1) high engine speed with very small throttle opening; and (2) low engine speed with throttle wide open. Neither of these conditions are likely to occur frequently in normal engine operation. There were a number of limitations in the mechanical and electronic components of the fuel injection system which adversely affected the stabilisation of the AFR. Firstly, the fuel injector was one that was conveniently available for the experiment, but it was too big for the size of the engine, making it difficult to make small changes in the amount of fuel delivered. Secondly, the resolution of the counter that determined the fuel pulse width was too coarse, again causing difficulty in making fine adjustments to the quantity of fuel delivered. Finally, the chamber where the fuel injector was installed and the inlet manifold were not optimised for fuel injection. Even with such a non-optimal system, it was possible to conveniently and quickly adjust the parameters of the fuzzy control system to produce a close to optimal solution.
1.6
1.6
1.4
1.4
0.8
Figure 13: Variation in lambda with original fuel regulation system
50 75 100
25
Speed (RPM)
2700 0
TPS (%)
2400
0.6
50 75 100
25
2700 0
2400
2600
2000
Speed (RPM)
2200
0.6
1.4-1.6 1.2-1.4 1.0-1.2 0.8-1.0 0.6-0.8
1.0
2600
0.8
1800
1.2 Lambda
1800
1.0
2000
Lambda
1.4-1.6 1.2-1.4 1.0-1.2 0.8-1.0 0.6-0.8
2200
1.2
TPS (%)
Figure 14: Variation in lambda with fuzzycontrolled fuel-injection system
4.3 Emissions Comparisons were made between the levels of CO and HC emissions produced by the basic engine spec and the FCS enhanced spec engine. Several working conditions were investigated as shown in Table 3. The FCS demonstrated an average of 51% and 15.4% reduction in CO and HC emissions, respectively, please see Figures 15 and 16. Table 3: Measurement of exhaust emissions Basic engine TPS Speed (%) (RPM) CO (%) HC (ppm) 50 75 100
FCS CO (%)
HC (ppm)
1800
5.75
477
0.12
377
2200
6.12
407
4.8
380
1800
6.33
407
2.57
314
2200
6.86
363
4.3
317
1800
6.62
397
1.72
292
2200
7.22
375
6.06
365
These reductions in HC and CO emissions are due to the improvement in AFR control achieved by the fuzzy system. A stabilised AFR means a closer conformance to stoichiometric operation (λ = 1.0). The fuzzy system was tuned to keep λ to 0.9, where the engine produced its maximum torque. At the same time an ignitable mixture was maintained because misfiring causes a rapid increase in HC emissions. Engines run on a slightly rich mixture benefit from low CO emission and maximum torque, although a lean mixture offers optimum fuel economy and even lower CO emissions. The tuning of the FCS has been tailored to the test engine to give its best performance with minimum exhaust emissions. 100%
CO
100%
CO
80%
80%
60% 40% HC
HC
HC
Reduction
Reduction
CO
60%
CO
20%
20%
0%
0%
50%
75% TPS
100%
Figure 15: Emissions reduction at 1800 RPM
CO
40% HC 50%
HC
CO HC
75% TPS
100%
Figure 16: Emissions reduction at 2200RPM
5 Conclusion This paper has demonstrated that intelligent systems can be used for the computer control of the fuel supply of a small internal combustion engine. The technique represented a convenient and quick method of achieving ECU calibration, and led to improved fuel regulation, and a consequent reduction in exhaust emissions. It was demonstrated that the entire tuning process, including the set-up of membership function and derivation of the rule-base, could be accomplished in as a little as an hour. Faster times could be achieved with experience and practise. Laboratory tests showed that the fuzzy-controlled fuel-injection system achieved increased engine power and torque over that obtained with mechanical fuel delivery. In addition, it was shown that the system was capable of maintaining the variation of λ within a narrow range, leading to reduced emissions of CO and HC. The experience gained with fuzzy engine control will prove useful for application in the automotive field. REFERENCES [1] Holzmann H., Halfmann Ch., Isermann R. (1997). Representation of 3-D Mappings for Automotive Control Applications using Neural Networks and Fuzzy Logic. IEEE Conference on Control Applications Proceedings, pp. 229-234. [2] Riegel J., Neumann H., Wiedenmann H. M. (2002). Exhaust gas sensors for automotive emission control. Solid State Ionics 152-153. pp. 783-800. [3] Chin L., Mital D. P. (1998). Fuzzy Logic And Neural Networks, IEEE Region 10th Annual International Conference, Proceedings/TENCON, pp. 195-199. [4] Copp D. G., Burnham K. J., Locket F. P. (1998). Model Comparison for Feedforward Air/fuel Ratio Control. KACC International Conference on Control 9, pp. 670-675. [5] Docquier Nicolas, Candel Sebastien (2002). Combustion Control and Sensors: A Review. Progress in Energy and Combustion Science 28, pp.107-150. [6] Howlett R.J., de Zoysa M.M., Walters S.D. & Howson P.A. (1999). Neural Network Techniques for Monitoring and Control of Internal Combustion Engines. International Symposium on Intelligent Industrial Automation. [7] Priest M.W., Williams D. J., Bridgman H.A. (2000). Emission from in-use Lawn-mowers in Australia. Atmospheric Environment 34, pp. 657-664. [8] Stroh D. J., Franchek M. A. & Kerns J. M. (2001). Fuelling Control of Spark Ignition Engines. Vehicle System Dynamics 2001. Vol. 36, No. 4-5. pp. 329-358. [9] White Jeff J., Carroll James N., and Hare Charles T. (1991). Emission Control Strategies for Small Utility Engines. SAE Technical Paper Series. 911807 pp. 29-54.