The multi-grid active contour method is used for cell nuclei segmentation, three geometric features are used feature extraction and a fuzzy rule based classifier is ...
International Journal of Computer Applications (0975 – 8887) Volume 25– No.11, July 2011
Fuzzy Rule based Classification of Microscopic Images of Squamous Cell Carcinoma of Esophagus P.S. Hiremath
Humnabad Iranna Y.
Dept. of Computer Science Gulbarga University Gulbarga, Karnataka, India
University Computer Centre Gulbarga University Gulbarga, Karnataka, India
ABSTRACT In this paper, we present a novel method based on active contours for segmentation and fuzzy rule based classification of microscopic images of esophagus tissues obtained from the abnormal regions of human esophagus detected through endoscopy. This method is used for classification of Squamous Cell Carcinoma (SCC) of esophagus, namely, well differentiated (WD), moderately differentiated (MD), and poorly differentiated (PD) SCC. The multi-grid active contour method is used for cell nuclei segmentation, three geometric features are used feature extraction and a fuzzy rule based classifier is built for classification of SCC. The experimental results demonstrate the efficacy of the proposed method.
Keywords Esophagus, microscopic image, squamous cell carcinoma, geometric features, active contour segmentation
1. INTRODUCTION Due to the advances in optics and imaging systems, the biologists are able to visualize a living specimen’s dynamic processes by time-lapse microscopy images. However, the image data recorded during even a single experiment may consist of hundreds of objects over thousands of images, which makes manual inspection a laborious and error prone effort [1]. The electronic videoendoscopy is employed in minimally invasive surgical procedures, because the digital endoscopic image processing offers a powerful tool for enhancing images and rendering them easier for the physician to point out abnormality with enhanced precision. The digitally segmented images are expected to assist the medical expert in drawing the biopsy samples precisely from the detected pathological legions. These biopsy samples are sent to pathologists for microscopic analysis. In quantitative pathology, the most important and, in fact, the most difficult task in image morphometry is the recognition or segmentation/ classification of cells. Although the interactive manual tracing method is still the most reliable approach for the segmentation/ classification of cells, it involves considerable user participation and is very time-consuming. To simplify the tracing process, more efficient approaches make use of a priori knowledge of medical cells, require less work from the user in tracing and are effective in practice. Squamous cell carcinoma is by far the most common malignant tumor of the esophagus. It is usually graded as well, moderately, or poorly differentiated. Well-differentiated tumours are those with abundant amounts of keratin, easily demonstrated intercellular bridges, and minimal nuclear and cellular pleomorphism. Poorly differentiated tumours are those with no or
virtually no keratin and intercellular bridges or with marked celluar and nuclear plemorphism. Moderately differentiated tumours are those intermediate between well and poorly differentiated [2]. Many techniques of image processing were proposed to handle with problems such as nucleus segmentation and classification of skin tumor [3]. Chen et al. [4] used spatial adaptive filter and watershed. Anoraganingrum [5] used a combination of median filter and mathematical morphology operation. Hazem Refai et al. [6] used similar approach as of Anoraganingrum [5] for cell segmentation. In this paper, we present a novel method based on active contours for segmentation and fuzzy rule based classification of microscopic images of esophagus tissues obtained from the abnormal regions of human esophagus detected through endoscopy. This method is used for classification of Squamous Cell Carcinoma (SCC) of esophagus, namely, well differentiated (WD) SCC, moderately differentiated (MD) SCC, and poorly differentiated (PD) SCC. In the section 2, we describe the material and proposed method used for segmentation and classification. In the section 3, we give implementation details and present experimental results. Finally, in the section 4, we summarize our work.
2. MATERIAL AND METHOD 2.1 Image Data The histological material used in this study has been collected from Gulbarga Diagnostic and Research Laboratory, Gulbarga. The image data set comprised 120 image samples from H and E (Haematoxylin and Eosin) stained tissue sections of esophagus. The digital images of stained tissue slides are captured by using a light microscopy imaging system (Olympus BX51 with DP12 camera) at a magnification of x40. For experimentation 120 color microscopic images of size 256x256 pixels are used.
2.2 Proposed Method The objective of the proposed system is segmentation and classification of Squamous Cell Carcinoma (SCC) of esophagus, namely, poorly differentiated SCC, moderately differentiated SCC, and well differentiated SCC using geometric features. Among many geometric features commonly used by many authors for shape description of regions of interest (ROI), it is observed that the three geometric features, namely, area, tortuosity and compactness, have given better classification results in the present study. Segmentation of nuclei The input RGB image is converted into grayscale image and preprocessed using the circular averaging filter. The segmentation is carried out by active contour method which has been described below.
30
International Journal of Computer Applications (0975 – 8887) Volume 25– No.11, July 2011 Active contour Snakes or active contours are curves defined within an image domain that can move under the influence of internal forces coming from within the curve itself and external forces computed from the image data. The internal and the external forces are defined so that the snake will confirm to an object boundary or other desired features within an image. Snakes or active contour models they lock onto nearby, edges, localizing them accurately. Scale-space continuation can be used to enlarge the capture region surrounding a feature. The basic idea in active contour models or snakes is to evolve a curve, subject to constraints from a given image, in order to detect objects in that image. For instance, starting with a curve around the object to be detected, the curve moves toward its interior normal and has to stop on the boundary of the object. Snakes provide a unified account of a number of visual problems, including detection of edges, lines, and subjecting contours; motion tracking; and stereo matching. Let C be a planar curve with length L(C) and r C(s ) ≡ (x (s), y(s) ) : [0, L(C)] → R 2 its arc-length parameterization; also let I be an intensity image. In geodesic active contour, curve’s geodesic length will be minimized [7] r EC = ∫ g ∇I C(S) ds (1) c
( ( ))
where the edge indication function g : [0,+∞ ) → R 2
is a
decreasing function of ∇I (other measures of edge strength ca also be used), such that g (0) = 1, g(r ) → 0 as r → +∞ . Minimization of the functional in eq. (1) by means of variational techniques leads to an Euler-Lagrange partial differential equation (PDE); to reach local minima, we start with an initial contour and evolve it in the direction of steepest decent, introducing a pseudotime variable ‘t’. Numerical implementation of the geodesic active contour model using level sets [8] naturally allows for changes in the contour’s topology, permitting splits and merges. In the level set framework, the moving contour C(t) is defined implicitly as the zero level set of an embedding scalar function u with domain the whole image plane, i.e. C(t ) = {(x , y ) : u (x , y, t ) = 0} , where u (x , y, t ) : R 2 x [0,+∞ ) → R . By convention, assign negative values to the interior and positive values to the exterior of the courve. The signed distance function from the contour is often chosen for extending away from the curve due to its good numerical properties. The corresponding geometric active contour level set evaluation law is
∇u + α 2 (f R − I )2 − (f R ′ − I )2 + div ∂u = ∇u ∇u ∂t 2 2 β 2 ∇f R − ∇f R ′
(
)
)
(
(2)
where α and β are positive weights. Since f is also unknown, it needs to be re-estimated as the front moves. In the Chan-Vese model, where the image intensity is assumed piecewise constant, the curve evolves by ∇u ∂u + α 2 (CR − I )2 − (C R ′ − I )2 = ∇u div ∂t ∇ u
(
)
(3)
Multigrid numerical methods employ a hierarchy of grids of different mesh sizes to efficiency solve a wide range of problems, most notably those arising from PDE models [9]. Multi-grid techniques overcome the typically slow convergence properties of conventional uni-grid iterative methods. In this work, we have employed multi-grid technique for segmentation of microscopic images of SCC.
Training and Classification For experimentation, the data set consists of 40 microscopic images of esophagus tissue obtained from the abnormal regions of human esophagus detected through endoscopy of each category namely, well differentiated (WD), moderately differentiated (MD), and poorly differentiated (PD) squamous cell carcinoma of size 256x256. Thus, the dataset contains 120 images. The 50% of the images are used as training set and remaining images are used as testing set. The algorithm for feature extraction for segmented cell nuclei (ROI) in the training images is given in the Algorithm 1 below: Algorithm 1: Feature extraction of cell nuclei Step 1: Input RGB color microscopic image of SCC and convert it into greyscale image. Step 2: The greyscale image is preprocessed using circular averaging filter with radius 2 (empirical value) Step 3: Apply active contour segmentation method and obtain the segmented binary image and label the regions. The labeled regions are the nuclei regions of SCC tissues. Step 4: Compute the shape features area (f1k ) , tortuosity (f 2k ) and compactness (f3k ) for each labeled region belonging to SCC class k, where k=1,2,3, corresponding to WD, MD and PD squamous cell carcinoma classes, respectively. Step 5: Repeat Step 1 to Step 4 for all the training images. Step 6: Compute the mean (f1k ) , (f 2k ) , (f3k ) and standard deviation (σ1k ) , (σ k2 ) , (σ3k ) of the shape features (f1k ) , (f 2k ) , and (f3k ) , respectively, of all the labelled regions belonging to each SCC class k, computed in the Step 4. These values are stored in the feature library as knowledge base, which is used in the testing phase. The mean and standard deviation of feature values computed in the Algorithm 1 are used to build the Gaussian membership functions of fuzzy quantities, namely, area, tortuosity and compactness of nuclei regions of well differentiated, moderately differentiated and poorly differentiated classes of SCC.
Classification We propose fuzzy rule based classification of microscopic images of SCC tissues. Fuzzy systems can be categorized in to two families: Mamdani model and Sugeno model. Mamdani model expects the output membership functions to be fuzzy sets. After aggregation process, there is a fuzzy set for each output variable that needs defuzzification. Sugeno model can be used to model any inference system in which the output membership functions are either linear or constant. In the present work, the Sugeno model is employed, because the expected output is the constant membership function of the class number to which the
31
International Journal of Computer Applications (0975 – 8887) Volume 25– No.11, July 2011 SCC belongs. The Gaussian membership function is used and set with the linguistic variables for the features, namely, area, tortuosity and compactness of nuclei regions of each of the well differentiated (WD), moderately differentiated (MD) and poorly differentiated (PD) classes of SCC. Following are the if-then rules used in the fuzzy inference system: Rule 1: If (Area is WD) and (Tortuosity is WD) and (Compactness is WD) then (SCC class is WD) Rule 2: If (Area is MD) and (Tortuosity is MD) and (Compactness MD) then (SCC class is MD) Rule 3: If (Area is PD) and (Tortuosity is PD) and (Compactness is PD) then (SCC class is PD)
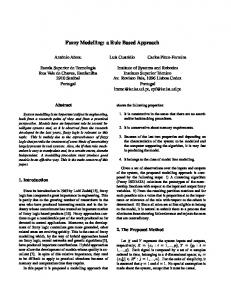
a b c Fig. 1: The sample images of squamous cell carcinoma: (a) WD, (b) MD, and (c) PD.
The algorithm for classification of SCC in the microscopic images of SCC tissues is given in the Algorithm 2 below:
Algorithm 2: Classification of SCC Step 1: Input RGB color microscopic image of SCC and convert it into greyscale image. Step 2: The greyscale image is preprocessed using circular averaging filter with radius 2 (empirical value) Step 3: Apply active contour segmentation method and obtain the segmented binary image and label the regions. The labeled regions are the nuclei regions of SCC. Step 4: Compute the shape features area (f1k ) , tortuosity (f 2k ) and compactness (f3k ) for each labeled region. Step 5: Compute the mean f1 , f 2 and f 3 of shape feature values of all the labeled regions in the test image. Step 6: (Classification) Input the shape feature values f1 , f 2 and f 3 , which are computed in Step 5 for input test image, to the fuzzy inference system (Sugeno model). Step 7: The output of fuzzy inference system is the constant membership function value 1 or 2 or 3, which indicates the SCC class to which the input image belongs. The values 1, 2 and 3 correspond to the WD, MD and PD classes, respectively. Step 8: Repeat the Steps 1 to 7 for all the test images to classify them into the SCC classes, namely, WD, MD and PD.
3. EXPERIMENTAL RESULTS In order to evaluate the performance of the proposed algorithm, a series of experiments are performed on Pentium (R) D CPU @ 2.8 GHz using Matlab 7.9. The 120 sample images of size 256x256 of squamous cell carcinoma of esophagus are used, which contains 40 images of each category: WD, MD and PD SCC. In the training phase, 50% of the microscopic images of SCC of each category are used and the sample image of each is shown in the Fig.1. The segmentation is carried out using multigrid active contour method. The segmentation results obtained for each category is shown in the Fig.2(a), 2(b), 2(c) and 2(d), which are in good agreement with the manual segmentation (Fig.2(e)) done by the medical expert. Three geometric features, namely, area, tortuosity and compactness of nuclei regions are used to build the feature library. The mean and standard deviation of feature values obtained from the training set of images are presented in the Table 1.
Fig. 2: Sample segmentation results of WD, MD and PD SCC classes: (a) Original color image, (b) Pre-processed image, (c) Grayscale image of (b), (d) Segmented binary image using active contour method and (e) Manual segmentation done by medical expert. Input greyscale microscopic image of SCC
Feature extraction (Geometric feature: Area, tortuosity and compactness
Segmentation using active contour
Fuzzy rule based classification
Fig. 3: General Structure of the proposed system
32
International Journal of Computer Applications (0975 – 8887) Volume 25– No.11, July 2011 These values are used to build the Gaussian membership functions of the linguistic variables, namely, area, tortuosity and compactness of WD, MD and PD SCC classes, for the proposed fuzzy inference system (Sugeno model). The parameter values for output variables are 1, 2 and 3 corresponding to WD, MD and PD SCC classes. The stage wise development of fuzzy inference system is shown in the Fig.3. The classification algorithm is tested for microscopic images of SCC using the fuzzy inference system designed for the proposed system. The fivefold
experiments are performed and the average classification results are given in the confusion matrix shown in the Table 2. The proposed method yields the classification rates of 83%, 89% and 92% for WD, MD and PD SCC, respectively. The proposed algorithm is computationally less expensive, since it uses only three geometric features of nuclei region and yet yields good classification results. It is also robust due to the fuzzy inference system built in the classification algorithm.
Table 1. Mean and Standard Deviation (SD) values of feature values of WD, MD and PD SCC. Class k
SCC Class
1 2 3
WD MD PD
Tortuosity (f 2 )
Area (f1 ) Mean
(f1k )
99.1465 92.0586 70.9766
SD
(σ1k )
11.6265 9.9889 5.0976
Mean
(f 2k )
0.4041 0.4070 0.3958
SD
(σ k2 )
Compactness (f 3 ) Mean (f 3k )
0.0079 0.0104 0.0102
99.1465 92.0586 70.9766
SD (σ3k ) 11.6265 9.9889 5.0976
Table 2. Confusion matrix of classification results(%) SCC Class WD MD PD WD 83 17 00 MD 10 89 01 PD 00 08 92
4. CONCLUSION In this paper, a novel method for segmentation and classification of microscopic images of esophagus tissue obtained from the abnormal regions of human eshophagus is presented. The method is robust and computationally less expensive. Any changes to the fuzzy inference system can be made very easily and the learning process of fuzzy system is fast. The fuzzy logic addresses such applications perfectly as it resembles human decision making with an ability to generate precise solutions from certain or approximate information. The experimental results show that the proposed method yields better classification results inspite of using only three geometric features of cell nuclei, due to fuzzy rule based classifier. However, the classification results can be further improved by combination of geometric features and textural features, which will be done in our future work.
5. ACKNOWLEDGMENTS The authors are indebted to the referees for their valuable comments. Also, the authors are grateful to Dr. S. K. Andola, Pathologist, Gulbarga Diagnostic and Research Laboratory, Gulbarga, Karnataka State, India for providing H and E Stained slides of squamous cell carcinoma of esophagus tissue and rendering manual segmentation and classification of microscopic digital images of the above tissue sample for the present study.
6. REFERENCES [1] Takeo Kanade, Zhaozheng Yin, Ryoma Bise, Seungil Huh, Sugngeun Eom, Michael F. Sandbothe and Mei Chen, January 2011, Cell Image Analysis: Algorithms, System and Applications, IEEE workshop on Applications of Computer Vision (WACV), 374-381.
[2] K.Oota, L.H. Sobin, 1977. Histological typing of gastric and oeophageal tumours, World Health Organization, Geneva, Printed in Switzerland, 33-35. [3] Toshiyuki Tanaka, Tomoo Jike, Teruaki Oka, October 2001. Cell nucleus segmentation of skin tumor using image processing, Proceedings of the 23rd Annual EMBS International Conference, Istanbul, Turkey, 2716-2719. [4] Yongming Chen, Kevin Biddeli, Aiying Sun, Patricia A. Relue, Jeffrey D. Johonson, 1999. An Automatic Cell Counting Method for Optical Images, Proceedings of the First Joint BMES/EMBS Conference, Atlantic, 819. [5] Dwi Anoraganingrum, 1999. Cell Segmentation With Median Filter and Mathematical Morphology Operations, Proceedings of International Conference on Image Analysis and Processing, 1043-1046. [6] Hazem Refai, Lun Li, T. Kent Teague, R. Naukam, September 2003. Automatic count of hepatocytes in microscopic images, Proceedings of International Conference on Image Processing, ICIP-2003, II-1101-1104. [7] V. Caselles, R.Kimmel and G. Sapiro, Geodesic Active Contours, Int’l J. Comp. Vision, Vol 22 No.1, 1977, 61-69. [8] S.Oshar and J.A.Sethian, Fronts Propagating with Curvature Dependent Speed: Algorithm Based on Hamilton Jacobi Formulation, J.Compact Phy. Vol.79, 1988, pp. 12-49. [9] A. Brandt, Multi-level Adaptive Solutions to Boundaryvalue Problems, Math. Comp. Vol. 31 No. 138, 1977, .333390.
33