GABA Concentration in Posterior Cingulate Cortex Predicts Putamen Response during Resting State fMRI Jorge Arrubla1, Desmond H. Y. Tse1, Christin Amkreutz1,2, Irene Neuner1,2,3, N. Jon Shah1,3,4* 1 Institute of Neuroscience and Medicine 4, INM 4, Forschungszentrum Ju¨lich, Ju¨lich, Germany, 2 Department of Psychiatry, Psychotherapy and Psychosomatics, RWTH Aachen University, Aachen, Germany, 3 JARA – BRAIN – Translational Medicine, RWTH Aachen University, Aachen, Germany, 4 Department of Neurology, RWTH Aachen University, Aachen, Germany
Abstract The role of neurotransmitters in the activity of resting state networks has been gaining attention and has become a field of research with magnetic resonance spectroscopy (MRS) being one of the key techniques. MRS permits the measurement of c-aminobutyric acid (GABA) and glutamate levels, the central biochemical constituents of the excitation-inhibition balance in vivo. The inhibitory effects of GABA in the brain have been largely investigated in relation to the activity of resting state networks in functional magnetic resonance imaging (fMRI). In this study GABA concentration in the posterior cingulate cortex (PCC) was measured using single voxel spectra acquired with standard point resolved spectroscopy (PRESS) from 20 healthy male volunteers at 3 T. Resting state fMRI was consecutively measured and the values of GABA/Creatine+ Phosphocreatine ratio (GABA ratio) were included in a general linear model matrix as a step of dual regression analysis in order to identify voxels whose neuroimaging metrics during rest were related to individual levels of the GABA ratio. Our data show that the connection strength of putamen to the default-mode network during resting state has a negative linear relationship with the GABA ratio measured in the PCC. These findings highlight the role of PCC and GABA in segregation of the motor input, which is an inherent condition that characterises resting state. Citation: Arrubla J, Tse DHY, Amkreutz C, Neuner I, Shah NJ (2014) GABA Concentration in Posterior Cingulate Cortex Predicts Putamen Response during Resting State fMRI. PLoS ONE 9(9): e106609. doi:10.1371/journal.pone.0106609 Editor: Yu-Feng Zang, Hangzhou Normal University, China Received April 11, 2014; Accepted July 30, 2014; Published September 3, 2014 Copyright: ß 2014 Arrubla et al. This is an open-access article distributed under the terms of the Creative Commons Attribution License, which permits unrestricted use, distribution, and reproduction in any medium, provided the original author and source are credited. Data Availability: The authors confirm that, for approved reasons, some access restrictions apply to the data underlying the findings. According to the authors’ ethical approval, granted by the Ethics Committee of the RWHT Aachen University to the Forschungszentrum Ju¨lich, data and results presented in this manuscript will be available upon request via the corresponding author: Prof. N. Jon Shah. Funding: Jorge Arrubla and Desmond Tse are supported by the Marie Curie Initial Training Network Methods in Neuroimaging (MC-ITN-238593). N. Jon Shah is funded in part by the Helmholtz Alliance ICEMED - Imaging and Curing Environmental Metabolic Diseases, through the Initiative and Network Fund of the Helmholtz Association. Jorge Arrubla, Irene Neuner, and N. Jon Shah are also funded in part through the EU FP7 project TRIMAGE (Grant no. 602621). The funders had no role in study design, data collection and analysis, decision to publish, or preparation of the manuscript. Competing Interests: The authors have declared that no competing interests exist. * Email:
[email protected]
and has been linked to self-referential thought, introspection and integration of cognitive and emotional processing [18]. The DMN shows strong activity during rest, as well as rapid deactivation during externally directed tasks [19]. The DMN is also believed to represent an introspectively oriented mode of the mind which provides readiness and alertness to changes in the external and internal environment [15]. The posterior components of the DMN, precuneus and PCC, seem to act as an intrinsic mediatory node of this network [20,21]. Hagmann et al. [21] used diffusion imaging techniques to demonstrate the existence of a highly connected, complex brain network consisting of the posterior components of the DMN, and showed it to be highly activated at rest. Those regions showed a substantial correspondence between structural connectivity and resting-state functional connectivity. The PCC has been extensively described as an ‘evaluative region’ [22], and includes Brodmann areas 29, 30, 23, and 31. This region is involved in spatial orientation and memory and it is likely that connections between posterior cingulate and parahippocampal cortices contribute to these processes [22]. Although PCC has been widely investigated, there is no consensus regarding its function [8]. The main functional characterisation of the PCC
Introduction Resting state has become an emerging field of research the understanding of which has brought new insights into brain function. The concept of resting state arose from positron emission tomography (PET) and functional magnetic resonance imaging (fMRI) studies in which the focus moved from stimuli-related brain responses to the spontaneous fluctuations of activity when the brain is not engaged in any particular task [1–3]. It was thereby discovered that there exists a high correlation and temporal synchrony of the fMRI blood oxygen level-dependence (BOLD) series among relatively distant brain regions [3]. The analysis of resting state data is possible through independent component analysis (ICA) [4], where the low-frequency patterns of the resting state networks (RSN) are characterised and identified. The defaultmode network (DMN) has gained particular interest due to its relationship with neurological and psychiatric conditions [5–13] as well as with normal aging [14]. The canonical DMN comprises precuneus, anterior cingulate cortex (ACC), posterior cingulate cortex (PCC), medial prefrontal cortex (MPfC) and lateral parietal inferior gyri (LPIG) [2,5,15]. The DMN is thought to characterise basal neural activity [16,17]
PLOS ONE | www.plosone.org
1
September 2014 | Volume 9 | Issue 9 | e106609
GABA in PCC Predicts Putamen Response during Resting State
results from studies which investigate its role within the DMN [23]. PCC is implicated in awareness [24] and internally directed thoughts [13], which is supported by increased PCC activity during internally directed thoughts or during retrieval of autobiographical memories. Importantly, the PCC is one of the areas exhibiting significantly higher activity at rest, as it has been demonstrated by PET and arterial spin labelling [25]. Connectivity studies also demonstrate that the PCC is one of the regions with the highest local functional connectivity in resting conditions [26]. The role of neurotransmitter concentration in the activity of RSN is still not well understood and is an active field of research in magnetic resonance spectroscopy (MRS) [27]. MRS permits the measurement of c-aminobutyric acid (GABA) and glutamate levels, the central biochemical constituents of the excitationinhibition balance in vivo. In this sense, the presence of intraregional and trans-regional neuro-biochemical modulation has been proposed [27]. The latter means that the concentration of a biochemical constituent, as measured by MRS, may predict activity in either the same region, i.e., intra-regionally, and/or another region, i.e., trans-regionally [27]. There is, for example, evidence which suggests the existence of complex interactions between neurotransmitters and the activity of the DMN [28]. Similarly, glutamate measured in the ACC was found to be related with the resting state activity in the same region [29]. The concentration of neurotransmitters has also been related to disease, such as depressive disorder, where abnormal levels of glutamate and GABA have been reported [30]. GABA is the most important inhibitory neurotransmitter in the brain; therefore, it has been linked to several neurological and psychiatric disorders such as epilepsy, panic disorder and depression [31]. Northoff et al. [32] found that the concentration of GABA in the ACC predicts negative BOLD responses of the same area during resting state. In a similar manner, Donahue et al. [33] reported that GABA concentration in the visual cortex is inversely correlated with BOLD signal variations and with cerebral blood flow, suggesting a link between neurochemical and MR-measured hemodynamic responses. In another study, BOLD magnitude was inversely correlated with GABA concentration in the visual cortex, suggesting that the excitation/ inhibition cortical balance controls the functional neuroimaging measures [34]. Kapogiannis et al. [35] concluded that regional GABA and glutamate in the posteromedial cortex predict intrinsic functional connectivity of the DMN. Based on evidence showing the importance of the PCC in the DMN and its importance during resting state [25], as well as the modulatory functions of GABA, we hypothesise that GABA concentration, explicitly the GABA/Cr+PCr ratio – hereafter referred to as the ‘GABA ratio’ – in the PCC measured by MRS has a direct relationship with the response of some areas in the DMN. Previous evidence shows the existence of linear correlations between neurochemicals and the BOLD contrast. Thus, we hypothesise that using a general linear model will reveal clusters exhibiting a linear relationship between the GABA ratio and the neuroimaging metrics measured during resting state, and therefore an assumption of ‘predictability’ could be made. ‘Dual regression’, an analysis tool proposed by Beckmann and co-workers [36], will be used in order to answer these questions. ‘Dual regression’ is a method which permits the identification of between-subject differences in resting functional connectivity [37] based on between-subject similarities using a dual regression approach within the framework of multi-subject-ICA analysis [38].
PLOS ONE | www.plosone.org
Materials and Methods Subjects and data acquisition Data were recorded from 20 healthy male volunteers (mean age = 25.4, SD = 3.7) in a 3 T Siemens Magnetom Trio scanner. Written, informed consent was obtained from all subjects and the study was approved by the Ethics Committee of the Medicine Faculty of the Rheinisch-Westfa¨lischen Technischen Hochschule Aachen (RWTH Aachen University). The study was conducted in accordance with the Declaration of Helsinki. Subjects underwent medical interview and examination in order to exclude psychiatric and neurological conditions. Drug abuse, smoking status and medication intake were assessed using the DIA-X questionnaire (Diagnostisches Expertensystem fu¨r Psychische Sto¨rungen) [39]. All subjects were right-handed according to the Edinburgh handedness scale [40]. During the scanner procedure the subjects were requested to close their eyes and relax. Functional images were acquired using a T2*-weighted EPI sequence (TR = 2.2 s, TE = 30 ms, field-of-view = 200 mm, slice thickness = 3 mm and number of slices = 36). The functional time series consisted of 165 volumes. Anatomical images were acquired for every subject by means of a Magnetization-Prepared, Rapid Acquisition Gradient-Echo (MP-RAGE) sequence (TR = 2250 ms, TE = 3.03 ms, field-of-view = 256 6 256 6 176 mm3, matrix size = 256 6256, flip angle = 9u, 176 sagittal slices with 1 mm slice thickness and GRAPPA factor of 2 with 70 autocalibration signal lines). To reliably resolve GABA resonance peaks at 1.9 ppm and 2.3 ppm, single voxel spectra were consecutively measured by standard point resolved spectroscopy (PRESS) with a set of optimised echo times reported by Napolitano et al. [41] (TE1 = 14 ms, TE = 105 ms, TR = 2.5 s, NA = 128, 25 mm 6 25 mm 625 mm voxel size, RF pulse centred at 2.4 ppm, 16 step phase cycling). The duration of the measurement was 5 minutes and 30 seconds. One extra complete phase cycle was measured without the water suppression RF pulse to record a water peak reference for eddy current correction and absolute metabolite concentration calibration. Before the spectroscopy measurements, the static magnetic field was homogenised by running FASTESTMAP [42] iteratively to ensure that the full–width at half maximum (FWHM) of the reference water peak was below 0.05 ppm. The spectroscopy voxel was placed at the PCC by a trained operator (JA). See Figure 1.
MRS data analysis The spectra were analysed with LCModel version 6.3-0I [43] using a GAMMA simulated basis set [44]. The simulation was 2D in the two directions where the slice selections were accomplished
Figure 1. Depiction of voxel positioning for MRS on a background of a T1 individual structural image. doi:10.1371/journal.pone.0106609.g001
2
September 2014 | Volume 9 | Issue 9 | e106609
GABA in PCC Predicts Putamen Response during Resting State
by 180-degree pulses [45]. The numerical waveforms of the 180degree pulses were obtained directly from the scanner. The GABA ratio (GABA/Cr+PCr) was extracted and used as covariant in the fMRI resting state data analysis.
fMRI resting state data analysis Analysis of functional data was carried out using Probabilistic Independent Component Analysis [38] as implemented in MELODIC (Multivariate Exploratory Linear Decomposition into Independent Components) Version 3.10, part of FSL (FMRIB’s Software Library, www.fmrib.ox.ac.uk/fsl). Individual pre-processing consisted of motion correction using MCFLIRT [46], brain extraction using BET [47], spatial smoothing using a Gaussian kernel of FWHM of 5 mm, and high-pass temporal filtering of 100 s. Functional MRI volumes were registered to the structural scan of each individual and standard space (MNI152) images using FLIRT [46,48]. Temporal concatenation ICA was performed across all functional datasets from each subject using automatic dimensionality estimation [38]. The DMN was identified by visual inspection and comparison to previously published data [2,49] Finally, the dual regression algorithm [36] was applied to the ICs in order to identify the individual contribution of every subject to the RSNs using the GABA ratio in the PCC as a covariant in the second stage of dual regression analysis within the framework of the general linear model. Here, the subject-specific GABA ratio was tested for linear relationship with the subject-specific z–values of the IC representing the DMN. The different component maps were collected across subjects into single 4D files and tested voxel-wise for statistically significant correlation using nonparametric permutation testing (10000 permutations) [50] and ‘threshold-free cluster enhancement’ for improved sensitivity [51]. This resulted in spatial maps characterising the voxels with signal intensities that had a linear relationship (slope) with GABA ratio. The maps were thresholded and controlled for family-wise error rate at p,0.05 [52]. Additionally, a Pearson product-moment correlation was used to test whether the GABA ratio measured in the PCC had any relationship with the absolute and relative motion observed during the acquisition of the fMRI data.
Figure 2. DMN identified in the group analysis of the 20 subjects; the DMN was picked by visual inspection, comprising medial prefrontal cortex (MPfC), anterior and posterior cingulate cortices (ACC and PCC), precuneus and lateral parietal inferior gyri (LPIG). doi:10.1371/journal.pone.0106609.g002
with GABA ratio measured in the PCC. See Table 1. The point of lowest p value (p = 0.0002) was located in the right putamen (MNI coordinates x = 26, y = 10, z = 4) according to the Harvard-Oxford Subcortical Structural Atlas (Figure 3). The Pearson product-moment correlation between the GABA ratio and the absolute motion during the acquisition of the fMRI data was r(18) = 20.321, p = 0.168. In the case of the GABA ratio and the relative motion the correlation coefficient was r(18) = 2 0.411, p = 0.072. Additionally, a region-of-interest analysis was performed in order to test whether a similar relationship between GABA ratio and signal intensity in the left putamen could be found. The mean z–values of the individual DMN maps were extracted from the left putamen according to the Harvard-Oxford Subcortical Structural Atlas and tested for correlation with the GABA ratio using the Pearson product-moment correlation. The correlation coefficient was r(18) = 20.383, p = 0.095 (Figure 4).
Results All the subjects reported full compliance with the instructions; no self-reports of having fallen asleep were given. Twenty-three components were found after decomposition of the data by means of ICA. ‘Meaningful’ RSNs (i.e. representing neuronal signal as opposed to physiological and non-physiological noise such as vascular, respiratory and motion artefacts) were identified by matching them visually against a previously published set of data encompassing 20 ‘canonical’ RSNs (http://fsl.fmrib.ox. ac.uk/analysis/brainmap+rsns) [49]. In accordance with the study by Smith et al. [49] the following 9 RSNs were identified in our data: right and left frontoparietal networks, medial visual network, occipital pole visual network, lateral visual network, DMN, auditory network, executive control network and sensorimotor network. The DMN was picked by visual inspection, comprising medial prefrontal cortex, anterior and posterior cingulate cortices, precuneus and lateral parietal inferior gyri [2,49]. See Figure 2. The GABA ratio was successfully measured in the PCC using single voxel spectra (mean = 0.177, SD = 0.024). The voxel-wise statistical maps, generated by the permutation test of dual regression, exhibited a cluster in the right putamen with significant values (p,0.05, corrected) where the connection strength within or to the DMN had a negative linear relationship PLOS ONE | www.plosone.org
Discussion Given the prior evidence of the modulatory role of GABA in the excitation/inhibition balance we investigated its role in the PCC, an important hub of the DMN. We conducted a study in healthy male volunteers in which the GABA ratio was measured in the PCC using MRS at 3 T. The measured values were included in the analysis of fMRI resting state data in order to identify the relationship between the GABA ratio values and the response of the DMN. Our results show that the activity of the right putamen in the DMN has a negative linear relationship with the GABA ratio measured in the PCC. The results presented here confirm previous observations in which GABA concentration had an inverse relationship with the magnitude of BOLD signal [32,33], and suggest that the putamen is a structure whose activity during resting state is intrinsically modulated by the concentration of GABA. Previous investigations already showed how regional BOLD signal appears to be governed by local GABA concentration either in the same or other regions [27,32–34].
3
September 2014 | Volume 9 | Issue 9 | e106609
GABA in PCC Predicts Putamen Response during Resting State
Table 1. MNI coordinates (2 mm template) of clusters with minimal P values of linear relationship between GABA ratio and z– values in the DMN.
Number of significant voxels in the cluster
Regions of minimum p value according to the Harvard-Oxford Cortical Structural Atlas
Min. corrected P value
MNI coordinates
x
y
z
65
96% Right Putamen, 4% Right Cerebral White Matter
0.0002
26
10
4
doi:10.1371/journal.pone.0106609.t001
The negative relationship found between GABA ratio and the right putamen response seems to be also extended to the left putamen; although in our data it did not achieve statistical significance probably due to the number of participants and the strictness of the statistical model used for the voxel-wise analysis. Noteworthy is the fact that the putamen is not part of the DMN, although it has been described as being part of a basal ganglia RSN, which corresponds to the motor control circuit [53,54]. The interactions among RSNs have been extensively described, particularly for the case of the DMN, which is the network holding hubs with the highest global functional connectivity [55]. A recent fMRI study suggests the presence of complex modulatory interactions among the DMN and the other networks in resting state. Such communications among networks seem to be modulated by critical brain structures such as the basal ganglia and the thalamus [56]. Moreover, there is evidence of negative interactions between the basal ganglia and the activity of the DMN [56]. In this regard, Tomasi et al. [53] described the existing segregation of the DMN from the other networks, which appears to be necessary for its deactivation during task performance. The results presented here suggest that GABA is a critical neurotransmitter for the interactions among RSNs, particularly for the case of the DMN and the basal ganglia RSN, where putamen is a relevant structure. The importance of the putamen in the activity of the DMN has also been previously described. In a PET study Tomasi et al. [57] demonstrated that the availability of dopamine and dopamine transporters in the putamen had a negative linear correlation with deactivation in areas belonging to the DMN. Moreover, the putamen has been included as one of the regions with higher local functional connectivity density at rest [26], and there is evidence of segregation towards this structure to slow the access to cortical sources [55]. Functions of the putamen are majorly categorised as ‘motor functions’. It has a well-known role in motor preparation, execution and control [58]. In an fMRI study it was established that putamen is a target area for proactive motor inhibition driven by the MPfC and the inferior parietal cortex [59]. Among the functions of putamen, learning and memory processes have also been described [60], particularly in studies where lesions of the putamen impair visual discrimination and learning in non-human primates [61]. Further evidence on the functions of the putamen is provided by the pathophysiology of Parkinson’s and Huntington’s disease, both exhibiting a variety of cognitive deficits as well as cell loss in the putamen. Nigrostriatal projection loss with dopamine deficiency in the putamen is the feature that characterises Parkinson’s disease [62], while atrophy patterns in the putamen have been described at different stages of Huntington’s disease [63]. Modulatory functions of neurotransmitters in relation to the putamen have also been described. In an animal study, Packard [64] demonstrated that rats which received an infusion of PLOS ONE | www.plosone.org
glutamate in the caudate-putamen exhibited increased place learning which influenced behaviour. This evidence suggests that the learning functions modulated by the putamen might depend on the concentration and/or balance of neurotransmitters. Our results extend the mutual modulatory role over the putamen also to GABA, although just in the sense of segregation of the motor input that occurs during resting state and that is driven by the activity of the DMN. Our results add to the existing evidence that GABA is an important neurotransmitter with diverse functions during resting state [32,33]. The results presented here highlight the role of GABA in the segregation of the motor engagement, which is an inherent condition that characterises resting state. The inhibitory functions of GABA have also been welldescribed [65]. GABAergic systems mediate most fast synaptic inhibition in the mammalian brain, controlling activity at both the network and the cellular levels. There is evidence of the role of GABA in motor inhibition [66], and moreover, our results highlight its inhibitory functions during resting state. Based on the best evidence our study included only male volunteers. The effect of female gonadal steroids on GABAergic systems is well-known and has been described as a modulator factor [67]. In a MRS study, Epperson et al. [68] found a reduction in cortical GABA levels during the follicular phase of the human menstrual cycle, and therefore, this explorative study included only male volunteers. Inhibitory functions direct multiple processes and networks in the central nervous system. In an fMRI study, Jaffard et al. [59] identified a network involved in motor inhibition which included the superior parietal lobule, PCC, precuneus, parahippocampal gyrus and thalamus. Some of these areas also belong to the DMN; hence they conclude that the resting state activity, which is not directly related to identifiable sensory or motor events, controls the balance between excitatory and inhibitory activations determining responsiveness to possible incoming events [59]. The PCC has been identified as a key structure in inhibition tasks with a possible role in alertness. Furthermore, activation of the putamen was identified when motor inhibition was expected to be ‘on’. Additionally, Hu and Li [69] confirmed that the PCC and putamen were both identified as areas involved in preparatory motor execution during rest. Moreover, dense anatomical connections between the PCC and the striatum have been described [8], supporting the role of PCC in directing the segregation of the motor input. The conclusion in the study by Jaffard et al. [59], according to which the activity at rest may be partly due to an active and sustained process consisting of locked movement initiation mechanism, is in line with our results and, moreover, we hypothesise that this mechanism is linked to the concentration of GABA. The fact that the concentration of GABA in the PCC, the ‘core’ of resting state, predicts the BOLD response of the putamen supports this hypothesis.
4
September 2014 | Volume 9 | Issue 9 | e106609
GABA in PCC Predicts Putamen Response during Resting State
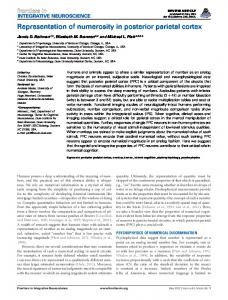
Figure 4. Mean z–values extracted from the left putamen in relation to GABA ratio in the PCC. doi:10.1371/journal.pone.0106609.g004
and GABA-H4 at 3.0 ppm is exploited by an on/off frequency selective RF pulse applied at 1.9 ppm [71]. Due to the lack of Jcoupling at 1.9 ppm for Cr, its signal at 3.0 ppm is removed by taking the difference from the two sets of measurements, leaving only the GABA-H4 peaks at 3.0 ppm. This method relies on the subtraction of two sets of spectra to remove any strong overlapping peaks; hence, it is vulnerable to any instability caused by the scanner, e.g., magnetic field drift, or by the subject, e.g., movement. Another popular method to detect GABA is two-dimensional MRS [72] in which a series of spectra that differ by a single parameter, such as a delay duration or the timing of a refocusing pulse, are acquired. The second spectral dimension contains the coupling information which, in turn, allows overlapping multiplets to be resolved. However, these experiments usually require longer acquisition time due to the increased number of measurements. Recently, Napolitano et al. [41] demonstrated that using a standard PRESS sequence with a set of optimised echo time parameters, they could reliably detect GABA in the ACC and the precuneus region in a shorter measurement time and in a smaller voxel size than previous studies with MEGA-PRESS. Due to the time constrain of the multi-modality investigation in this study, the standard PRESS sequence with optimised echo time parameters was chosen to detect GABA. The use of GABA ratio in the present study instead of absolute concentration is in agreement with previous publications [33,35], in which metabolite levels are commonly reported as their ratio to creatine. Creatine has been shown to be a stable metabolite in healthy individuals [73] and thus is commonly used as an internal reference in brain spectroscopy. Furthermore, in a study by Bogner et al. [74] GABA ratio exhibited the best reproducibility. From a technical point of view, we must remark that the separation and quantification of metabolites are often ambiguous and difficult due to several factors. First, since 80% of brain tissue is endogenous water, the water resonance peaks is several orders of magnitude higher than that of the metabolites, which can potentially distorts nearby metabolite resonance signals. Second, large subcutaneous lipids signals can potentially ruin metabolite signals. Third, the spectral resolution as well as the signal-to-noise ratio are often reduced by the anatomical induced magnetic field
Figure 3. Voxel-wise statistical maps with the inclusion of the GABA ratio measured in the PCC and generated by the dual regression analysis of the DMN. Significant voxels thresholded at p,0.05 (corrected). The point of lowest p value (p = 0.0002) was located in MNI coordinates x = 26, y = 10, z = 4. The background image is the MNI152 T1 (2 mm) template. doi:10.1371/journal.pone.0106609.g003
Even though our results appear plausible from a physiological point of view, some limitations must be mentioned. Unfortunately, the measures that each of the modalities provides are not necessarily complementary [27]. Furthermore, the concentrations of transmitters measured by MRS reflect also pools that are not used for neurotransmission, making it more difficult to understand the exact mechanisms of the neuro-biochemical relationships. Hence, the approach described here does not permit to answer questions of causality. GABA has a concentration of about 1 mM in human brain. This is about an order of magnitude lower than that of some other metabolites and is about 40,000 times lower than the concentration of water [70]. At 3 T, resonance peaks of GABA at 1.9 ppm, 2.3 ppm and 3.0 ppm overlap with the large resonance peaks from n-acetyl aspartate (NAA), total glutamate and glutamine (Glx), and creatine (Cr), respectively. These overlaps make the detection of GABA error-prone. Currently, the most commonly applied MRS method to separate the GABA signal from the rest of the spectrum is Mescher-Garwood point resolved spectroscopy (MEGAPRESS), in which the J-coupling between GABA-H3 at 1.9 ppm
PLOS ONE | www.plosone.org
5
September 2014 | Volume 9 | Issue 9 | e106609
GABA in PCC Predicts Putamen Response during Resting State
spatial inhomogeneity. Despite these difficulties were overcome in this study, the process of separating metabolite signals is still challenging because of the large number of overlapping metabolite resonance peaks confined in a narrow chemical shift range of ,4 ppm.
Our data support the notion that the activity of the DMN implies deactivation of the motor control circuit, which corresponds to the basal ganglia RSN, where putamen is a relevant structure. This study confirms once more the possibility and utility of measuring local concentration of transmitters using MRS.
Conclusions
Author Contributions
The results presented here show that the connection strength of putamen to the DMN during resting state has a negative linear relationship with the GABA ratio measured in the PCC. These findings highlight the role of PCC and c-aminobutyric acid in the segregation of the motor input that occurs during resting state.
Conceived and designed the experiments: JA IN. Performed the experiments: JA DT CA. Analyzed the data: JA DT. Contributed reagents/materials/analysis tools: IN NJS. Contributed to the writing of the manuscript: JA DT IN NJS.
References 1. Biswal B, Yetkin FZ, Haughton VM, Hyde JS (1995) Functional connectivity in the motor cortex of resting human brain using echo-planar MRI. Magn Reson Med 34: 537–541. 2. Raichle ME, MacLeod AM, Snyder AZ, Powers WJ, Gusnard DA, et al. (2001) A default mode of brain function. Proc Natl Acad Sci U S A 98: 676–682. 3. Biswal BB, Van Kylen J, Hyde JS (1997) Simultaneous assessment of flow and BOLD signals in resting-state functional connectivity maps. NMR Biomed 10: 165–170. 4. Beckmann CF, DeLuca M, Devlin JT, Smith SM (2005) Investigations into resting-state connectivity using independent component analysis. Philos Trans R Soc Lond B Biol Sci 360: 1001–1013. 5. Greicius MD, Srivastava G, Reiss AL, Menon V (2004) Default-mode network activity distinguishes Alzheimer’s disease from healthy aging: evidence from functional MRI. Proc Natl Acad Sci U S A 101: 4637–4642. 6. Bluhm RL, Miller J, Lanius RA, Osuch EA, Boksman K, et al. (2007) Spontaneous low-frequency fluctuations in the BOLD signal in schizophrenic patients: anomalies in the default network. Schizophr Bull 33: 1004–1012. 7. Delaveau P, Salgado-Pineda P, Fossati P, Witjas T, Azulay J-P, et al. (2010) Dopaminergic modulation of the default mode network in Parkinson’s disease. Eur Neuropsychopharmacol 20: 784–792. 8. Leech R, Sharp DJ (2014) The role of the posterior cingulate cortex in cognition and disease. Brain 137: 12–32. 9. Quarantelli M, Salvatore E, Giorgio SMDA, Filla A, Cervo A, et al. (2013) Default-mode network changes in Huntington’s disease: an integrated MRI study of functional connectivity and morphometry. PLoS One 8: e72159. 10. Sorg C, Riedl V, Mu¨hlau M, Calhoun VD, Eichele T, et al. (2007) Selective changes of resting-state networks in individuals at risk for Alzheimer’s disease. Proc Natl Acad Sci U S A 104: 18760–18765. 11. Werner CJ, Dogan I, Saß C, Mirzazade S, Schiefer J, et al. (2014) Altered resting-state connectivity in Huntington’s Disease. Hum Brain Mapp 35:2582– 2593. 12. Whitfield-Gabrieli S, Thermenos HW, Milanovic S, Tsuang MT, Faraone S V, et al. (2009) Hyperactivity and hyperconnectivity of the default network in schizophrenia and in first-degree relatives of persons with schizophrenia. Proc Natl Acad Sci U S A 106: 1279–1284. 13. Buckner RL, Andrews-Hanna JR, Schacter DL (2008) The brain’s default network: anatomy, function, and relevance to disease. Ann N Y Acad Sci 1124: 1–38. 14. Damoiseaux JS, Beckmann CF, Arigita EJS, Barkhof F, Scheltens P, et al. (2008) Reduced resting-state brain activity in the ‘‘default network’’ in normal aging. Cereb Cortex 18: 1856–1864. 15. Fransson P (2005) Spontaneous low-frequency BOLD signal fluctuations: an fMRI investigation of the resting-state default mode of brain function hypothesis. Hum Brain Mapp 26: 15–29. 16. Snyder AZ, Raichle ME (2012) A brief history of the resting state: The Washington University perspective. Neuroimage 62: 1–9. 17. Raichle ME, Snyder AZ (2007) A default mode of brain function: a brief history of an evolving idea. Neuroimage 37: 1083–90; discussion 1097–9. 18. Greicius MD, Krasnow B, Reiss AL, Menon V (2003) Functional connectivity in the resting brain: a network analysis of the default mode hypothesis. Proc Natl Acad Sci U S A 100: 253–258. 19. Fox MD, Snyder AZ, Vincent JL, Corbetta M, Van Essen DC, et al. (2005) The human brain is intrinsically organized into dynamic, anticorrelated functional networks. Proc Natl Acad Sci U S A 102: 9673–9678. 20. Cavanna AE, Trimble MR (2006) The precuneus: a review of its functional anatomy and behavioural correlates. Brain 129: 564–583. 21. Hagmann P, Cammoun L, Gigandet X, Meuli R, Honey CJ, et al. (2008) Mapping the structural core of human cerebral cortex. PLoS Biol 6: e159. 22. Vogt BA, Finch DM, Olson CR (1992) Functional heterogeneity in cingulate cortex: the anterior executive and posterior evaluative regions. Cereb Cortex 2: 435–443. 23. Greicius MD, Supekar K, Menon V, Dougherty RF (2009) Resting-state functional connectivity reflects structural connectivity in the default mode network. Cereb Cortex 19: 72–78.
PLOS ONE | www.plosone.org
24. Vogt BA, Laureys S (2005) Posterior cingulate, precuneal and retrosplenial cortices: cytology and components of the neural network correlates of consciousness. Prog Brain Res 150: 205–217. 25. Zou Q, Wu CW, Stein EA, Zang Y, Yang Y (2009) Static and dynamic characteristics of cerebral blood flow during the resting state. Neuroimage 48: 515–524. 26. Tomasi D, Volkow ND (2010) Functional connectivity density mapping. Proc Natl Acad Sci U S A 107: 9885–9890. 27. Duncan NW, Wiebking C, Mun˜oz-Torres Z, Northoff G (2014) How to investigate neuro-biochemical relationships on a regional level in humans? Methodological considerations for combining functional with biochemical imaging. J Neurosci Methods 221: 183–188. 28. Hahn A, Wadsak W, Windischberger C, Baldinger P, Ho¨flich AS, et al. (2012) Differential modulation of the default mode network via serotonin-1A receptors. Proc Natl Acad Sci U S A 109: 2619–2624. 29. Enzi B, Duncan NW, Kaufmann J, Tempelmann C, Wiebking C, et al. (2012) Glutamate modulates resting state activity in the perigenual anterior cingulate cortex - a combined fMRI-MRS study. Neuroscience 227: 102–109. 30. Hasler G, van der Veen JW, Tumonis T, Meyers N, Shen J, et al. (2007) Reduced prefrontal glutamate/glutamine and gamma-aminobutyric acid levels in major depression determined using proton magnetic resonance spectroscopy. Arch Gen Psychiatry 64: 193–200. 31. Sanacora G, Gueorguieva R, Epperson CN, Wu Y-T, Appel M, et al. (2004) Subtype-specific alterations of gamma-aminobutyric acid and glutamate in patients with major depression. Arch Gen Psychiatry 61: 705–713. 32. Northoff G, Walter M, Schulte RF, Beck J, Dydak U, et al. (2007) GABA concentrations in the human anterior cingulate cortex predict negative BOLD responses in fMRI. Nat Neurosci 10: 1515–1517. 33. Donahue MJ, Near J, Blicher JU, Jezzard P (2010) Baseline GABA concentration and fMRI response. Neuroimage 53: 392–398. 34. Muthukumaraswamy SD, Edden RAE, Jones DK, Swettenham JB, Singh KD (2009) Resting GABA concentration predicts peak gamma frequency and fMRI amplitude in response to visual stimulation in humans. Proc Natl Acad Sci U S A 106: 8356–8361. 35. Kapogiannis D, Reiter DA, Willette AA, Mattson MP (2013) Posteromedial cortex glutamate and GABA predict intrinsic functional connectivity of the default mode network. Neuroimage 64: 112–119. 36. Filippini N, MacIntosh BJ, Hough MG, Goodwin GM, Frisoni GB, et al. (2009) Distinct patterns of brain activity in young carriers of the APOE-e4 allele. Proc Natl Acad Sci 106: 7209–7214. 37. Zuo X-N, Kelly C, Adelstein JS, Klein DF, Castellanos FX, et al. (2010) Reliable intrinsic connectivity networks: test-retest evaluation using ICA and dual regression approach. Neuroimage 49: 2163–2177. 38. Beckmann CF, Smith SM (2004) Probabilistic independent component analysis for functional magnetic resonance imaging. IEEE Trans Med Imaging 23: 137– 152. 39. Wittchen H-U, Pfister H (1997) DIA-X-Interviews: Manual fu¨ r Screening-Verfahren und Interview; Interviewheft. Available: http:// pubman.mpdl.mpg.de/pubman/faces/viewItemFullPage.jsp;jsessionid = 7E7416C4873C2CE37AD0EAA806D6A319?itemId = escidoc:1646479:1& view = EXPORT. 40. Oldfield RC (1971) The assessment and analysis of handedness: the Edinburgh inventory. Neuropsychologia 9: 97–113. 41. Napolitano A, Kockenberger W, Auer DP (2013) Reliable gamma aminobutyric acid measurement using optimized PRESS at 3 T. Magn Reson Med 69: 1528– 1533. 42. Gruetter R, Tka´c I (2000) Field mapping without reference scan using asymmetric echo-planar techniques. Magn Reson Med 43: 319–323. 43. Provencher SW (2001) Automatic quantitation of localized in vivo 1H spectra with LCModel. NMR Biomed 14: 260–264. 44. Smith SA, Levante TO, Meier BH, Ernst RR (1994) Computer Simulations in Magnetic Resonance. An Object-Oriented Programming Approach. J Magn Reson Ser A 106: 75–105.
6
September 2014 | Volume 9 | Issue 9 | e106609
GABA in PCC Predicts Putamen Response during Resting State
61. Buerger AA, Gross CG, Rocha-Miranda CE (1974) Effects of ventral putamen lesions on discrimination learning by monkeys. J Comp Physiol Psychol 86: 440– 446. 62. Brooks DJ (2010) Imaging approaches to Parkinson disease. J Nucl Med 51: 596–609. 63. Younes L, Ratnanather JT, Brown T, Aylward E, Nopoulos P, et al. (2012) Regionally selective atrophy of subcortical structures in prodromal HD as revealed by statistical shape analysis. Hum Brain Mapp 35:792–809. 64. Packard MG (1999) Glutamate infused posttraining into the hippocampus or caudate-putamen differentially strengthens place and response learning. Proc Natl Acad Sci U S A 96: 12881–12886. 65. Jacob TC, Moss SJ, Jurd R (2008) GABA(A) receptor trafficking and its role in the dynamic modulation of neuronal inhibition. Nat Rev Neurosci 9: 331–343. 66. Van den Wildenberg WPM, Burle B, Vidal F, van der Molen MW, Ridderinkhof KR, et al. (2010) Mechanisms and dynamics of cortical motor inhibition in the stop-signal paradigm: a TMS study. J Cogn Neurosci 22: 225– 239. 67. Majewska MD, Harrison NL, Schwartz RD, Barker JL, Paul SM (1986) Steroid hormone metabolites are barbiturate-like modulators of the GABA receptor. Science 232: 1004–1007. 68. Epperson CN, Haga K, Mason GF, Sellers E, Gueorguieva R, et al. (2002) Cortical gamma-aminobutyric acid levels across the menstrual cycle in healthy women and those with premenstrual dysphoric disorder: a proton magnetic resonance spectroscopy study. Arch Gen Psychiatry 59: 851–858. 69. Hu S, Li C-SR (2012) Neural processes of preparatory control for stop signal inhibition. Hum Brain Mapp 33: 2785–2796. 70. Puts NAJ, Edden RAE (2012) In vivo magnetic resonance spectroscopy of GABA: a methodological review. Prog Nucl Magn Reson Spectrosc 60: 29–41. 71. Mescher M, Merkle H, Kirsch J, Garwood M, Gruetter R (1998) Simultaneous in vivo spectral editing and water suppression. NMR Biomed 11: 266–272. 72. Ke Y, Cohen BM, Bang JY, Yang M, Renshaw PF (2000) Assessment of GABA concentration in human brain using two-dimensional proton magnetic resonance spectroscopy. Psychiatry Res 100: 169–178. 73. Soher BJ, van Zijl PC, Duyn JH, Barker PB (1996) Quantitative proton MR spectroscopic imaging of the human brain. Magn Reson Med 35: 356–363. 74. Bogner W, Gruber S, Doelken M, Stadlbauer A, Ganslandt O, et al. (2010) In vivo quantification of intracerebral GABA by single-voxel (1)H-MRS-How reproducible are the results? Eur J Radiol 73: 526–531.
45. Maudsley AA, Govindaraju V, Young K, Aygula ZK, Pattany PM, et al. (2005) Numerical simulation of PRESS localized MR spectroscopy. J Magn Reson 173: 54–63. 46. Jenkinson M, Bannister P, Brady M, Smith S (2002) Improved optimization for the robust and accurate linear registration and motion correction of brain images. Neuroimage 17: 825–841. 47. Smith SM (2002) Fast robust automated brain extraction. Hum Brain Mapp 17: 143–155. 48. Jenkinson M, Smith S (2001) A global optimisation method for robust affine registration of brain images. Med Image Anal 5: 143–156. 49. Smith SM, Fox PT, Miller KL, Glahn DC, Fox PM, et al. (2009) Correspondence of the brain’s functional architecture during activation and rest. Proc Natl Acad Sci U S A 106: 13040–13045. 50. Nichols TE, Holmes AP (2002) Nonparametric permutation tests for functional neuroimaging: a primer with examples. Hum Brain Mapp 15: 1–25. 51. Smith SM, Nichols TE (2009) Threshold-free cluster enhancement: addressing problems of smoothing, threshold dependence and localisation in cluster inference. Neuroimage 44: 83–98. 52. Nichols T, Hayasaka S (2003) Controlling the familywise error rate in functional neuroimaging: a comparative review. Stat Methods Med Res 12: 419–446. 53. Tomasi D, Volkow ND (2011) Association between functional connectivity hubs and brain networks. Cereb Cortex 21: 2003–2013. 54. Robinson S, Basso G, Soldati N, Sailer U, Jovicich J, et al. (2009) A resting state network in the motor control circuit of the basal ganglia. BMC Neurosci 10: 137. 55. Tomasi D, Volkow ND (2011) Functional connectivity hubs in the human brain. Neuroimage 57: 908–917. 56. Di X, Biswal BB (2014) Modulatory interactions between the default mode network and task positive networks in resting-state. PeerJ 2: e367. 57. Tomasi D, Volkow ND, Wang R, Telang F, Wang G-J, et al. (2009) Dopamine transporters in striatum correlate with deactivation in the default mode network during visuospatial attention. PLoS One 4: e6102. 58. DeLong MR, Alexander GE, Georgopoulos AP, Crutcher MD, Mitchell SJ, et al. (1984) Role of basal ganglia in limb movements. Hum Neurobiol 2: 235–244. 59. Jaffard M, Longcamp M, Velay J-L, Anton J-L, Roth M, et al. (2008) Proactive inhibitory control of movement assessed by event-related fMRI. Neuroimage 42: 1196–1206. 60. Packard MG, Knowlton BJ (2002) Learning and memory functions of the Basal Ganglia. Annu Rev Neurosci 25: 563–593.
PLOS ONE | www.plosone.org
7
September 2014 | Volume 9 | Issue 9 | e106609