REPORTS
Gamma Oscillations and Object Processing in the Infant Brain G. Csibra,1* G. Davis,1 M. W. Spratling,1 M. H. Johnson1 An enduring controversy in neuroscience concerns how the brain “binds” together separately coded stimulus features to form unitary representations of objects. Recent evidence has indicated a close link between this binding process and 40-hertz (gamma-band) oscillations generated by localized neural circuits. In a separate line of research, the ability of young infants to perceive objects as unitary and bounded has become a central focus for debates about the mechanisms of perceptual development. Here we demonstrate that bindingrelated 40-hertz oscillations are evident in the infant brain around 8 months of age, which is the same age at which behavioral and event-related potential evidence indicates the onset of perceptual binding of spatially separated static visual features. Our perception of coherent unified objects depends crucially on the brain’s ability to “bind” together various features that are coded by early stages of vision (1). One promising recent line of research has demonstrated a close association between gamma-band (⬇40-Hz) oscillations of neural activity and visual binding, pointing to a central role for oscillatory neural circuits. This link between oscillations and binding was first evident in recordings from single cells in the monkey and cat cortex (2), but more recent studies have used electroencephalography (3, 4) and behavioral techniques (5) to reveal similar phenomena within the adult human brain. Psychophysical experiments have demonstrated that the presentation of stimuli in synchrony with a 40-Hz oscillation helps temporal binding, whereas electrophysiological studies have provided evidence for gammaband bursts of neural activity contingent with the experience of object perception. In a previously unrelated line of research, experimenters have sought to determine the extent of object processing abilities in young infants and the features and cues they rely on when parsing visual scenes into objects (6). One of the ways in which infants’ object processing abilities have been probed is in assessing whether they are able to perceive static illusory objects composed from a number of spatially separate elements (7, 8). Results from behavioral studies demonstrate that although infants of 7 months and older perceive static illusory objects such as the Kanizsa figure (Fig. 1A), infants of 5 months or less do not (9). To date, studies of object processing in infants have used behavioral paradigms such as habituation or preferential looking. Although such paradigms have been 1 Centre for Brain and Cognitive Development, School of Psychology, Birkbeck College, University of London, Malet Street, London WC1E 7HX, UK.
*To whom correspondence should be addressed. Email:
[email protected]
1582
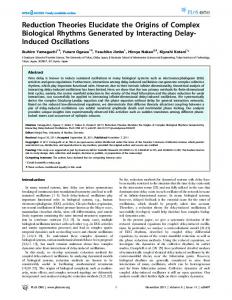
useful, the ability to make more direct measurements of neural processing in a noninvasive fashion would substantially advance research. Gamma-band electrophysiological responses may provide a specific neural marker for the perceptual binding of spatially separate elements in the infant brain. In the present study, we combine recent advances in adult neuroimaging research with this behavioral work by investigating binding-related gamma oscillations in infants while they viewed static illusory objects. To elicit binding-related activation, we presented infants with a Kanizsa subjective-figure pattern (Fig. 1A), which is known to yield the percept of an illusory square that is sensitive to the binding of the separate “pacmen” elements within the stimulus into a coherent object (10). The Kanizsa square is therefore an ideal candidate for measuring binding effects and has formed the basis of several previous studies of gamma oscillations in adults (3, 11). Furthermore, this pattern has featured prominently in previous behavioral studies of perceptual development, so that the current findings can be viewed in the context of a substantial body of other data. We compared brain activation elicited by the Kanizsa square to that elicited by a control stimulus (Fig. 1B) composed of precisely the same pacmen elements as the Kanizsa square. However, in the control stimulus, the pacmen were rearranged so as not to elicit perceptual grouping and consequently no percept of an illusory figure. Any binding-related activation should thus pertain only to the Kanizsa square, not to the control stimulus. In all, 11 6-month-old and 11 8-month-old infants viewed Kanizsa squares and control stimuli on a computer screen (12) while an electroencephalogram (EEG) was recorded (13) with a Geodesic Sensor Net composed of 62 electrodes (14). The recording was then subjected to time-frequency analysis to yield a measure of induced oscillatory brain activation (15). Given the results of previous
behavioral studies, we predicted that the 8-month-old infants, like adults in previous studies, would show induced gamma-band activation in response to the Kanizsa square. In adults, binding involved in the perception of illusory objects induces a burst of 40-Hz oscillations at about 250 to 300 ms after stimulus onset. This characteristic gamma burst would not be expected after presentation of the control stimulus. In contrast to our predictions for the 8-month-olds, we anticipated that infants of 6 months would not show binding-related gamma oscillations. Our time-frequency analysis for 8-monthold infants is illustrated in Fig. 2A. There was an enhancement of induced gamma-band activity in response to the Kanizsa square over the left frontal scalp in the 240- to 320-ms time window, corresponding in time course to results found in adults. No equivalent gamma enhancement was seen in response to the control stimulus (16). However, the response to the control stimuli showed a significant decrease in activity within the gamma band over the same scalp areas and at slightly earlier latency (around 200 ms). This effect has never been reported in adults. However, in contrast to studies with adults, our test stimuli were preceded by attractive colorful pictures (a cartoon figure, an animal, or a geometric shape), which might also have engaged feature-binding processes. Thus, one plausible interpretation of the suppression of gamma-band activity is that it is a response to the removal of a foveated object that no longer requires active representation (17). We suggest that the gamma-band activity during presentation of the Kanizsa square did not show this suppression either because it overlapped in time with the enhanced gamma-band activity resulting from the illusory object binding, or because the Kanizsa square acted as an occluder, and infants maintain a
Fig. 1. The experimental stimuli. In each trial, the infant’s attention was drawn to the dark gray screen by a moving and/or shrinking image (a geometric shape, a cartoon figure, a picture of an animal, or a blinking face). This image stopped at the center for 800 to 1200 ms at a size not larger than 2.5 cm by 2.5 cm before it was replaced by either a Kanizsa square (A) or a control stimulus (B) for 307 ms. The two types of stimulus were presented in random order and their size was 5 cm by 5 cm (3.8° of visual angle from 75-cm distance); the size of the illusory square was 3 cm by 3 cm (2.3° of visual angle).
24 NOVEMBER 2000 VOL 290 SCIENCE www.sciencemag.org
REPORTS mental representation of the occluded stimulus. Kanizsa figures have been shown to be able to act as occluding surfaces (18), and this latter account is consistent with evidence from experiments in human adults showing a similar left frontal scalp pattern of 40-Hz oscillation in task situations that require participants to maintain an object representation while it is not directly visible (19) and with single-cell studies in primates showing the activity of neurons in the frontal cortex during object permanence tasks (20). The time-frequency analysis for the group of 6-month-old infants yielded quite different results from those observed in the older group (Fig. 2B). Although there were some fluctuations in amplitude in the gamma band over the left frontal cortex after presentation of the Kanizsa squares, these did not come in bursts
like those observed in adults but were smeared over long time intervals. The absence of adultlike binding-related gamma oscillation in 6-month-olds could be due to any one of a number of factors (21). In general, the pattern of EEG observed in 6-montholds is consistent with partial activation of gamma-band oscillatory responses, and probably binding processes, but with a much higher variability in latency, both between and within infants (22). This finding suggests that the neural development around 6 to 8 months of age that allows infants to perceive static illusory objects involves a decrease in the variability of gammarange bursts of oscillatory activity in the frontal cortex. It is also conceivable that, at this transitional age, a subset of the 6-month-old infants in our sample were able to bind the
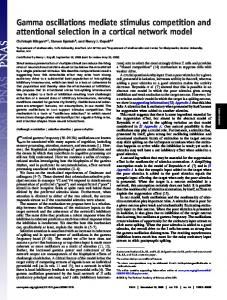
Fig. 2. Gamma-band EEG responses. (A) Time-frequency plots of the amplitude averaged across single trials and grand-averaged across 8-month-old infants. The plot represents the average amplitude of frequency content measured at three left frontal electrodes within the F3-F7-Fp1 triangle, marked on the scalp surface maps. The vertical line at time 0 indicates the stimulus onset. The colors code the modulation of frequency content as compared to the prestimulus baseline: Red represents enhancement and blue represents reduction. Statistical reliability was assessed on the basis of the average amplitude in the 32- to 48-Hz frequency range (28). The amplitude of the gamma band was significantly more positive in the 180- to 320-ms poststimulus interval after the Kanizsa square than after the control stimulus in both parametric and nonparametric tests [t (10) ⫽ 2.84, P ⬍ 0.02; Wilcoxon: z ⫽ 2.223, P ⬍ 0.03]. Additionally, the box in the top plot (240 to 320 ms) indicates an increase from the baseline in 40-Hz oscillation in response to the Kanizsa square in 9 out of 11 infants [t (10) ⫽ 2.02, P ⬍ 0.07; sign test: P ⬍ 0.07]. The box in the bottom plot (180 to 260 ms)
visual elements into a Kanizsa figure. Analyses of the early, low-frequency, event-related potential (ERP) responses revealed that infants in both age groups discriminated between the two stimuli (Fig. 3A). However, only the 8-month-old group showed the pattern characteristic of adult ERPs (11, 23), providing evidence that they were perceiving an illusory object in the Kanizsa square (24). This study of binding and gamma oscillations in the infant brain provides evidence that by 8 months of age, infants show gamma bursts similar to those of adults when perceiving illusory objects that require feature binding of spatially separate elements. Our results also indicate that the frontal cortex may play a crucial role in the development of this important perceptual mechanism. The in-
indicates a significant decrease from the baseline in 40-Hz content in response to the control stimulus, again in 9 out of 11 infants [t (10) ⫽ 2.74, P ⬍ 0.02; sign test: P ⬍ 0.07]. At the right of the time-frequency plots, topographical scalp maps depict the scalp distribution of the average 32- to 48-Hz content relative to the prestimulus baseline at the peak of gammaband increase (288 ms poststimulus) in Kanizsa trials and gamma-band decrease (228 ms poststimulus) in control trials, respectively. The curves at the bottom show the overall amplitude change at the three left frontal electrodes at 40 Hz. (B) Similar time-frequency and topographical plots for the 6-month-old infants. Statistical tests revealed no significant difference between the two conditions in the 180- to 320-ms interval [t (10) ⫽ 0.96, P ⬎ 0.3; Wilcoxon: z ⫽ 1.60, P ⬎ 0.1]. The scalp maps represent the average gamma-band amplitude in the 100- to 500-ms interval. Comparison of this longer time interval reached statistical significance only at the electrode location marked by a white square [t (10) ⫽ 2.68, P ⬍ 0.05; Wilcoxon: z ⫽ 2.401, P ⬍ 0.02].
www.sciencemag.org SCIENCE VOL 290 24 NOVEMBER 2000
1583
REPORTS 9.
10. 11. 12.
13.
14.
Fig. 3. ERPs elicited by Kanizsa squares and control stimuli in 8- and 6-month-old infants (29). (A) ERP waveforms at the midline frontal electrode (Fz) and the two parieto-occipital electrodes (PO1 and PO2, approximately halfway between P3-O1 and P4-O2, respectively). Both age groups showed a right lateralized parieto-occipital positive peak at 136 ms after stimulus onset, and the amplitude of this component was significantly different between the two stimuli in both age groups. Asterisks indicate statistically significant differences, in the positive peak around 136 ms at PO2, measured as mean amplitude in the 120- to 160-ms window [t (10) ⫽ 2.97, P ⬍ 0.02, and t (10) ⫽ 4.01, P ⬍ 0.01 in the 8- and 6-month-old groups, respectively]. The 8-month-old group also showed a significantly higher positivity at the midline frontal electrode (Fz) and neighboring electrodes at about 200 ms after stimulus onset, measured as mean amplitude in the 180- to 220-ms window [t (10) ⫽ 2.28, P ⬍ 0.05]. This effect was not present in the ERPs of the 6-month-olds. (B) Time-frequency plots of the stimulus-evoked gamma activity calculated from the unfiltered ERPs by wavelet analysis. The plot represents the average amplitude of the two lateral occipital electrodes (O1 and O2). The activity bursts extending into the gamma band reflect phase-locked gamma responses evoked by the onset and offset of both stimuli in both age groups, and they are similar to the early phase-locked responses described in adults (3).
volvement of the frontal cortex in perceptual binding in infants differs somewhat from results in adults, in which various cortical regions have been implicated both in the perception of illusory contours (25) and in binding-related gamma-band activity (26). Along with other findings (27), this suggests a critical role for the frontal cortex in infant visual cognition, although more studies are needed to determine whether the frontal activation is directly related to the binding process or reflects further attentional processing on the object “bound” elsewhere in the infant brain. These results open a vista of possible future experiments, including studies of object permanence, in which the brain activity of in-
1584
15.
w共t, f 兲 ⫽
1. A. Treisman, H. Schmidt, Cogn. Psychol. 14, 459 (1982). 2. W. Singer, C. M. Gray, Annu. Rev. Neurosci. 18, 555 (1995). 3. C. Tallon-Baudry, O. Bertrand, C. Delpuech, J. Pernier, J. Neurosci. 16, 4240 (1996). 4. M. M. Mu¨ller et al., Exp. Brain Res. 112, 96 (1996). 5. M. A. Elliott, H. J. Mu¨ller, J. Exp. Psychol. Learn. Mem. Cogn. 26, 703 (2000). 6. P. J. Kellman, M. S. Banks in Handbook of Child Development, W. Damon, Ed. (Wiley, New York, 1998), vol. 2, pp. 103–146. 7. B. I. Bertenthal, J. J. Campos, M. M. Haith, Child Dev. 51, 1072 (1980). 8. M. J. Kavsek, unpublished data presented as a poster
1
t 冑
exp
冉 冊 ⫺ t2 2 t2
exp共2ift兲
and in this application t ⫽ 3.5/f The coefficients of the wavelet transform at a particular frequency, f , are calculated by convolving the signal s(t) with the wavelet w(t, f ) and taking the modulus of the resulting complex coefficients E共t, f 兲 ⫽ 兩s共t兲 丢 w共t, f 兲兩
fants during object processing can be measured directly. References and Notes
at the Biennial Meeting of the Society for Research in Child Development, Albuquerque, NM, 17 April 1999. Although there is one paper reporting mixed results concerning the discrimination of static Kanizsa figures in babies younger than 6 months old [H. Ghim, Infant Behav. Dev. 13, 221 (1990)], several other studies [such as (7, 8)], including unpublished experiments from our own laboratory (see www.psyc. bbk.ac.uk/cbcd/studies/kaniduck/kaniduck.html), have failed to demonstrate it in babies less than 6 months old. G. Kanizsa, Sci. Am. 234, 48 (1976). C. S. Herrmann, A. Mecklinger, W. Pfeifer, Clin. Neurophysiol. 110, 636 (1999). The age range was 235 to 249 days (mean, 242.7 days) and 184 to 193 days (mean, 189.1 days) in the 8- and 6-month-old groups, respectively. Both age groups consisted of six male and five female infants. An additional 35 infants were tested but were excluded from the analysis because they did not complete enough trials [20 infants, see (13)] or because of movement or electrical artefacts (11 and 4 infants, respectively). The behavior of the participants was video-recorded and coded offline to identify epochs when they were not attending the stimuli. We obtained informed consent from the parents of all participating infants. The brain electric potentials were recorded against a vertex reference, amplified with 0.1- to 100-Hz bandpass filtering, digitized at a 250-Hz sampling rate, stored on computer disk, and segmented offline into EEG trials with 200-ms prestimulus and 600-ms poststimulus onset duration. Trials with the infant not attending the screen in the interval between 500 ms before and 600 ms after stimulus onset were rejected from further analyses. Movement and electrical artefacts were identified and rejected by trial-by-trial inspection of the recorded EEG. Infants with less than 30 valid artefact-free trials in either condition were excluded. The average number of trials per condition used in wavelet and ERP analyses was 63.5 and 60.7 in 8- and 6-month-old infants, respectively. D. Tucker, Electroencephalogr. Clin. Neurophysiol. 87, 154 (1993). We applied a continuous wavelet transformation to single trials of EEGs in each channel, using Morlet wavelets at 1-Hz intervals in the 21- to 60-Hz range. A Morlet wavelet is a complex function of time (t) and frequency ( f ) defined as
16.
17.
18. 19. 20. 21.
Average wavelet coefficients within infants were calculated by taking the mean across trials. The average amplitude during the 100-ms prestimulus interval was considered as the baseline level and was subtracted from the whole time-varying signal. The mean amplitude between 32 and 48 Hz was taken as the measure of gamma-band EEG activity. Both stimuli resulted in an early phase-locked gamma burst similar to that observed in adults (3, 11), observable in the time-frequency analyses of the averaged ERPs (Fig. 3B). An analysis of variance on the uncorrected absolute baseline level of gamma-band activity over the left frontal cortex during the 100-ms interval before stimulus presentation did not reveal any difference between stimulus types or age groups. G. Davis, J. Driver, J. Exp. Psychol. Hum. Percept. Perform. 24, 169 (1998). C. Tallon-Baudry, O. Bertrand, F. Perronnet, J. Pernier, J. Neurosci. 18, 4244 (1998). M. S. A. Graziano, X. T. Hu, C. G. Gross, Science 277, 239 (1997). Two of these explanations can be ruled out on the basis of the results. First, it may be that the younger
24 NOVEMBER 2000 VOL 290 SCIENCE www.sciencemag.org
REPORTS infants simply do not perceive the difference between the two stimuli because of limitations in their eye and early visual processing. We can exclude this explanation because analysis of the low-frequency transient visual ERPs elicited by the Kanizsa square and the control stimuli showed significant effects of stimulus for both the 6- and the 8-month-old groups (Fig. 3A). Second, it may be that gammalike effects can be observed at lower frequencies in 6-month-old infants than in adults and 8-month-olds. To examine this possibility, we analyzed oscillatory activity at a lower frequency range (21 to 32 Hz) but still failed to find equivalent bindingrelated bursts corresponding to those reported in the gamma-band frequency in older participants. 22. The between-subject SD of the latency of peak gamma activity after Kanizsa square stimulus at the three
23. 24.
25. 26. 27.
left frontal electrodes (Fig. 2) was 76.4 ms and 113.3 ms in 8- and 6-month-olds, respectively. The SD of the latency of minimal gamma activity after the control stimulus was 57.7 ms and 93.1 ms in 8- and 6-month-olds, respectively. M. Sugawara, T. Morotomi, Scand. J. Psychol. 32, 352 (1991). Both adults (3, 11, 23) and 8-month-olds show a more negative ERP over the occipital cortex in response to Kanizsa figures than to control stimuli from about 120 ms after stimulus presentation. D. H. Ffytche, S. Zeki, Neuroimage 3, 104 (1996). C. Tallon-Baudry, O. Bertrand, C. Wienbruch, B. Ross, C. Pantev, Neuroreport 8, 1103 (1997). G. Csibra, L. A. Tucker, M. H. Johnson, Int. J. Psychophysiol. 29, 210 (1998).
“Fluorescent Timer”: Protein That Changes Color with Time Alexey Terskikh,1* Arkady Fradkov,2 Galina Ermakova,2 Andrey Zaraisky,2 Patrick Tan,1 Andrey V. Kajava,3 Xiaoning Zhao,4 Sergey Lukyanov,2 Mikhail Matz,2 Stuart Kim,1 Irving Weissman,1 Paul Siebert4 We generated a mutant of the red fluorescent protein drFP583. The mutant (E5) changes its fluorescence from green to red over time. The rate of color conversion is independent of protein concentration and therefore can be used to trace time-dependent expression. We used in vivo labeling with E5 to measure expression from the heat shock– dependent promoter in Caenorhabditis elegans and from the Otx-2 promoter in developing Xenopus embryos. Thus, E5 is a “fluorescent timer” that can be used to monitor both activation and downregulation of target promoters on the whole-organism scale. Green fluorescent protein (GFP) from the luminescent jellyfish Aequorea victoria is an important tool in molecular and cellular biology as a transcriptional reporter, fusion tag, or biosensor (1). The recent discovery of GFP-like fluorescent proteins from nonbioluminescent Anthozoa species (2), in particular the red fluorescent protein drFP583, has opened new horizons for multicolor labeling and fluorescence resonance energy transfer applications. An earlier report (2) suggested that the red fluorophore of drFP583 requires an additional autocatalytic modification of a GFP-like fluorophore. We thus generated mutants of drFP583 using error-prone polymerase chain reaction (PCR) (3) and screened for mutants exhibiting a green intermediate fluorescence (4). Mutations resulted in proteins with varying fluorescent properties, such as faster maturation, double emission (green and red), or exclusive green fluorescence. Of particular 1 School of Medicine, Stanford University, Stanford, CA 94305, USA. 2Institute of Bioorganic Chemistry, Russian Academy of Science, 117871 Moscow, Russia. 3 Center for Molecular Modeling, Center for Information Technology, NIH, Building 12A, Bethesda, MD 20892, USA. 4Clontech Laboratories, 1020 East Meadow Circle, Palo Alto, CA 94303, USA.
*To whom correspondence should be addressed. Email:
[email protected]
interest was the E5 mutant, which changes its fluorescence over time. This mutant changed from initial bright green fluorescence to yellow, orange, and finally red over time (Fig. 1, A and B). Yellow and orange fluorescence indicate that the protein species with green and red fluorophores are both present (Fig. 1B, color insert). The existence of a greenemitting intermediate suggests that E5 maturation involves the modification of a GFPlike fluorophore to give the red fluorophore. Changing the temperature had the same effect on the rates of decay of green fluorescence and growth of red fluorescence, which suggests that these processes reflect the same chemical reaction (Fig. 1B). In addition, the overall reaction speed was independent of the initial concentration of E5 protein in the range from 10 g/ml to 1 mg/ml (as in Fig. 1B). It was also insensitive to variations in ionic strength in the range from 10 mM to 1 M NaCl, to the presence of 150 mM EDTA, or to changes in pH between 7.0 and 8.0. pH values below 4.5 or above 12 resulted in the disappearance of the red-shifted absorption and the appearance of 386-nm or 448-nm absorption peaks for acid and alkali, respectively (this was also observed for drFP583) (Fig. 1D). This is strikingly similar to the absorption spectra of GFP— 383 nm and 446 nm for acid and alkali, respectively (5)—in which the pH-dependent shift between 383
28. We selected four regions for statistical comparisons on the basis of previous works: bilateral occipital areas (25) and bilateral frontal areas (11). Only the statistically reliable effects are reported. 29. The ERPs were digitally filtered with an elliptical low-pass filter at 35 Hz and converted to an average reference. ´. Volein for their assistance 30. We thank L. Tucker and A in recording and coding data, and the UK Medical Research Council ( program grant G9715587), the European Commission (BioMed grant BMH4-CT972032), the Royal Society, and Birkbeck College for support of this project. 20 June 2000; accepted 23 October 2000
and 446 nm is due to ionization of the fluorophore phenolic group (6). The maturation from green to red fluorescence slows down considerably in deoxygenated buffer, suggesting that the fluorophore modification requires molecular oxygen. The properties of E5 provide insight into the nature of the red fluorophore; for instance, we detected similar fluorescence dynamics in drFP583, although barely detectable changes in green fluorescence make it unsuitable for practical application (Fig. 1C). As compared to drFP583, E5 has two substitutions: Val105 3 Ala105 (V105A) and Ser197 3 Thr197 (S197T). The impact of each substitution on the fluorescent properties of E5 was assessed in single mutants. Mutation V105A resulted in a twofold increase in fluorescence quantum yield as compared to drFP583 but no spectral shifts, whereas the S197T mutant essentially recapitulated the fluorescent timer phenotype. We modeled the structure of drFP583 on the basis of GFP crystal structure (7) (details of modeling are available at www.sciencemag.org/cgi/content/ full/290/5496/1585/DC1 and the atomic coordinates are available at http://cmm.info. nih.gov/kajava) and found that Ser 197 in drFP583 is analogous to Thr 203 in GFP. Thr 203 is in direct contact with the fluorophore (7, 8), and replacements at this position invariably alter the fluorescent properties of GFP (9–12). E5 has the potential to function as a fluorescent clock, giving temporal and spatial information on target promoter activity. Green fluorescent areas would indicate recent activation, yellow-to-orange regions would signify continuous promoter activity, and red fluorescent cells and tissues would denote areas in which promoter activity has ceased after an extended “on” period. In vitro, the rate of color conversion (the red:green ratio) is independent of the protein concentration, suggesting that it will not depend on the expression level within a cell. Given the superior in vivo stability of drFP583 as compared to GFP (2), protein degradation of either the green or red form is unlikely to be a problem. This approach would make it possible to discriminate changes in gene expres-
www.sciencemag.org SCIENCE VOL 290 24 NOVEMBER 2000
1585