Specifically, if a graphic designer chooses a light blue for his image, he likely wants to ... Adobe Acrobat Reader was used to display the monitor images.
Gamut-Mapping Techniques for Business Graphics Karen M. Braun, Raja Balasubramanian, and Steven J. Harrington Digital Imaging Technology Center, Xerox Corporation Webster, NY clipping,2 are explained in detail in another paper by Braun et al.3 Straight device mapping (CMY = 1- RGB) was included, as were a rotated device mapping using two different UCR strategies and a tetrahedron mapping technique. The data for the tetrahedron mapping was obtained through a pilot study involving assigning color names to various printer and monitor colors.
Abstract Six algorithms were developed and tested for gamut mapping business graphics created on a CRT display to a printer. Psychophysical analysis showed that a variation of mapping CRT primaries to printer primaries gave the most favorable results. This transformation was in “device space” (noncolorimetric) and the colors were rotated such that monitor blue mapped between printer blue and cyan. Other algorithms tested were straight “device mapping” in which monitor blue mapped to printer blue, monitor red to printer red, etc.; nearest-point clipping in colorimetric space; centroid clipping; a tetrahedron mapping technique based on a color naming experiment; and the modified device mapping using 100% UCR. Results depended heavily on image content, but the modified device mapping gave favorable results for most images tested. Nearest-point clipping and tetrahedron mapping also showed promise.
Color-Naming Experiment Often times, it is more important to preserve the conceptual information in a document than the actual colorimetry. Specifically, if a graphic designer chooses a light blue for his image, he likely wants to reproduce that color as a light blue. He is less concerned about whether the CIELAB values of the color are reproduced accurately. Recent work by Motomura et al.4,5 has explored ways of corresponding color names between media for gamut mapping and color appearance. An experiment was designed that gave observers a choice of many printed patches on the gamut surface and slightly inside, and asked them to choose which patch most closely represented each of the following adjective/color descriptions.
Keywords: gamut-mapping, color reproduction, business graphics, psychophysics Introduction Business graphics offer special challenges to the development of gamut-mapping algorithms that pictorials do not. First, they are usually created on a computer display whose gamut is much different and often much larger than that of ordinary printers. Second, colorimetric accuracy is not always as important as differentiation among colors, smoothness of sweeps, and purity of the primaries. Hue preservation (or at least hue-name preservation) and high chroma are also believed to be important. A simple algorithm is to print the inverse of the monitor image values; that is, a pixel of value RGB = (0,255,128) is printed as CMY = 255 - RGB = (255,0,127). While this is a smooth mapping from monitor to printer gamut, the large colorimetric mismatch between monitor and printer primaries can lead to unpleasing results. On the other hand, techniques that work well for pictorial images attempt to maintain detail in images, but may result in desaturated graphics. An experiment was performed to compare two colorimetric gamut-mapping techniques to four variations of device mappings for mapping graphics images. The colorimetric algorithms, nearest-point clipping1 and centroid
Table 1. Descriptors used in color-naming experiment Adjectives vivid, brilliant, strong, deep, moderate Colors blue, purple, red, orange, yellow, green, teal
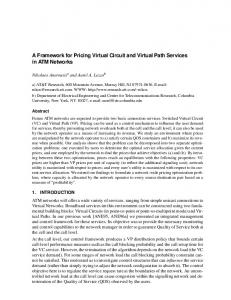
Observers then viewed patches on a monitor along the gamut surface and slightly inside, and similarly chose which patch represented the same names. Nineteen observers performed this experiment. PostScript targets were generated that included the 1152 patch colors shown in Fig. 1. These were displayed on 6 pages (12 patches x 16 patches per page). Each patch was numbered; different codes were given to the monitor and print images. Adobe Acrobat Reader was used to display the monitor images. The PostScript files were also printed on a Xerox 5765 laser printer. They did not include neutrals or very lower chroma colors because these would not fit the descriptions in Table 1 and to limit the number of patches.
1
Table 3. CIELAB mapping vectors obtained for the monitor and printer primaries, from the color naming experiment. L*in a*in b*in L*out a*out b*out 41.76 72.31 56.78 54.61 72.68 66.1 39.82 -70.85 29.89 76.87 -84.03 73.54 10.72 20.73 -35.59 34.06 61.44 -53.09 87.89 -6.77 100.63 95.37 -25.47 90.81 42.58 75.85 6.21 56.25 81.85 21.59 47.38 -30.66 -53.32 40.27 74.16 -94.79 42.14 71.27 54.47 54.46 72.56 70.18 50.28 -52.18 43.69 85.36 -93.21 81.14 46.09 -29.36 -52.21 39.36 75.93 -96.25 87.64 -6.05 99.4 95.63 -26.7 93.98 36.12 49.36 -16.84 64.39 92.14 -54.31 44.39 -50.64 -28.62 90.59 -43.96 -15.09
The results of this experiment may not be valid for other viewing conditions and device gamuts. The goal of the experiment was to explore the possibility of using colornaming pairs to build a gamut-mapping algorithm. Further study needs to determine how to generalize these results. The results of this mapping technique were used in the gamutmapping algorithm called “tetrahedron mapping,” described below.
Figure 1. Digital values displayed on a monitor and printed for the color naming experiment. Neutral colors were not used.
A mapping between these corresponding color names was determined. 665 monitor-to-print mapping vectors were determined by observers (5 adjectives x 7 color names x 19 observers). From these, mapping vectors were determined for the six monitor primaries and for the six printer primaries. A three-dimensional data fitting technique was used to determine these 12 vectors, using a locally linear transform.6 The resulting vectors are based on a weighted distance metric to the 665 original vectors. For example, it was determined where the blue monitor primary should map in printer space based on a weighted average of color-namepairs nearest the blue monitor primary. It was also determined which monitor color should map to the blue printer primary, based on color-name-pairs nearest the blue printer primary. Similarly, all twelve vectors were determined. Tables 2 and 3 shows the input and output vectors in RGB and CIELAB space respectively.
Gamut-Mapping Experiment It was desired to test the quality of the following six algorithms for rendering business graphics. Device mapping The simplest algorithm to implement is referred to here as “device mapping.” This was accomplished by converting the original monitor RGB values to printer CMY values by inverting them: R=1-C, G=1-M, B=1-Y. This was followed by a black addition and under-color removal (UCR) function. The black addition was a parabolic function of input neutral CMY density, and the UCR reduced the C, M, and Y amounts to exactly compensate for the added K along the neutral axis. Finally, this was passed through tone reproduction curves which gray-balanced the C, M, and Y separations, and linearized them to ∆Eab* from paper along the neutral axis. The K separation was separately linearized to ∆Eab* from paper. In looking at the output of this transformation, it was immediately evident that printer blue (C=M=255, Y=0) turned purple. Most printers have a blue that is has a much purpler colorimetric hue than most displays (R=G=0, B=255). This problem was addressed by modifying the device mapping, as described next.
Table 2. RGB mapping vectors obtained for the monitor and printer primaries, from the color naming experiment. Rin Gin Bin Rout Gout Bout 255 0 0 255 1.35 8.58 0 255 0 10.25 219.94 3.86 0 0 255 97.93 -0.01 149.82 255 255 0 255.01 253.16 12.24 255 0 255 267.79 -9.12 84.76 0 255 255 4.98 6.09 255.02 254.06 9.82 40.74 255 0 0 92.85 254.99 16.11 0 255 0 13.49 242.75 250.52 0 0 255 254.25 252.01 17.27 255 255 0 185.07 61.47 255.04 255 0 255 3.02 262.68 185.36 0 255 255
Rotated device mapping In the “rotated device mapping”, the RGB values were processed through a three-dimensional look-up table (LUT) comprising a grid of 3x3x3 nodes in input monitor RGB space. This LUT, referred to in this paper as the 3x3x3 LUT, was designed on informal visual experiments that determined
2
the preferred printed renditions of monitor primary and secondary colors. For example, monitor blue was mapped to point in printer RGB space about halfway between printer blue and printer cyan. Other primary and secondary colors received similar rotations. The look-up table that was used in this experiment was optimized for a Xerox 5765 laser printer, and its table entries are given in Table 4. Figure 2 shows a schematic of the direction and distance that the input monitor colors (shown as circles) were mapped to printer space. Note from Table 4 that monitor yellow (255,255,0) was mapped to printer yellow (255,255,0) and similarly for red.) In general the 3x3x3 LUT will vary depending on the printer used. Table 4. Rotated device mapping with intermediate points. Rin Gin Bin Rout Gout Bout 0 0 0 0 0 0 0 0 128 0 50 128 0 0 255 0 100 255 0 128 0 25 128 0 0 128 128 0 128 96 0 128 255 0 220 255 0 255 0 50 255 0 0 255 128 0 255 70 0 255 255 0 255 192 128 0 0 128 0 0 128 0 128 90 0 128 128 0 255 40 0 255 128 128 0 128 128 0 128 128 128 128 128 128 128 128 255 128 178 255 128 255 0 153 255 0 128 255 128 153 255 128 128 255 255 128 255 224 255 0 0 255 0 0 255 0 128 255 0 200 255 0 255 200 0 255 255 128 0 255 128 0 255 128 128 255 128 128 255 128 255 218 128 255 255 255 0 255 255 0 255 255 128 255 255 128 255 255 255 255 255 255
(255,255,0) (255,128,0) (255,0,0)
(0,255,0)
(0,0,0)
(255,0,128)
(255,0,255)
(0,255,255)
(0,0,255)
Figure 2. Schematic of 3-D mappings of monitor RGB primaries and secondaries (circles) to printer RGB space (arrow heads).
Rotated device mapping with 100% UCR The third technique, “rotated + 100%UCR”, was the same as the previous, except that the UCR strategy was changed such that neutral input colors (R=G=B) would be printed only with the K colorant. It was thought that this UCR strategy might give better results for business graphics by rendering neutrals only with K. This is especially true when black text is present. Tetrahedron mapping The final device-type mapping was called “tetrahedron mapping.” In this algorithm, the corresponding monitor and printer primaries were chosen based on the color naming experiment. Tetrahedra were formed by connecting white, black, and adjacent primary CIELAB color for both the monitor and the printer. In monitor space, the values for pure monitor red, magenta, blue, cyan, green, and yellow were used, along with the values that corresponded to the printer primaries and secondaries; that is, the values with the same color description as the printer primaries, according to the analysis of the color-naming experiment. Figure 3(a) shows a simplified top view of a monitor gamut with these twelve values plotted. Each point is connected with its adjacent color and with black and white. These form twelve tetrahedra in color space. The identical process was followed for the printer gamut. A pair of corresponding tetrahedra are extracted from the gamut and shown as a side-view as well (Fig. 3(b)).
device techniques, nearest-point clipping and centroid clipping required colors to be: converted from RGB to CIELAB through the monitor calibration, converted to hue-corrected CIELAB space, gamut mapped – clipped to the surface of the gamut, converted back to CIELAB, then converted to CMYK for printing using the printer characterization.
These steps were folded into a 3-D LUT for speed of implementation. CIELAB is known to be non-uniform with respect to hue, particularly in the blue region of color space.7-11 The hue-correction of CIELAB described by Braun et al.7 was used in these experiments to ensure that the gamut mapping was done in a perceptual space.
Figure 3. Schematic of corresponding tetrahedron in monitor and printer RGB space. (a) “Top view” corresponding perpendicular to neutral axis, and (b) “side view” where coincident line is neutral axis.
Barycentric mapping was applied to map colors from the monitor tetrahedron to the corresponding printer tetrahedron. This mapping resulted in smooth transitions in sweeps and rendition of the primaries and secondaries consistent with the color-naming results. However, large lightness shifts resulted for pairs of tetrahedra where the lightness of the primaries differed greatly (such as blue/cyan and cyan/green), as is the case in Fig. 3(b). Therefore a technique similar to barycentric mapping but with less lightness distortion was used to map each monitor tetrahedron to its corresponding printer tetrahedron.
Psychophysics Five business graphics images were selected for inclusion in this experiment. They included a wide range of content and colors. The original images were the RGB files displayed on a monitor at 9300K. (Note that this corresponds to the conditions under which the color-naming data was collected.) Each RGB image was processed through the six gamut-mapping algorithms described below and printed. They were labeled with randomized codes and evaluated by observers under D50 simulators. Twenty observers were asked to first view and try to remember the monitor image. Once they felt that they could remember the image, they turned to compare the prints on a separate table. This set-up was thought to be indicative of a typical scenario where one might create an original on the monitor, decide he liked it, send it the printer, and evaluate the print without returning to the monitor image. Observers were not allowed to view the original and prints at the same time because of the differing white points. They were, however, allowed to return to the original image to refresh their memory if necessary, but were asked to look at the original for at least 30 seconds before returning to the prints. Observers were instructed to rate how satisfied they were with the quality of each reproduction by giving a score of 1 to 10, where 10 was excellent and 1 was poor.
Nearest-point clipping These device mappings were compared to two algorithms from a pictorial gamut-mapping experiment presented at this conference,3 and shown in Fig. 4. The first of these used colorimetric mapping for all colors within both gamuts, and clipped out-of-gamut pixels to the nearest point on the surface of the printer gamut.1 L*
Nearest-Point mapped color Centroid mapped color
Original color
Results The average and standard deviation of the ratings given by the twenty observers were calculated. The results for the individual images are given in Figs. 5 and 6. Most of the results were clustered around a rating of 5 or 6. Due to the wide mismatch between the viewing conditions and the gamuts, it is not surprising that observers did not give high ratings for the reproduction quality. Unfortunately, that is the current state of graphics reproduction.
C* Figure 4. Nearest-point and centroid clipping techniques.
Centroid clipping The second non-device mapping clipped in the direction of a point on the neutral axis, halfway between the black point and white, as shown in Fig. 4. This is referred to as centroid clipping.2 Unlike the four previously described
4
Energy Efficiency
8
Rainbow Flowchart Pencil Color Match
7
average
6
The tetrahedron mapping showed promise, and it is believed that the algorithm for obtaining the data is a useful one. The technique failed for one image, which had many pastel hue sweeps. Perhaps the transition from one tetrahedron to the next was not smooth, as an implementation error and not a fundamental problem with the technique. Energy Efficiency
3
5
Rainbow Flowchart Pencil Color Match
4
2.5
average
Table 5. Average ratings of the 6 gamut-mapping algorithms for all five scenes, and their corresponding standard deviations. Algorithm Average Std. Dev. Nearest-point clip 5.85 0.724 Rotated device 5.80 0.836 Tetrahedron 5.43 1.018 Centroid clip 5.28 1.052 Rotated + 100%UCR 5.28 0.945 Device 4.79 0.773
The nearest-point clipping algorithm and the rotated device mapping were favored overall, and performed consistently well over many of the images in this study. The nearest-point clipping did, however, receive the worst score in one image, but was not much worse than any other algorithm for that image. The consistency of these two algorithms is further evidenced by the relatively low standard deviations seen in Fig. 6. The use of the 100% UCR strategy with the rotated mapping suffered from a reduced dynamic range due to the fact that black was rendered with only K, rather than CMYK. The straight device mapping performed worst overall, and received the 5th or 6th lowest rank for all but one image. Its poor performance was mainly due to the “blue-to-purple” problem described earlier. Centroid clipping performed worse than nearest-point clipping mainly because it produced lower chroma reproductions, as shown in Fig. 4. This attribute of centroid clipping reduces the occurrence of many input colors mapping to one output color and performs well for pictorial images.
De vic e
Ce ntr oid
1
Te tra he dr on
The average and standard deviation of the observer ratings were calculated, and are shown in Table 5.
1.5
Ne ar es t-P oin Ro t tat ed + 10 0%
Figure 5. The average ratings for the 6 gamut-mapping algorithms for all five scenes.
2
Ro tat ed
De vic e
Ce ntr oid
Te tra he dr on
Ne ar es t-P oin Ro t tat ed + 10 0%
Ro tat ed
3
Fig. 6. Standard deviation of observer ratings for the 6 gamutmapping algorithms for all five scenes.
Conclusions Several gamut mapping algorithms were described for rendering computer-generated graphics images. A technique for collecting color-name mapping data was described, and used to obtain one of the mappings between monitor and print. A gamut-mapping technique that mapped monitor primaries to rotated printer primaries, so-called “rotated device mapping,” was chosen as the best algorithm. This transformation depends on the particular devices in question, and may also depend on the white points and other viewing conditions. Extensions to this technique are currently under investigation, including automatic determination of the monitor-to-printer transformation based on user preference and information about the output device gamut, and incorporation of more mapping points than just the primaries and secondaries. Nearest-point clipping and tetrahedron mapping also performed well in this study. Nearest-point clipping is more computationally intensive (conversion to and from CIELAB) than the device mappings. It can also result in “flattening” of sweeps or loss in texture for colors near the edges of the gamut. The tetrahedron mapping showed promise, but had definite failure modes. It will be further optimized in future
work to determine the optimal mapping from monitor to printer tetrahedra.. Device mapping is a poor choice for mapping graphics due to its drastic alteration of color name and CIELAB hue for many conventional printers. The color-naming data collection technique will be further analyzed and may be applied for pairs of colors rather than isolated colors. The context of the color (text, patches, sweeps; object size; etc.) plays an important role in its optimum reproduction and this may lead to better results.
9.
F. Ebner and M.D. Fairchild, Finding Constant Hue Surfaces in Color Space, Proceedings of SPIE, Color Imaging: Device-Independent Color, Color Hardcopy, and Graphic Arts III, 3300-16, 107-117 (1998). 10. G. Marcu, Gamut Mapping in Munsell Constant Hue Sections, Proc. of IS&T/SID 6th Color Imaging Conference, Scottsdale, pp. 159-162 (1998). 11. J.J. McCann, Color Gamut Measurements and Mappings: The Role of Color Spaces, IS&T/SPIE Electronic Imaging '99, Color Imaging: Device Independent Color, Color Hardcopy, and Graphic Arts IV, San Jose, pp. 68-82 (1999).
References 1.
2.
3.
4.
5.
6.
7.
8.
Biography
R. S. Gentile, E. Walowit, and J. P. Allebach, A Comparison of Techniques for Color Gamut Mismatch Compensation, SPSE/SPIE Symposium on Electronic Imaging, Jan. 15-20, 1989, Los Angeles, pp. 176-81. E.G. Pariser, An Investigation of Color Gamut Reduction Techniques, IS&T 2nd Symposium on Electronic Publishing, pp. 105-107, 1991. K. Braun, R. Balasubramanian, and R. Eschbach, Development and Evaluation of Six Gamut-Mapping Algorithms for Pictorial Images, Proc. of the IS&T/SID 7th Color Imaging Conference, Scottsdale, 1999. H. Motomura, O. Yamada, and T. Fumoto, Categorical Color Mapping for Gamut Mapping, Proc. of the IS&T/SID 6th Color Imaging Conference, Scottsdale, pp. 50-55, 1998. H. Motomura, Categorical Color Mapping for Gamut Mapping II – Using Block Average Image, Proc. of the SPIE/IS&T Color Imaging: Device-Independent Color, Color Hardcopy, and Graphic Arts IV, San Jose, pp. 108-119, 1999. R. Balasubramanian, Refinement of Printer Transformations using Weighted Regression, Proc. SPIE 2658, pp. 334-340, 1996. G.J. Braun, F. Ebner, and M.D. Fairchild, Color Gamut Mapping in a Hue-Linearized CIELAB Color Space, Proc. of IS&T/SID 6th Color Imaging Conference, Scottsdale, pp. 163-168 (1998). P. Hung and R.S. Berns, Determination of Constant Hue Loci for a CRT Gamut and Their Predictions Using Color Appearance Spaces, Color Res. and Appl., 20, 285-295 (1995).
Karen Braun received her B.S. degree in Physics from Canisius College in 1991 and her Ph.D. in Imaging Science from Rochester Institute of Technology in 1996. Since then, she has worked in the Digital Imaging Technology Center at Xerox Corporation in Webster, NY. Her work primarily focuses on gamut mapping, color reproduction, and color perception. She is a member of the IS&T and Inter-Society Color Council. Raja Balasubramanian received the B.S. degree from the University of Texas at Arlington in 1987, and the M.S. and Ph.D. degrees from Purdue University in 1988 and 1992, respectively, all in Electrical Engineering. Since then, he has been employed at Xerox Corporation in the Digital Imaging Technology Center, where he currently leads a project involved with color device characterization and color management. He is a member of IS&T. Steven Harrington received BS degrees in Physics and Mathematics in 1968 from Oregon State University. He received a Ph.D. in physics and MS degree in computer science from the University of Washington in 1976. After a two year post-doctoral position at the University of Utah he taught computer science at the State University of New York for three years. In 1981 he joined Xerox Corporation. Dr. Harrington has written two books and numerous technical articles, and holds 36 patents. He is currently a Xerox Fellow working in the Digital Imaging Technology Center.
6