REPORTS
Gated Visual Input to the Central Auditory System Yoram Gutfreund,* Weimin Zheng,† Eric I. Knudsen The central auditory system translates sound localization cues into a map of space guided, in part, by visual experience. In barn owls, this process takes place in the external nucleus of the inferior colliculus (ICX ). However, to date, no trace of visual activity has been observed in this auditory nucleus. Here we show that strong visual responses, which are appropriate to guide auditory plasticity, appear in the ICX when inhibition is blocked in the optic tectum. Thus, visual spatial information is gated into the auditory system by an inhibitory mechanism that operates at a higher level in the brain. The auditory system synthesizes a map of space in the midbrain that acts to orient an animal’s gaze toward interesting auditory stimuli (1, 2). This space map requires that representations of sound localization cues, such as interaural time difference (ITD) and interaural level difference (ILD), be transformed into an accurate, topographic representation of space. In the barn owl, the auditory map is created in the ICX and transmitted to the optic tectum (OT), where it aligns with a visual map of space (3) (Fig. 1A). The OT provides a signal that instructs the representation of auditory localization cues in the ICX. A pathway projects topographically from the OT to the ICX (4, 5), and interruption of this pathway eliminates visually driven auditory plasticity in the ICX (6). Although the instructive signal depends on visual input (7–9), the exact nature of the signal is not known. The simplest hypothesis is that the OT provides the ICX with a topographic representation of visual space that acts as a template for instructing the tuning of ICX neurons to appropriate values of sound localization cues. Extensive extracellular recordings have failed, however, to detect any visually driven activity in the ICX, even when visual stimuli were presented together with auditory stimuli. This raises the question of how visual activity could instruct plasticity in this auditory nucleus. One hypothesis is that visual signals from the OT to the ICX are gated. In theory, the gating of visual activity could be accomplished by ␥-aminobutyric acid (GABA)– mediated inhibition in the OT, which is rich in GABAergic receptors (10) and receives several major GABAergic afferents (11, 12). To test this hypothesis we blocked focally GABAergic inhibition in the OT while lookDepartment of Neurobiology, Stanford University School of Medicine, Stanford, CA 94305, USA. *To whom correspondence should be addressed. Email:
[email protected] †Present address: The Neurosciences Institute, San Diego, CA 92121, USA.
1556
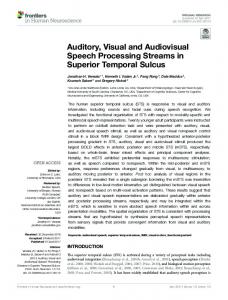
ing for visual activity in the ICX (13). Iontophoretic application of bicuculline methiodide was used to block inhibition in the OT (Fig. 1). Electrodes were positioned at matched locations in the auditory space maps in the OT and ICX (Fig. 1, B and C). The visual receptive field (RF) for the OT site was assessed and a light-emitting diode (LED) was positioned in the center of the visual RF. A light flash was presented every 5 s while
multiunit activity was recorded simultaneously in the OT and ICX. Before bicuculline was applied in the OT, visual responses were observed in the OT but not in the ICX (Fig. 1, D and E). After about 6 min of drug application, however, clear visual responses began to appear in the ICX (Fig. 1E). Approximately 5 min after drug application was stopped, visual responses in the ICX disappeared. The delay between onset of bicuculline iontophoresis and the appearance of a response to the visual stimulus ranged from 1.8 to 6 min (n ⫽ 6). This range rules out the possibility that the effect is due to current injection and suggests that bicuculline must defuse to act at a particular site in the OT space map in order to produce the effect. The visual activity in the ICX that appeared when inhibition in the OT was blocked exhibited restricted RFs. At the site shown in Fig. 2A, the strongest visual response was evoked when the LED was located 12° left of and 5° below the owl’s center of gaze. The site failed to respond (P ⬎ 0.01; Student’s t test) when the LED was located 5° left, right, above, or 10° below this position. Thus, the visual RF was smaller than 10° in
Fig. 1. Visually driven activity in the ICX revealed by blocking inhibition in the OT. (A) Diagram of the flow of information between the ICX and the OT. (B) Diagram of a horizontal section through the optic lobe, showing the central nucleus of the inferior colliculus (ICC), the ICX, and the OT. Ovals indicate horizontal locations in the space maps. Approximate electrode positions in the ICX (R, recording) and the OT (R⫹I, recording and iontophoresis) are indicated. (C) Horizontal section through the optic lobe shows electrolytic lesions that were made at recording sites in the ICX (R) and OT (R⫹I). (D and E) Multiunit responses to a light flash (50 ms duration, indicated by bars on the bottom) in the OT (D), and ICX (E), before, during, and after bicuculline application in the OT. Each dot indicates the occurrence of a spike. The gray area indicates the period of bicuculline iontophoresis.
30 AUGUST 2002 VOL 297 SCIENCE www.sciencemag.org
REPORTS the horizontal dimension and smaller than 15° in the vertical dimension. The largest visual RF measured in the ICX (n ⫽ 13 sites) was smaller than 15° wide and 20° high. The visual RFs in the ICX were similar in size to those in the OT (3). The limited size of the visual RFs could have been an artifact of the localized disinhibition caused by bicuculline iontophoresis. It is possible that every point in the ICX receives visual input from a large portion of the OT space map, but because only a small portion of the OT map was disinhibited, vi-
sual responses in the ICX appeared to be spatially restricted. We thus moved the ICX electrode dorsoventrally to sites having different ILD tuning (Fig. 2B) and, therefore, different auditory RFs (2). The position of the iontophoretic electrode in the OT and the location of the visual stimulus remained unchanged. If ICX sites had received input from a large region of the OT space map, then visual responses should have been observed across a similarly large portion of the ICX. Instead, visual responses in the ICX were observed only within a small portion of the
Fig. 2. Visual receptive fields in the ICX. (A) Each histogram represents responses to 50 light flashes (indicated by scale bar). Measurements were repeated with the LED positioned at eight different locations separated by 5°. (B) Responses to 50 light flashes with the LED located in the visual RF of the OT site, measured at five sites along a dorsoventral penetration through the ICX. Electrode depth is given relative to the depth where the strongest visual response was recorded. Best ILD is given in dB for each site. (C) Summary of results obtained from 11 dorsoventral penetrations. For each recording site, a one-tailed t test was performed to assess whether the visual responses (defined as the number of spikes in the 70- to 150-ms period after the onset of the light stimulus) were significantly larger (P ⬍ 0.01) than the baseline (defined as the number of spikes in the 80 ms before the stimulus). The graph shows the number of recording sites at which significant responses were recorded at each depth. Depth is given relative to the depth where the strongest visual response was recorded.
ICX (Fig. 2B): visual responses were diminished sharply 150 m away from the site that responded best to the visual stimulus and were rarely measurable 300 m away (Fig. 2C). Thus, the projection of information from the OT to the ICX is precise, and visual responses in the ICX, like auditory responses, have spatially restricted RFs. The locations of visual RFs recorded in the ICX corresponded with the locations of auditory RFs measured at individual sites. Auditory RFs were quantified as the region of space within which a noise burst generated by a loudspeaker evoked a response that was greater than 50% of the site’s maximal response (auditory best area). Auditory best areas overlapped with, and covaried with, visual RFs (13) (Fig. 3A). Consistent with this covariation of spatial tuning, visual RF location also predicted tuning for ITD, the primary cue used to derive the horizontal location of a sound source (2) (Fig. 3B). Thus, visual RFs in the ICX form a map of space that is aligned with and, therefore, predicts the auditory space map. The auditory space map in the ICX is calibrated by experience with bimodal, auditory-visual stimuli (8). Therefore, it is of interest to examine how the visual responses that appear in the ICX when inhibition is blocked in the OT interact with auditory responses. Light pulses from the LED were combined with noise bursts presented through earphones so that ITD could be manipulated systematically (13). For the site shown in Fig. 4, A to G, the visual RF was located 17° to the left, which corresponds to an ITD of – 42 s (negative values indicate left-ear-leading) (14). The visual stimulus was presented from the center of the site’s visual RF. Simultaneous sound and light stimuli resulted in distinct auditory and visual responses in the ICX that were separated by up to 50 ms, because of the longer latency for visual versus auditory responses (compare Fig. 4, A and C). The visual response, observed 80 to140 ms after stimulus onset (Fig. 4, C and D), was reduced dramatically when
Fig. 3. Alignment of visual and auditory receptive fields in ICX. (A) The ellipses indicate the locations of six visual RFs measured in the ICX from three different owls. The horizontal auditory best areas at the same sites are indicated by the gray bars. The centers of the auditory best areas are indicated by the Xs. (B) Best ITD is plotted versus the horizontal center of the visual RF. The solid line indicates the linear regression (r 2 ⫽ 0.984).
www.sciencemag.org SCIENCE VOL 297 30 AUGUST 2002
1557
REPORTS Fig. 4. The influence of auditory stimuli on visual responses in the ICX. (A and B) Response of an ICX site to an auditory stimulus as a function of ITD; negative values indicate leftear-leading. (C and D) Responses at the same site to light flashes. (E and F) Responses to the simultaneous presentation of auditory and visual stimuli. [(A), (C), and (E)] Multiunit recording; [(B), (D), and (F)] single-unit recording. The single unit was isolated from the same site (13). The arrows indicate the ITD value corresponding with the location of the visual RF. (G) Subtraction of the response to the auditory stimulus alone (A) from the response to the combined auditoryvisual stimulus (E). Subtraction was performed for each ITD in 10-ms time bins. The result was smoothed with a 3 by 3 point running average. Red represents 30 spikes; dark blue represents –5 spikes. (H) The average normalized difference between the response to the auditory-visual stimulus and the response to the auditory stimulus alone
the ITD of the accompanying sound approached the ITD predicted by the visual RF (Fig. 4, E and F; arrow). This effect of the auditory stimulus on visual responses (Fig. 4G) was revealed by subtracting responses to the auditory stimulus alone (Fig. 4, A and B) from responses to the combined, auditory-visual stimulus (Fig. 4, E and F). A summary of this analysis, averaged across all ICX sites (n ⫽ 18), is shown in Fig. 4H. The results demonstrate a consistent reduction in visually driven responses when the ITD of the auditory stimulus was near the ITD value corresponding with the location of the visual stimulus. Thus, the visual activity in the ICX that results from a bimodal stimulus encodes the mismatch between the spatial representations of auditory and visual stimuli. This study shows that visual responses appear in the ICX when GABAergic inhibition in the OT is blocked. We suggest that the purpose of this intrusion of visual activity into the auditory system is to adjust the representation of auditory localization cues in the map of space. The visual signal in the ICX has all of the characteristics expected of the instructive signal (6, 9, 15): it is mediated by the OT; it is topographic; and it predicts
1558
(AV-A), for the time window 80 to 140 ms after stimulus onset, plotted versus the ITD of the sound relative to the best ITD of the site. The arrow indicates the ITD value corresponding with the mean position of the light. Error bars indicate standard error.
auditory spatial tuning. Moreover, the effect of synchronized auditory and visual stimuli on visual responses in the ICX suggests how this visual activity could act selectively as an instructive signal: Visual activity does not excite ICX neurons if they have been activated strongly by an auditory stimulus in the immediate past, perhaps due to response adaptation. As a result, the visual activity arising from a bimodal stimulus does not interfere with auditory processing as long as sound localization cues are represented correctly in the space map. On the other hand, if the visual and auditory maps in the ICX are misaligned, visual activity from bimodal stimuli will excite ICX neurons strongly. This excitation could cause strengthening of auditory inputs that were active in the recent past and thereby adjust the representation of auditory localization cues in the ICX to match the visual representation of space. An intriguing finding is that visual activity in the ICX, with the properties of an instructive signal, is gated by an inhibitory network in the OT. Teaching signals in other systems (16, 17 ) are inhibited under circumstances when learning is not required. Gating of instructive signals may be a fundamental tactic used by the central
nervous system to ensure that learning is adaptive and efficient (18). The gating of visual activity to the ICX prevents visual signals from constantly accessing this auditory nucleus. If the function of the visual activity in the ICX is indeed to adjust the representation of auditory localization cues, then visual activity is useful only when it occurs simultaneously with auditory activity and both activities represent a common source. Thus, only visual activation that is associated with a salient auditory stimulus should be permitted through the gate. The fact that in anesthetized owls visual signals are normally gated off even when auditory and visual stimuli are presented simultaneously suggests that cognitive and/or attentional processes may control the gate. References and Notes
1. A. J. King, Bioessays 21, 900 (1999). 2. J. F. Olsen, E. I. Knudsen, S. D. Esterly, J. Neurosci. 9, 2591 (1989). 3. E. I. Knudsen, J. Neurosci. 2, 1177 (1982). 4. H. Luksch, B. Gauger, H. Wagner, J. Neurosci. 20, RC70 (2000). 5. P. S. Hyde, E. I. Knudsen, J. Comp. Neurol. 421, 146 (2000). 6. P. S. Hyde, E. I. Knudsen, Nature 415, 73 (2002). 7. A. J. King, S. Carlile, Exp. Brain. Res. 94, 444 (1993). 8. E. I. Knudsen, M. S. Brainard, Science 253, 85 (1991). 9. M. S. Brainard, E. I. Knudsen, J. Neurosci. 13, 4589 (1993).
30 AUGUST 2002 VOL 297 SCIENCE www.sciencemag.org
REPORTS 10. C. L. Veenman, R. L. Albin, E. K. Richfield, A. Reiner, J. Comp. Neurol. 344, 161 (1994). 11. D. Felix, G. Y. Wu, S. R. Wang, Neurosci. Lett. 169, 212 (1994). 12. O. Hikosaka, Y. Takikawa, R. Kawagoe, Physiol. Rev. 80, 953 (2000). 13. Materials and methods are available as supporting material in Science Online. 14. The relationship between locations in space and ITD values has been measured in a large number of owls and is, on average, 2.5 s per degree of azimuth (19).
15. P. S. Hyde, E. I. Knudsen, J. Neurosci. 21, 8586 (2001). 16. P. Waelti, A. Dickinson, W. Schultz, Nature 412, 43 (2001). 17. J. J. Kim, D. J. Krupa, R. F. Thompson, Science 279, 570 (1998). 18. W. Schultz, A. Dickinson, Annu. Rev. Neurosci. 23, 473 (2000). 19. E. I. Knudsen, S. D. Esterly, S. du Lac, J. Neurosci. 11, 1727 (1991). 20. We thank L. Sugrue and B. Linkenhoker for critical reading of this manuscript. This work was supported
Medulloblastoma Growth Inhibition by Hedgehog Pathway Blockade David M. Berman,1,2,5* Sunil S. Karhadkar,1,2,5* Andrew R. Hallahan,6,7 Joel I. Pritchard,7 Charles G. Eberhart,2 D. Neil Watkins,4 James K. Chen,1,5 Michael K. Cooper,1,3,5 Jussi Taipale,1,5 James M. Olson,6,7† Philip A. Beachy1,5† Constitutive Hedgehog (Hh) pathway activity is associated with initiation of neoplasia, but its role in the continued growth of established tumors is unclear. Here, we investigate the therapeutic efficacy of the Hh pathway antagonist cyclopamine in preclinical models of medulloblastoma, the most common malignant brain tumor in children. Cyclopamine treatment of murine medulloblastoma cells blocked proliferation in vitro and induced changes in gene expression consistent with initiation of neuronal differentiation and loss of neuronal stem cell–like character. This compound also caused regression of murine tumor allografts in vivo and induced rapid death of cells from freshly resected human medulloblastomas, but not from other brain tumors, thus establishing a specific role for Hh pathway activity in medulloblastoma growth. Signaling by the Hh family of secreted proteins was implicated initially in determination of embryonic cell fate, and more recently in maintenance of somatic stem cells and in specification of organ size. The latter role is illustrated in the developing cerebellum, where Hh signaling delays neuronal differentiation and induces proliferation of cerebellar granular neuronal precursors (CGNPs) (1–4). Medulloblastomas, which are aggressive childhood tumors of cerebellar origin, are associated with inappropriate Hh pathway activity (5–8). The activation of this pathway normally requires antagonism of the 12-transmembrane protein Patched (Ptch) by Hh ligand, thus releasing the seven-transmembrane protein Smoothened (Smo) for activation of target genes by the Cubitus interruptus/Gli (Ci/Gli) family of transcription factors (9–11). Departments of 1Molecular Biology and Genetics, 2 Pathology, 3Neurology, 4Oncology, and 5Howard Hughes Medical Institute, Johns Hopkins University School of Medicine, Baltimore, MD 21205, USA. 6 Clinical Research Division, Fred Hutchinson Cancer Research Center, and 7Division of Pediatric Oncology, University of Washington/Children’s Hospital, Seattle WA 98105, USA. *These authors contributed equally to this work. †To whom correspondence should be addressed. Email:
[email protected] ( J.M.O.) and pbeachy@ jhmi.edu (P.A.B.)
Ligand-independent pathway activity in medulloblastoma is caused either by mutations that render Smo insensitive to regulation by Ptch or by mutational inactivation of Ptch. The transcription of Ptch is induced by Hh pathway activity, thus generating a negative feedback loop and serving as a convenient indicator of pathway activation. We studied Hh pathway activity and function in cerebellar tumors from mice carrying a single mutant allele of the Ptch gene (Ptch⫹/–) (5). Wild-type Ptch mRNA expression was never detected in pure tumor tissue, indicating a lack of functional Ptch gene product that should result in Hh pathway activation (see supporting online material, fig. S1). The frequency of medulloblastomas in Ptch⫹/– mice was increased by a p53 mutant background (12); loss of p53 function also enabled propagation of these tumors in athymic mice as subcutaneous allografts that displayed diagnostic features of human medulloblastoma (Fig. 1, A and B; fig. S2) (13). From four such allografts independently originating in Ptch⫹/– mice, cultured cell lines were derived that lacked p53 function (Fig. 1C), retained a Ptch⫹/– genotype (Fig. 1C), and displayed elevated levels of Hh pathway activity (see below). Treatment with the DNA demethylating agent 5-azacytidine (5-
by grants from the March of Dimes and from the NIH (NIDCD DC 00155-2). Y.G. was supported by a longterm fellowship from the Human Frontier Science Program. Supporting Online Material www.sciencemag.org/cgi/content/full/297/5586/1556/ DC1 Materials and Methods 8 May 2002; accepted 25 July 2002
azaC) restored Ptch mRNA expression in each cell line (Fig. 1D) and dramatically reduced activity from the Ptch-LacZ reporter (Fig. 1E). As the LacZ gene disrupts the targeted Ptch allele, thereby reporting Ptch transcription, the observed decrease in -galactosidase levels indicates a reduction in pathway activity (5, 14). We confirmed the specificity of this effect by stably transfecting cells to express high levels of Gli1, which activates the Hh pathway downstream of Ptch. In such cells, 5-azaC did not block Hh pathway activity (Fig. 1E), despite restoration of Ptch mRNA expression (15). These results indicate that silencing by DNA methylation of the functional Ptch allele is the precipitating event in pathway activation and tumor initiation in these animals. To test the role of Hh pathway activity in tumor growth, we used cyclopamine, a plantderived pathway antagonist that acts at the level of Smo (14). Medulloblastoma-derived cell lines were cultured with cyclopamine or with tomatidine, another steroidal alkaloid with little effect on the Hh pathway (16). By 72 hours, cyclopamine treatment resulted in a 60 to 80% reduction in growth relative to tomatidine in cultures of all tumor-derived cell lines, whereas growth of fibroblast control cells was unaffected (Fig. 2A). Cyclopamine also completely and specifically abolished -galactosidase activity in all murine medulloblastoma lines (Fig. 2B), demonstrating that the effect of cyclopamine on cell growth parallels the reduction in Hh pathway activity. The effect of cyclopamine treatment on murine medulloblastoma cell growth is largely mediated by inhibition of cell proliferation, because culture of the PZp53MED1 allograft line with cyclopamine reduced DNA synthesis by 90%, as compared to tomatidine-treated cells (Fig. 2C), with only low levels of apoptosis (less than 1% of cells) (15). This effect depends on specific pathway inhibition, because PZp53MED1 cells engineered to overexpress Gli1 retained high levels of -galactosidase activity (15) and cell growth (fig. S3A) upon treatment with cyclopamine. To determine the effect of Hh pathway inhibition on cellular pathways that regulate proliferation or differentiation, we examined the expression of cell cycle components and cerebellar neuronal differentiation markers in control and cyclopamine-treated PZp53MED1 cells. Cyclins D1, D2, E1, and hyperphosphorylated Rb,
www.sciencemag.org SCIENCE VOL 297 30 AUGUST 2002
1559