(Cauchy RBF, Gaussian RBF, etc). Due to ... The radial basis function φi(di(x)) can take different forms, including the Cauchy. RBF (CRBF) or the ..... Verleysen, M., François, D., Simon, G., Wertz, V.: On the effects of dimensionality on data ... Rifkin, R., Califano, A., Stolovitzky, G., Louis, D.N., Mesirov, J.P., Lander, E.S.,. Golub ...
Evolutionary q-Gaussian Radial Basis Functions for Improving Prediction Accuracy of Gene Classification Using Feature Selection Francisco Fern´andez-Navarro1, C´esar Herv´ as-Mart´ınez1, Pedro A. Guti´errez1 , Roberto Ruiz2 , and Jos´e C. Riquelme3 1
Department of Computer Science and Numerical Analysis, University of Cordoba, Rabanales Campus, Albert Einstein building 3 floor, 14071, C´ ordoba, Spain 2 Area of Computer Science, Pablo de Olavide University, School of Engineering, Spain 3 Department of Computer Science, University of Seville, Avda. Reina Mercedes s/n. 41012 Seville, Spain
Abstract. This paper proposes a Radial Basis Function Neural Network (RBFNN) which reproduces different Radial Basis Functions (RBFs) by means of a real parameter q, named q-Gaussian RBFNN. The architecture, weights and node topology are learnt through a Hybrid Algorithm (HA) with the iRprop+ algorithm as the local improvement procedure. In order to test its overall performance, an experimental study with four gene microarray datasets with two classes taken from bioinformatic and biomedical domains is presented. The Fast Correlation–Based Filter (FCBF) was applied in order to identify salient expression genes from thousands of genes in microarray data that can directly contribute to determining the class membership of each pattern. After different gene subsets were obtained, the proposed methodology was performed using the selected gene subsets as the new input variables. The results confirm that the q-Gaussian RBFNN classifier leads to promising improvement on accuracy.
1
Introduction
The importance of the use of Artificial Neural Networks (ANNs) in the classification of microarray gene expression as an alternative to other techniques was stated in serveral research works [1,2] due to their flexibility and high degree of accuracy to fit to experimental data. In this work, we focus on Radial Basis Function Neural Networks (RBFNNs) which have been succesfully employed in different pattern recognition problems including the classification of microarray gene [2]. In high-dimensional space, the distances to the nearest and furthest neighbours look nearly identical. Therefore, in this kind of problem, the distances are concentrated and the Gaussian kernel looses its interpretation in terms of locality around its centre [3]. For that reason, we propose a novelty RBF based on K. Diamantaras, W. Duch, L.S. Iliadis (Eds.): ICANN 2010, Part I, LNCS 6352, pp. 327–336, 2010. Springer-Verlag Berlin Heidelberg 2010
328
F. Fern´ andez-Navarro et al.
the q-Gaussian Distribution which parametrize the standard Normal distribution by replacing the exponential expressions for q-exponential expressions, and maximizing Tsallis entropy [4] under certain constraints [5]. This novelty basis function incorporates a real parameter q (besides the centers and width of the RBF) which can relax or contract the shape of the kernel. This basis function matches better the shape of the kernel and the distribution of the distances, since the modification of the q parameter allows representing different basis functions (Cauchy RBF, Gaussian RBF, etc). Due to severe ill-conditioning of the coefficient matrix of the q-Gaussian RBF, a Hybrid Evolutionary Algorithm (HEA) based on heuristics is employed to select the parameters of the model. The motivation for applying feature selection (FS) techniques has shifted from being an optional subject to becoming a real prerequisite for model building. The main reason is the high–dimensional nature of many modelling task in this field. A typical microarray dataset may contain thousands of genes but only a small number of samples (often less than two hundred). Based on the generation procedure, FS can be divided into individual feature ranking (FR) and feature subset selection (FSS). FR measures the feature-class relevance, then rank features by their scores and select the top–ranked ones. In contrast, FSS attempts to find a set of features with good performance. Hybrid models were proposed to handle large datasets to take advantage of the above two approaches (FR, FSS). In this work, the relevant features were obtained by the Fast Correlation–Based Filter (FCBF), a hybrid approach proposed in [6]. One of the major advantages of the proposed method is the reduced number of features and q-Gaussian RBFs included in the final expression, since the HEA reduces its complexity by pruning connections and removing hidden nodes. Therefore, using the proposed approach, the feature selection is performed in two stages: Firstly, in the preprocessing by means of the features selector and secondly, in the HEA by pruning connections. This paper is organized as follows: Section 2 formally presents the q-Gaussian RBF model considered in this work and the main characteristics of the algorithm used for training the model. Section 3 introduces the feature selection algorithm used in this paper. Section 4 describes the experiments carried out and discusses the results obtained. Finally, Section 5 completes the paper with the main conclusions and future directions suggested by this study.
2 2.1
Classification Method Related Works
A RBFNN is a three-layer feed-forward neural network. Let the number of nodes of the input layer, of the hidden layer and of the output layer be p, m and 1 respectively. For any sample x = [x1 , x2 , . . . , xp ], the output of the RBFNN is f (x). The model of a RBFNN can be described with the following equation: f (x) = β0 +
m � i=1
βi · φi (di (x))
(1)
Evolutionary q-Gaussian RBFs for Improving Prediction Accuracy
329
where φi (di (x)) is a non-linear mapping from the input layer to the hidden layer, β = (β1 , β2 , . . . , βm ) is the connection weight between the hidden layer and the output layer, and β0 is the bias. The function di (x) can be defined as: di (x) =
�x − ci �2 θi2
(2)
where θi is the scalar parameter that defines the width for the i-th radial unit, �.� represents the Euclidean norm and ci = [c1 , c2 , . . . , cp ] the center of the RBFs. The standard RBF (SRBF) is the Gaussian function, which is given by: φi (di (x)) = e−di (x) ,
(3)
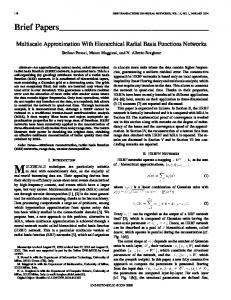
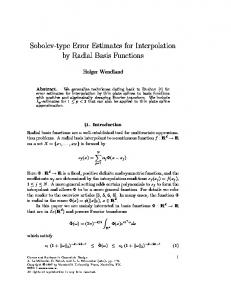
The radial basis function φi (di (x)) can take different forms, including the Cauchy RBF (CRBF) or the Inverse Multiquadratic RBF (IMRBF). Fig. 1a ilustrates the influence of the choice of the RBF in the hidden unit activation. One can observe that the Gaussian function presents a higher activation close to the radial unit center than the other two RBFs. In this paper, we propose the use of the q-Gaussian function as RBF. This basis function is obtained by replacing the exponential expression of the SRBF for a q-exponential expression [5]. The q-Gaussian can be defined as: � 1 (1 − (1 − q)di (x)) 1−q if (1 − (1 − q)di (x)) ≥ 0 (4) φi (di (x)) = 0 Otherwise. The q-Gaussian can reproduce different RBFs for different values of the real parameter q. As an example, when the q parameter is close to 2, the q-Gaussian is the CRBF, for q = 3, the activation of a radial unit with an IMRBF for di (x) turns out to be equal to the activation of a radial unit with a q-Gaussian RBF for di (x)/2 and, finally, when the value of q converges to 1, the q-Gaussian converges to the Gaussian function (SRBF). Fig. 1b presents the radial unit activation for the q-Gaussian RBF for different values of q. 2.2
q-Gaussian RBF for Classification
To construct a probabilistic classification model, we consider a RBFNNs with softmax outputs and the standard structure: an input layer with a node for every input variable; a hidden layer with several RBFs; and an output layer with 1 node. There are no connections between the nodes of a layer and none between the input and output layers either. The activation function of the i-th node in the hidden layer (φi (di (x))) is given by Eq. 4 and the activation function of the output node (f (x)) is defined in Eq 1. The transfer function of all output nodes is the identity function. In this work, the outputs of the neurons are interpreted from the point of view of probability through the use of the softmax activation function. g(x) =
exp f (x) 1 + exp f (x)
(5)
330
F. Fern´ andez-Navarro et al. 1
1 RBFs SRBF CRBF IMRBF
0.9
q-Values q=0.25 q=0.75 q=1.00 q=1.50 q=2.00 q=3.00 q=4.00
0.9
0.8
0.8
0.7
0.7
0.6
0.6
0.5
0.5
0.4
0.4
0.3
0.3
0.2
0.2
0.1
0.1 0
0 -4
-3
-2
-1
0
1
2
3
4
-4
-3
(a)
-2
-1
0
1
2
3
4
(b)
Fig. 1. Radial unit activation in one-dimensional space with c = 0 and θ = 1 for different RBFs: (a) SBRF, CRBF and IMRBF and (b) q-Gaussian with different values of q
where g(x) is the probability that a pattern x belongs to class 1. The probability a pattern x has of belonging to class 2 is 1 − g(x). The error surface associated with the model is very convoluted. Thus, the parameters of the RBFNNs are estimated by means of a HEA (detailed in Section 2.3). The HEA was developed to optimize the error function given by the negative log-likelihood for N observations, which is defined for a classifier g: N 1 � [−yn f (xn ) + log exp f (xn )] l(g) = N n=1
(6)
where yn is the class that the pattern n belongs to. 2.3
Hybrid Evolutionary Algorithm
The basic framework of the HEA is the following: the search begins with an initial population of RBFNNs and, in each iteration, the population is updated using a population-update algorithm which evolves both its structure and weights. The population is subject to operations of replication and mutation. We consider l(g) as the error function of an individual of the population. The fitness measure needed for evaluating the individuals is a strictly decreasing transformation of 1 , where 0 < A(g) ≤ 1. Figure 2 the error function l(g) given by A(g) = 1+l(g) describes the procedure to select the parameters of the radial units. The main characteristics of the algorithm are the following: 1. Initialization of the Population. First, 5, 000 random RBFNNs are generated. The centers of the radial units are firstly defined by the k-means algorithm for different values of k, where k ∈ [Mmin , Mmax ], being Mmin and Mmax the minimum and maximum number of hidden nodes allowed for any RBFNN model. The widths of the RBFNNs are initialized to the geometric mean of
Evolutionary q-Gaussian RBFs for Improving Prediction Accuracy
331
1: Hybrid Algorithm: 2: Generate a random population of size N 3: repeat 4: Calculate the fitness of every individual in the population 5: Rank the individuals with respect to their fitness 6: The best individual is copied into the new population 7: The best 10% of population individuals are replicated and they substitute the worst 10% of individuals 8: Apply parametric mutation to the best (pm )% of individuals 9: Apply structural mutation to the remaining (100 − pm )% of individuals 10: until the stopping criterion is fulfilled 11: Apply iRprop+ to the best solution obtained by the EA in the last generation. Fig. 2. Hybrid Algorithm (HA) framework
the distance to the two nearest neighbours and the q parameter to values near to 1, since when q → 1 the q-Gaussian reduces to the standard Gaussian RBFNN. A random value in the [−I, I] interval is assigned for the weights between the hidden layer and the output layer. Finally, the initial population is obtained by selecting the best 500 RBFNNs. 2. Parametric and Structural Mutations. Parametric mutation consists of a simulated annealing algorithm. Structural mutation implies a modification in the structure of the RBFNNs. There are four different structural mutations: hidden node addition, hidden node deletion, connection addition and connection deletion. More information about genetic operators proposed can be seen in [7,8]. It is important to describe the structural and parametric mutations of the q parameter: – Structural Mutation: If the structural mutator adds a new node in the RBFNN, the q parameter is assigned to 1, since when q = 1 the qGaussian RBF reproduce to the Gaussian RBF. – Parametric Mutation: The q parameter is updated by adding a ε value, where ε ∈ [−0.25, 0.25], since the modification of the q-Gaussian is very sensible to q variation. 3. iRprop+ Local Optimizer. The local optimization algorithm used in our paper is the iRprop+ [9] optimization method. In the proposed methodology, we run the EA and then apply the local optimization algorithm to the best solution obtained by the EA in the last generation.
3
Feature Selection: Fast Correlation–Based Filter (FCBF)
The limitations of FR and FSS approaches in high-dimensional spaces, clearly suggest the need for a hybrid model. The FCBF method can be labelled as this kind of framework, Hybrid–Generation Feature Selection.
332
F. Fern´ andez-Navarro et al.
In feature subset selection, it is a fact that two types of features are generally perceived as being unnecessary: features that are irrelevant to the target concept, and features that are redundant given other features. Notions of feature redundancy are normally in terms of feature correlation. It is widely accepted that two features are redundant to each other if their values are completely correlated. There are two widely used types of measures for the correlation between two variables: linear and non–linear. In the linear case, the Pearson correlation coefficient is used, and in the non–linear case, many measures are based on the concept of entropy, or measure of the uncertainty of a random variable. Symmetrical uncertainty (SU) is frequently used, defined as � � IG(x|y) SU (x, y) = 2 H(x) + H(y) �p where H(x) = − i p(xi ) log2 (p(xi )) is the entropy of a variable x and IG(x|y) = H(x) − H(x|y) is the information gain from x provided by y. Both of them are between pairs of variables. However, it may not be as straightforward in determining feature redundancy when one is correlated with a set of features. [10] apply a technique based on cross–entropy, named Markov blanket filtering, to eliminate redundant features. FCBF calculates SU–correlation between any feature Fi and the class C generating a list in descending order, and heuristically decides a feature Fi to be relevant if it is highly correlated with the class C, i.e., if SUi,c > δ, where δ is a relevance threshold which can be determined by users. The selected relevant features are then subject to redundancy analysis. Similarly, FCBF evaluates the SU–correlation between individual features for redundancy analysis based on an approximate Markov blanket concept. For two relevant features Fi and Fj (i �= j), Fj can be eliminated if SUi,c ≥ SUj,c and SUi,j ≥ SUj,c . The iteration starts from the first element in the ranking and continues as follows. For all the remaining features, if Fi happens to form an approximate Markov blanket for Fj , Fj will be removed from list. After one round of filtering features based on Fi , the algorithm will take the remaining feature right next to Fi as the new reference to repeat the filtering process. The algorithm stops until no more features can be eliminated.
4
Experiments
This section presents the experimental results and analysis of q-Gaussian RBF models on 4 public microarray datasets with high dimensionality/small sample size and two classes (Table 1). At the beginning, the datasets and several machine learning algorithms used in this analysis are briefly described. Subsequently, experimental results are given and discussed from different aspects. 4.1
Microarray Data
These datasets were taken from bioinformatic and biomedical domains. They are often used to validate the performance of classifiers and gene selectors. Due
Evolutionary q-Gaussian RBFs for Improving Prediction Accuracy
333
Table 1. Characteristics of the four datasets used for the experiments: number of instances (Size), number of Real (R), Binary (B) and Nominal (N) input variables, total number of inputs (#In.), number of classes (#Out.), per-class distribution of the instances (Distribution) and the number of generations (#Gen.) Dataset Source Breast Van’t Veer et al [11] CNS Pomeroy et al [12] Colon Alon et al [13] Leukemia Golub et al [14]
Size 97 60 62 72
R 493 170 59 203
B -
N -
In 493 170 59 203
Out Distribution Gen 2 (46,51) 100 2 (21,39) 10 2 (40,22) 10 2 (42,25) 50
Table 2. Comparison of the proposed method to other probabilistic methods: Results of accuracy (CG (%)), Root Mean Square Error (RM SEG ) and Area Under Curve (AU CG ) on the generalization set RBFN MLogistic SLogistic C4.5 LMT SVM QRBF Dataset Metric Result Result Result Result Result Result M ean ± std Breast C 80.00 84.00 84.00 64.00 84.00 76.00 85.00 ± 3.05 CNS C 86.66 100.00 80.00 60.00 80.00 66.67 97 .38 ± 1 .02 Colon C 87.50 75.00 81.25 75.00 75.00 62.50 85 .35 ± 2 .06 Leukemia C 94.44 94.44 83.33 83.33 83.33 66.67 100.00 ± 0.00 Breast AUC 0.85 0.91 0.96 0.71 0.96 0.81 0.88 ± 0.08 CNS AUC 0.78 1.00 0.78 0.58 0.78 0.50 0 .93 ± 0 .03 Colon AUC 0.86 0.75 0.90 0.70 0.90 0.50 0.83 ± 0.12 Leukemia AUC 0.95 0.95 0.80 0.83 0.80 0.50 1.00 ± 0.00 Breast RMSE 0.41 0.37 0.34 0.57 0.34 0.42 0.32 ± 0.02 CNS RMSE 0.37 0.00 0.46 0.61 0.46 0.47 0 .23 ± 0 .05 Colon RMSE 0.33 0.50 0.36 0.48 0.39 0.49 0.29 ± 0.08 Leukemia RMSE 0.23 0.23 0.40 0.39 0.40 0.47 0.00 ± 0.00 The best result is in bold face and the second best result in italics.
to high dimensionality and small sample size, gene selection is an essential prerequisite for further data analysis. The selected datasets were: Breast [11], CNS [12], Colon [13] and Leukemia [14]. In these 4 microarray datasets, all expression values of genes are reals. For convenience, they were standarized before our experiments, that is, for each represented gene, its mean and standard deviation were zero and one, respectively, after the standarized operation had been performed. Finally, in the preprocessing stage, the number of features was reduced by means of the FCBF feature selector. 4.2
Alternative Statistical and Artificial Intelligence Methods Used for Comparison Purposes
Different state-of-the-art Statistical and Artificial Intelligence algorithms have been implemented for comparison purposes. Specifically, the results of the
334
F. Fern´ andez-Navarro et al.
following algorithms have been compared with the q-Gaussian RBF (QRBF) model presented in this paper: 1. A Gaussian Radial Basis Function Network (RBFN), deriving the centres and width of hidden units using k-means, and combining the outputs obtained from the hidden layer using logistic regression. 2. The MultiLogistic (MLogistic) algorithm. It is a method for building a multinomial logistic regression model with a ridge estimator to guard against overfitting by penalizing large coefficients. 3. The SimpleLogistic (SLogistic) algorithm. It is based on applying LogitBoost algorithm with simple regression functions and determining the optimum number of iterations by a five fold cross-validation. 4. The C4.5 classification tree inducer. 5. The Logistic Model Tree (LMT) classifier. 6. The Support Vector Machine (SVM) classifier with RBF kernels. These algorithms have been selected because many of these approaches have also been tested before in the classification problem of microarray gene expression. The detailed description and some previous results of these methods can be found in [15]. 4.3
Experimental Design
The evaluation of the different models has been performed using three different measures: Correctly Classified Rate (C) or accuracy, Root Mean Square Error (RM SE) and Area Under the ROC Curve (AU C) because they have been identified as three of the most commonly used metric to determine the performance of a classifier [16]. C represents threshold metrics, AU C is a probability metric, and RM SE is a rank metric. All the parameters used in the HA (Section 2.3) except the number of generations (#Gen) have the same values in all problems analyzed below (Table 1). The maximun and minimun number of RBFs in the hidden layer ([Mmin , Mmax ]) is [1, 3]. The connections between hidden and output layer are initialized in the [−5, 5] interval (i.e. [−I, I] = [−5, 5]). The size of the population is N = 500. For the selection of the SVM hyperparameters (regularization parameter, C, and width of the Gaussian functions, γ), a grid search algorithm has been applied with a ten-fold cross-validation, using the following ranges: C ∈ {2−5 , 2−3 , . . . , 215 } and γ ∈ {2−15 , 2−13 , . . . , 23 }. The experimental design was conducted using a holdout cross validation procedure with 3n/4 instances for the training dataset and n/4 instances for the generalization dataset. In order to evaluate the stability of the methods, the evolutionary algorithm is run 30 times. The HA and the model proposed was implemented in JAVA. We also used “libsvm” [17] to obtain the results of the SVM method, and WEKA to obtain the results of the remaining methods.
Evolutionary q-Gaussian RBFs for Improving Prediction Accuracy
4.4
335
Results
Table 2 shows the results of the correct classification rate (CG ), Root Mean Square Error (RM SEG ) and Area Under the ROC Curve (AU CG ) in the generalization set for each dataset and the RBFN, MLogistic, SLogistic, C4.5, LMT, SVM and QRBF methods. From the analysis of the results, it can be concluded, from a purely descriptive point of view, that the QRBF model obtained the best results for two datasets in CG , for one datasets in AU CG and for three datasets in RM SEG . Importantly, the perfect classification is obtained with the best QRBF model for leukemia dataset. The results confirm that the QRBF classifier leads to promising improvement on accuracy. Finally, since the proposed model (QRBF) is stochastic and the remaining classifiers are deterministic, the use of statistical tests for comparison of means or ranking would not make much sense.
5
Conclusions
In this paper, we propose a methodology (composed by two stages) for microarray gene classification that allows reducing the number of features of thousands to tens. This reduction of features is obtained by applying the FCBF feature selector algorithm, in the preprocessing stage and by means of performing the operations of remove connections and hidden nodes that incorporates the Hybrid Evolutionary Algorithm (HEA) which evolves the proposed base classifier, namely q-Gaussian Radial Basis Function Neural Networks. The proposed methodology achieved for the best models, the best results in CG over all datasets, which justifies the proposal. Finally, because of the reduced number of features that included the best models, it is possible to interpret them and then analyze the causal relationship between gene characteristics and the probability of belonging to each class.
Acknowledgement This work has been partially subsidized by the TIN 2008-06681-C06-03 project of the Spanish Inter-Ministerial Commission of Science and Technology (MICYT), FEDER funds and the P08-TIC-3745 project of the “Junta de Andaluc´ıa” (Spain). The research of Francisco Fern´ andez-Navarro has been funded by the “Junta de Andalucia” Predoctoral Program, grant reference P08-TIC-3745.
References 1. Lancashire, L.J., Powe, D.G., Reis-Filho, J.S., Rakha, E., Lemetre, C., Weigelt, B., Abdel-Fatah, T.M., Green, A.R., Mukta, R., Blamey, R., Paish, E.C., Rees, R.C., Ellis, I.O., Ball, G.R.: A validated gene expression profile for detecting clinical outcome in breast cancer using artificial neural networks. Breast cancer research and treatment 120(1), 83–93 (2010)
336
F. Fern´ andez-Navarro et al.
2. Chu, F., Wang, L.: Applying rbf neural networks to cancer classification based on gene expressions. In: IEEE International Conference on Neural Networks - Conference Proceedings, pp. 1930–1934 (2006) 3. Verleysen, M., Fran¸cois, D., Simon, G., Wertz, V.: On the effects of dimensionality ´ on data analysis with neural networks. In: Mira, J., Alvarez, J.R. (eds.) IWANN 2003. LNCS, vol. 2687, II105–II112. Springer, Heidelberg (2003) 4. Tsallis, C.: Possible generalization of boltzmann-gibbs statistics. Journal of Statistical Physics 52(1-2), 479–487 (1988) 5. Tsallis, C., Mendes, R.S., Plastino, A.R.: The role of constraints within generalized nonextensive statistics. Physica A: Statistical Mechanics and its Applications 261(3-4), 534–554 (1998) 6. Yu, L., Liu, H.: Efficient feature selection via analysis of relevance and redundancy. Journal of machine learning research 5, 1205–1224 (2004) 7. Mart´ınez-Estudillo, A.C., Mart´ınez-Estudilo, F.J., Herv´ as-Mart´ınez, C., Garc´ a, N.: Evolutionary product unit based neural networks for regression. Neural Networks 19(4), 477–486 (2006) 8. Herv´ as-Mart´ınez, C., Mart´ınez-Estudillo, F.J., Carbonero-Ruz, M.: Multilogistic regression by means of evolutionary product-unit neural networks. Neural Networks 21(7), 951–961 (2008) 9. Igel, C., H¨ usken, M.: Empirical evaluation of the improved rprop learning algorithms. Neurocomputing 50(6), 105–123 (2003) 10. Koller, D., Sahami, M.: Toward optimal feature selection. In: 13th Int. Conf. on Machine Learning, pp. 284–292 (1996) 11. Van’t Veer, L.J., Dai, H., Van de Vijver, M.J., He, Y.D., Hart, A.A.M., Mao, M., Peterse, H.L., Van Der Kooy, K., Marton, M.J., Witteveen, A.T., Schreiber, G.J., Kerkhoven, R.M., Roberts, C., Linsley, P.S., Bernards, R., Friend, S.H.: Gene expression profiling predicts clinical outcome of breast cancer. Nature 415(6871), 530–536 (2002) 12. Pomeroy, S.L., Tamayo, P., Gaasenbeek, M., Sturla, L.M., Angelo, M., McLaughlin, M.E., Kim, J.Y.H., Goumnerova, L.C., Black, P.M., Lau, C., Allen, J.C., Zagzag, D., Olson, J.M., Curran, T., Wetmore, C., Biegel, J.A., Poggio, T., Mukherjee, S., Rifkin, R., Califano, A., Stolovitzky, G., Louis, D.N., Mesirov, J.P., Lander, E.S., Golub, T.R.: Prediction of central nervous system embryonal tumour outcome based on gene expression. Nature 415(6870), 436–442 (2002) 13. Alon, U., Barka, N., Notterman, D.A., Gish, K., Ybarra, S., Mack, D., Levine, A.J.: Broad patterns of gene expression revealed by clustering analysis of tumor and normal colon tissues probed by oligonucleotide arrays. Proceedings of the National Academy of Sciences of the United States of America 96(12), 6745–6750 (1999) 14. Golub, T.R., Slonim, D.K., Tamayo, P., Huard, C., Gaasenbeek, M., Mesirov, J.P., Coller, H., Loh, M.L., Downing, J.R., Caligiuri, M.A., Bloomfield, C.D., Lander, E.S.: Molecular classification of cancer: Class discovery and class prediction by gene expression monitoring. Science 286(5439), 527–531 (1999) 15. Witten, I.H., Frank, E.: Data Mining: Practical Machine Learning Tools and Techniques, Data Management Systems, 2nd edn. Morgan Kaufmann, Elsevier (2005) 16. Sokolova, M., Lapalme, G.: A systematic analysis of performance measures for classification tasks. Information Processing and Management 45, 427–437 (2009) 17. Chang, C., Lin, C.: Libsvm: a library for support vector machines (2001)