GBLENDER: Visual Subgraph Query Formulation Meets Query Processing Changjiu Jin§ §
Sourav S Bhowmick§,¶ Xiaokui Xiao§ † ‡ Byron Choi Shuigeng Zhou
School of Computer Engineering, Nanyang Technological University, Singapore ¶ Singapore-MIT Alliance, Nanyang Technological University, Singapore † Department of Computer Science, Hong Kong Baptist University, Hong Kong ‡ Fudan University, China
cjjin|assourav|
[email protected],
[email protected],
[email protected] ABSTRACT Due to the complexity of graph query languages, the need for visual query interfaces that can reduce the burden of query formulation is fundamental to the spreading of graph data management tools to wider community. We present a novel HCI (human-computer interaction)-aware graph query processing paradigm, where instead of processing a query graph after its construction, it interleaves visual query construction and processing to improve system response time. We demonstrate a system called G BLENDER that exploits GUI latency to prune false results and prefetch candidate data graphs by employing a novel action-aware indexing scheme and a data structure called spindle-shaped graphs (SPIG). We demonstrate various innovative features of G BLENDER and its promising performance in evaluating subgraph containment and similarity queries.
Categories and Subject Descriptors H.2.4 [Database Management]: Systems - Query processing
General Terms Algorithms, Experimentation, Performance
Keywords Graph Databases, Graph Indexing, Visual Query Formulation, Frequent Subgraphs, Infrequent Subgraphs, Prefetching
1. INTRODUCTION Querying graph databases has emerged as an important research problem due to explosive growth of graph-structured data in recent years. A wide variety of graph queries in many applications involve the core substructure search problem (also called subgraph containment query). In this problem, given a graph database D and a query graph q, the aim is to find all data graphs in D in which q is a subgraph. Note that q is a subgraph of a data graph g ∈ D if there exist a subgraph isomorphism from q to g. A common problem for this type of query is that in many occasions there may not exists any g ∈ D that matches the query. In this case, it is often useful to find out data graphs that “nearly" contain the query graph, which is called the substructure similarity search problem [5] (also called subgraph similarity query). Copyright is held by the author/owner(s). SIGMOD’11, June 12–16, 2011, Athens, Greece. ACM 978-1-4503-0661-4/11/06.
A number of graph query languages (e.g., SPARQL) have been proposed that can be used to formulate subgraph queries. Unfortunately, in many real life domains it is unrealistic to assume that users are proficient in expressing graph queries using these languages. The traditional approach to address this query formulation challenge is to build a user-friendly visual framework on top of a state-of-the-art graph query processing technique (e.g., [5]). In this traditional visual query processing paradigm, although the final query that a user intends to pose is revealed gradually in a step-bystep manner during query construction, it is not exploited by the query processor prior to clicking of the Run icon to execute the query. That is, query processing is initiated only after the user has finished drawing the query. This often results in slower system response time (SRT)1 as the query processor remains idle during the entire query formulation process [2, 3]. In this demonstration, we present G BLENDER (Graph blender) [2, 3] - a novel HCI-aware visual subgraph querying system that challenges the aforementioned traditional paradigm of visual querying by blending the two orthogonal areas of visual graph query formulation and query processing. The key benefits of this novel query evaluation paradigm are two-fold. First, it ensures that the query processor does not remain idle during visual query formulation. Second, it significantly improves the SRT [2, 3]. In traditional paradigm, SRT is identical to the time taken to evaluate the entire query. In contrast, in this new paradigm SRT is the time taken to process a part of the query that is yet to be evaluated (if any). At each visual query formulation step taken by the user, G BLENDER employs a novel action-aware indexing scheme and a data structure called SPIG (spindle-shaped graphs) to efficiently compute candidate data graphs that contain (approximately if necessary) the current query fragment by exploiting the GUI latency. It also supports modifications to a query gracefully as a user may change her mind or commit mistakes during query construction. In this demonstration, we shall demonstrate various interactive and innovative features of G BLENDER that are necessary to realize the proposed visual query processing paradigm.
2.
SYSTEM OVERVIEW
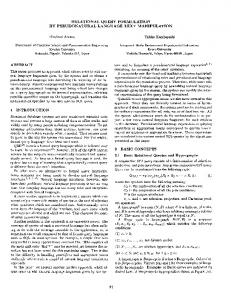
Figure 2 shows the system architecture of G BLENDER and mainly consists of the following modules. The reader may refer to [2, 3] for details related to these modules. The GUI module: Figure 1(a) depicts the screenshot of the visual interface of G BLENDER. A user begins formulating a query by 1
Duration between the time a user presses the Run icon to the time when the user gets the query results.
Panel 1
Panel 2 Panel 3 6
3 2 8
5
1 4
7
Panel 4
(a) Visual interface. (b) The Interaction Viewer module. (c) The Modification Handler module. Figure 1: The G BLENDER system (The identifiers on the edges represent the sequence of visual steps for query formulation). Actions
Results
User
GBLENDER GUI Query Fragment Index Constructor
Action-Aware Indices
Frequent Fragment Extractor
SPIG Generator
Query Matching
Modification Handler
Results Visualizer
Interaction Viewer
Verifier Verificationfree candidates
Candidates Graph Database
Figure 2: Architecture of G BLENDER. choosing a database as the query target and creating a new query canvas using Panel 1. The left panel (Panel 2) displays the unique labels of nodes that appear in the dataset in lexicographic order. In the query formulation process, the user chooses labels from Panel 2 for creating the nodes in the query graph. Panel 3 depicts the area for formulating graph queries. A user drags a node that is part of the query from Panel 2 and drops it in Panel 3. Next, she adds another node in the same way. Then, she creates an edge between the added nodes by left and right clicking on them. Additional nodes and edges are added to the query graph by repeating these steps. Finally, the user can execute the query by clicking on the Run icon in Panel 1. Panel 4 displays the query results. The Frequent Fragment Extractor module: This module mines the frequent fragments from the graph database D using an existing frequent graph mining technique (the current version uses gSpan [6]). Informally, we use the term fragment (resp. query fragment) to refer to a small subgraph existing in graph databases (resp. query graphs). Given a fragment g which is a subgraph of G (denoted as g ⊆ G) and G ∈ D, we refer to G as the fragment support graph (FSG) of g. Since each data graph in D is denoted by an unique identifier, f sgIds(g) denotes the set of identifiers of FSG s of g. A fragment g is frequent in D if its support is no less than α|D| where 0 < α < 1 is the minimum support threshold. Otherwise, g is an infrequent fragment. The Action-Aware Index Constructor module: The action-aware frequent index (A2 F) is a graph-structured index having a memoryresident and a disk-resident components. We refer to them as memory-based frequent index (MF-index) and disk-based frequent index (DF-index), respectively. Specifically, small-sized frequent fragments (frequently utilized) are stored in MF-index whereas larger frequent fragments (less frequently utilized) reside in DF-index. The DF-index is an array of fragment clusters. A fragment cluster is a directed graph C = (VC , EC ) where each node v ∈ VC is a frequent fragment f where the size of f (denoted as |f |) is greater than the fragment size threshold β (i.e., |f | > β). There is an edge (v ′ , v) ∈ EC iff f ′ is a proper subgraph of f (denoted as f ′ ⊂ f ) and |f | = |f ′ | + 1. We denote the root node (node with no in-
coming edge) of C as root(C). Each fragment f of v is represented by its CAM code. Each node with fragment f in C points to a set of FSG identifiers of f (f sgIds(f )). Note that given the frequent fragments f and f ′ , if f ′ ⊂ f then f sgIds(f ) ∩ f sgIds(f ′ ) = f sgIds(f ). Consequently, G BLENDER store only a subset of f sgIds(f ) at each node. MF -index indexes all frequent fragments having size less than or equal to β. Similar to a fragment cluster, it is a directed graph GM = (VM , EM ) where the nodes and edges have same semantics as C. In addition, nodes representing frequent fragments of size β are leaf nodes in GM and do not have any child fragments. Each leaf node v ∈ VM (representing f ) is additionally associated with a fragment cluster list L where each entry Li points to a fragment cluster Cj in the DF-index such that f ⊂ root(Cj ). The action-aware infrequent index (A2 I-index) indexes infrequent fragments to prune the candidate space for infrequent queries. In order to ensure that the index is space-efficient, we index only the discriminative infrequent fragments (DIFs), which are infrequent fragments whose subgraphs are all frequent. Intuitively, it consists of an array of DIFs arranged in ascending order of their sizes. Each entry in the index stores the CAM code of a DIF g and f sgIds(g). The SPIG Generator module: For each new edge eℓ created by the user, this module create a spindle-shaped graph (SPIG) using the action-aware indexes. Each edge is assigned a unique identifier according to their formulation sequence. That is, the ℓ-th edge constructed by a user is denoted as eℓ where ℓ is its label. The edge with the largest ℓ is referred to as new edge (most recently added). A SPIG is a directed graph Sℓ = (Vℓ , Eℓ ) where each node v ∈ Vℓ represents a subgraph g of the query fragment containing eℓ . There is a directed edge from node v ′ to node v if g ′ ⊂ g and |g| = |g ′ | + 1. Each v is associated with the CAM code of the corresponding g, a list of labels of edges of g, and a list of identifier set called Fragment List of g. The Fragment List contains four attributes, namely frequent id, DIF id, frequent subgraph id set, and 2 2 DIF subgraph id set. If g is in A F-index or A I -index, then the corresponding identifier of the node in the index is stored in frequent id or DIF id attribute, respectively. However, if g is neither in A2 F-index nor in A2 I-index, then the frequent subgraph id set stores the frequent ids of all largest proper subgraphs of g that are in A2 F-index. Note that size of these subgraphs is |g| − 1. Lastly, the DIF subgraph id set of g contains the DIF ids of all subgraphs of g that are indexed by A2 I-index. The source vertex (no incoming edge) in the first level of Sℓ , represents eℓ and the target vertex (no outgoing edge) in the last level, represents the entire query fragment at a specific step. The Query Matching module: This module implements an innovative SPIG-based query matching algorithm that utilizes the latency offered by the GUI actions to retrieve partial candidate data graphs. When a user draws a new edge eℓ on the query canvas, this module retrieves identifiers of data graphs containing the query
fragment q (denoted by Rq ) and monitors its status. If Rq is nonempty at a specific step then subgraph containment search is invoked as q has exact matches in the database. If q is a frequent fragment, then it retrieves FSG identifiers of g by probing A2 Findex. Otherwise, if g represents a DIF, then it retrieves the FSG identifiers from A2 I-index. If g is neither a DIF nor a frequent fragment then for each identifier in the frequent subgraph id set and DIF subgraph id set of g in the SPIG, it retrieves the corresponding FSG identifiers from A2 F-index and A2 I-index, respectively, and then intersect them with Rq to generate the candidate set. If Rq becomes empty (e.g., in Figure 1(a), the query fragment after Step 6 does not have any match) then it exploits the SPIG set to efficiently support the following two steps. (a) If the user chooses to modify q then it invokes the Modification Handler module (see below) to handle the modification process. (b) Otherwise, it invokes substructure similarity search to retrieve approximate matches to q. Similar to [5], we adopt the maximum connected common subgraphs (MCCS) for computing similarity between a pair of graphs. Given the subgraph distance threshold σ, this module exploits the SPIG set to identify the relevant subgraphs of q that need to be matched for retrieving approximate candidate sets. Specifically, these subgraphs are query fragments represented by the nodes at levels |q| − 1 to |q| − σ in the SPIG set. The candidate set are separated into two parts, namely Rf ree and Rver , storing the identifiers of verification-free candidate graphs and data graphs that need verification, respectively. For each node in the i-th level, if it is a frequent fragment or DIF, then the candidates satisfying the node is retrieved using the aforementioned exact substructure search procedure and combine them with existing Rf ree . Otherwise, it is neither a frequent fragment nor a DIF. Consequently, the candidate data graphs are once again computed using frequent subgraph id set and DIF subgraph id set (see above) and combined with existing Rver . Lastly, candidates that exist in both Rf ree and Rver are removed from Rver . The Verifier module: If the final query is a frequent subgraph containment query or a DIF, then the results are directly computed without subgraph isomorphism test. If it is a non-DIF infrequent subgraph containment query, when the Run icon is clicked, this module returns the exact results by filtering the false candidates using Ullman’s algorithm for subgraph isomorphism test. Otherwise, if the final query has evolved to a subgraph similarity query then firstly the candidates in Rf ree are added to result set without any verification test. Next, it generates the result set from the candidates in Rver by extending VF2 [1] to handle MCCS-based similarity verification. The Interaction Viewer module: This module provides a realtime graphical view of the working of the proposed visual query evaluation paradigm. Specifically, it depicts the effect of each visual query formulation step on the state (exact or approximate) of query graph, the size of candidate data graphs as well as time taken by G BLENDER to compute them. Consider the construction of the query in Figure 1(a). The query evaluation process at every step is depicted in Figure 1(b). The bottom part of the screen displays the sizes of candidate data graphs at different steps. Observe that it also depicts the transition of the query fragment from exact substructure search (Steps 1-5, color coded in blue) to substructure similarity search (Steps 6-8, color coded in green). The top part of the display plots the time taken by the query matching algorithm to compute and maintain the candidate data graphs at every step. The Modification Handler module: This module assists the user to modify the formulated query appropriately so that non-empty results set. It exploits the SPIGs to recommend the edge (by color coding the edge in the GUI) whose deletion would maximize the
size of the candidate graph set of the modified query fragment. For example, reconsider the query in Figure 1(a) at Step 6. If the user chooses to modify the query then this module recommends the edge (N,Cl) for deletion (depicted by red colored edge in Figure 1(c)). Note that the user may ignore this suggestion and is free to delete any edge (at any time during query formulation) that has been previously constructed by her. After modification by the user, it updates the SPIG set by removing irrelevant nodes from the SPIGs. The Results Visualizer module: Upon successful execution of a subgraph query, this module displays the results in graphical format (Panel 4) using the ZGRViewer [4]. The result graphs are ordered according to increasing value of their similarity distance.
3.
DEMONSTRATION OBJECTIVES
G BLENDER is implemented in Java JDK 1.6. Our demonstration will be loaded with synthetic datasets and a few real datasets (e.g., AIDS Antiviral dataset containing 43 K graphs) with different sizes. Example query graphs will be presented. Users can also write their own ad-hoc queries through our GUI. Interactive experience of the novel query evaluation paradigm. One of the key objectives of the demonstration is to enable the audience to interactively experience the proposed query processing paradigm in real-time. During the visual construction of a subgraph query, the Interaction Viewer module (Figure 1(b)) shall be enabled to assist users in gaining such experience. Through this module, one will be able to view the generation of candidate data graphs at each visual step, evolution of a containment query to a similarity query (if necessary) and their effect on the size of candidate set (bottom part of Figure 1(b)). Additionally, the user will be able to experience the time taken by G BLENDER at each visual step for fetching candidate data graphs (top part of Figure 1(b)) and appreciate the fact that the latency offered by the GUI at each step is sufficient to finish this prefetching task. Furthermore, she will be able to visualize in real-time the effect of the type of subgraph query fragment (containment or similarity) on the prefetching time. Robustness to query modification. We shall interactively show the following two features of G BLENDER to highlight its robustness to query modification. First, we shall show the automatic edge recommendation process for deletion (Figure 1(c)). Second, we shall demonstrate in real-time (using the Interface Viewer) how G BLENDER efficiently handle query modification in response to deletion of any edge by a user during query formulation. Superior performance of G BLENDER. We shall demonstrate that the proposed paradigm significantly improves SRT compared to traditional graph query evaluation systems. Acknowledgement: Shuigeng Zhou was supported by NSFC under grant No. 60873070.
4.
REFERENCES
[1] L.P. C ORDELLA , ET AL . An improved algorithm for matching large graphs. Proceedings of the 3rd IAPR TC-15 Workshop on Graph-based Representations in Pattern Recognition, 2001. [2] C. J IN , ET AL . G BLENDER: Towards Blending Visual Query Formulation and Query Processing in Graph Databases. In ACM SIGMOD, 2010. [3] C. J IN , ET AL . A Practical Framework for Blending Visual Subgraph Query Formulation and Query Processing. In Technical Report, Available at http://www.cais.ntu.edu.sg/ ~assourav/TechReports/GBlender-TR.pdf, 2010. [4] E. P IETRIGA . A Toolkit for Addressing HCI Issues in Visual Language Environments.In IEEE Symp. on Vis. Lang. and Human-Centric Comp., 2005. [5] H. S HANG , ET AL . Connected Substructure Similarity Search. In SIGMOD, 2010. [6] X. YAN , ET AL . gSpan: Graph-based Substructure Pattern Mining. In ICDM, 2002.