Ontology-based Visual Query Formulation: An Industry Experience Ahmet Soylu1,2 , Evgeny Kharlamov3 , Dmitriy Zheleznyakov3 , Ernesto Jimenez-Ruiz3 , Martin Giese1 , and Ian Horrocks3 1
2
Department of Informatics, University of Oslo, Norway {ahmets, martingi}@ifi.uio.no Faculty of Informatics and Media Technology, Gjøvik University College, Norway
[email protected] 3 Department of Computer Science, University of Oxford, United Kingdom {name.surname}@cs.ox.ac.uk
Abstract. Querying is an essential instrument for meeting ad hoc information needs; however, current approaches for querying semantic data sources mostly target technologically versed users. Hence, there is a need for methods that make it possible for users with limited technological skills to express relatively complex ad hoc information needs in an easy and intuitive way. Visual methods for query formulation undertake the challenge of making querying independent of users’ technical skills and the knowledge of the underlying textual query language and the structure of data. In this paper, we present an ontology-based visual query system, OptiqueVQS, and report user experiments in two industrial settings. Keywords: Visual Query Formulation, Ontology, Usability, SPARQL.
1
Introduction
In the semantic web community, various visualisations and user interfaces have been developed to aid the understanding of different domains – often represented by large and complex ontologies – and value creation out of vast data sources (cf. [1,2]). Amongst these, query interfaces are important as they enable users to express ad hoc information needs, which could not be addressed by predefined visualisations or queries embedded into applications. However, current approaches for querying semantic data sources mostly target technology-experienced users, although semantic data consumers come from different backgrounds, and have varying levels of expertise. Hence, there is a need for providing semantic data consumers who are not technology-experienced users with the flexibility to pose relatively complex ad hoc queries in an easy and intuitive way. Formal textual languages, keyword search, natural language interfaces, visual query languages (VQL), and visual query systems (VQS) are known approaches for querying semantic data sources (cf. [3]). Formal textual languages are inaccessible to end users, since they demand a sound technical background. Keyword search and natural language interfaces remain insufficient for querying structured data,
2
Soylu et al.
due to low expressiveness and ambiguities respectively. VQLs are based on a formal visual syntax and notation, and are comparable to formal textual languages from an end-user perspective, as users need to understand the semantics of visual syntax and notation. A VQS [4] differs from a VQL, since it is primarily a system of interactions formed by an arbitrary set of user actions that effectively capture a set of syntactic rules specifying a (query) language. A VQS might use a VQL for query representation; however, VQSs built on non-formal visualisations are expected to offer a good usability-expressiveness balance. In this respect, VQSs primarily undertake the challenge of making querying independent of users’ technical skills and the knowledge of the underlying textual query language and the structure of data. To this end, we have been developing an ontology-based visual query system, namely OptiqueVQS [3], within a large industrial project, called Optique4 [5], for end users, i.e., domain experts. OptiqueVQS distinguishes itself from other query interfaces as it a) does not use a formal notation and syntax for query representation, but still conforms to the underlying formalism; b) employs a formal approach projecting the underlying ontology into a graph for navigation, which constitutes the backbone of the query formulation process; c) possesses a set of important quality attributes such as adaptivity, modularity, and multi-paradigm design; and d) has been evaluated with different sets of end users in different contexts, and found to be promising. In this paper, we introduce OptiqueVQS from an end-user perspective, present its quality attributes, describe the underlying formal approach, and then present the results of usability experiments with domain experts.
2
OptiqueVQS
OptiqueVQS is meant for end users who have no or very limited technical skills and knowledge, such as on programming, databases, query languages, and have low/no tolerance, intention, nor time to use and learn formal textual query languages. As such, they often use computers in their daily life and work, such as for web browsing, e-mail, and office and entertainment applications. OptiqueVQS is a visual query system and it is not our concern to reflect the underlying formality (i.e., query language and ontology) per se. However, user behaviour is constrained so as to enforce the generation of valid queries, and ontologies are formally projected into graphs in order to provide simpler representation and interaction styles for end users. We are also not interested in providing full expressivity, as simpler interfaces will suffice for majority of end user queries [6]. End users make a very little use of advanced functionalities and are likely to drop their own requirements for the sake of having simpler ways for basic tasks [4]. 2.1
User Interface
The interface of OptiqueVQS is designed as a widget-based user-interface mashup (UI mashup). Apart from flexibility and extensibility, such a modular approach 4
http://www.optique-project.eu
Ontology-based Visual Query Formulation: An Industry Experience
3
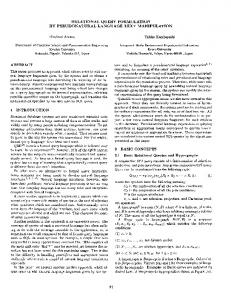
provides us with the ability to combine multiple representations, interaction, and query formulation paradigms, and distribute functionality appropriately. In Figure 1, a query is shown as a tree in the upper widget (W1), representing typed variables as nodes and object properties as arcs. New typed variables can be added to the query by using the list in the bottom-left widget (W2). If a query node is selected, the faceted widget (W3) at the bottom-right shows controls for refining the corresponding typed variable, e.g. setting a value for a data property or switching to a more specific concept. Once a restriction is set on a data property or a data property is selected for output (i.e., using the eye icon), it is reflected in the label of the corresponding node in the query graph. The user has to follow the same steps to involve new concepts in the query and can always jump to a specific part of the query by clicking on the corresponding variable-node in W1. These three widgets are orchestrated by the system, through harvesting event notifications generated by each widget as the user interacts. At each step of the query formulation process W2 and W3 provide automatically generated ranked suggestions to guide users in constructing the query (see [7]).
Fig. 1. An example query in visual mode is depicted.
The user can delete nodes, save/load queries, access query catalogue, and undo/redo actions by using the buttons at the bottom part of W1. The user can also switch to editable textual SPARQL mode by clicking on “SPARQL Query” button at the bottom-right part of the W1 as depicted in Figure 2. The availability of a textual mode synchronised with the visual representation
4
Soylu et al.
enables collaboration between end users and technology-experienced users. Note that SPARQL mode is compliant, in terms of expressiveness, to what can be represented in the visual mode.
Fig. 2. An example query in textual mode and result view are depicted.
Finally, we recently extended OptiqueVQS with two new widgets, which provide evidence on how a widget-based architecture allows us to hide complex functionality behind layers and combine different paradigms. The first widget is tabular result widget (W4 – see Figure 2). It provides an example result list and also means for aggregation and sequencing operations. Aggregation and sequencing operations fit naturally to a tabular view, since it is a related and familiar metaphor. The user can also view the full result list, inspect the individuals, and export data. The second widget is a map widget (W5 – see Figure 3), which is a domain-specific (i.e., geospatial) component allowing the user to constrain attributes by selecting an input value from a map. For this purpose, a button with a pin icon is placed next to every appropriate attribute. There are limits to the supported expressiveness, e.g. no union, negation etc., however it is possible to construct rather complex queries with a number of classes, restrictions, and branches. As far as the design rationale is considered, OptiqueVQS combines multiple familiar representation and interaction paradigms into a single view. This way the user can have a constant and global overview of the query, while working with the list and faceted widgets to manipulate and extend it (i.e., view/overview). OptiqueVQS also provides simple three-
Ontology-based Visual Query Formulation: An Industry Experience
5
Fig. 3. An example query with the map widget is depicted.
shaped query representation, which is free of any SPARQL or ontology jargon. A unidirectional tree-shaped query representation is employed to avoid a graph representation for simplicity. For more details on the design and implementation of OptiqueVQS, we refer interested readers to our earlier work [3]. 2.2
Quality Attributes
Quality attributes are non-functional requirements that affect run-time behaviour, design, and user experience. OptiqeVQS possesses the following interrelated quality attributes, which effectively increase the benefits gained and decrease the cost of adoption for end users. Usability is the primary quality attribute, and all other quality attributes directly or indirectly affect the usability. The attributes are derived from our conceptual review [8] and discussed in another work [9]. (A1) Usability: The design of OptiqueVQS emphasises harmonies between view and overview, and exploration and construction. It combines multiple representation, interaction, and query formulation paradigms to address different set of users and tasks. The functionality is distributed among widgets with respect to their suitability. Users formulate queries iteratively and could collaborate with different types of users. (A2) Modularity: OptiqueVQS employs a widget-based mashup approach, which provides us with the flexibility to add/remove components easily. This could include alternative/complementary components for query formulation, exploration, visualisation, etc. with respect to context.
6
Soylu et al.
(A3) Scalability: OptiqueVQS provides gradual and on-demand access to the relevant parts of the underlying ontology to cope with large ontologies, while the employed ranking approach filters down the amount of ontological knowledge to be presented at each step. (A4) Adaptivity & adaptability: The modular architecture of OptiqueVQS, availability of multiple representation, interaction, and query formulation paradigms, and ranked suggestions enable OptiqueVQS to provide diverse user experiences by altering presentation, content, and behaviour automatically or manually with respect to context. (A5) Extensibility: OptiqeVQS provides flexibility against changing requirements both from architectural and design perspectives for sustainable evolution. The modular architecture allows new components to be easily introduced and combined, while new functionalities could be added easily without overloading the interface due to the multi-paradigm design. (A6) Interoperability: The ability of OptiqueVQS to export data in different formats ensures that it fits into organisational contexts and broader user experiences, as the extracted data could be utilised by other applications in the workflow or the digital ecosystem. (A7) Portability: OptiqueVQS relies on a domain-agnostic backend, which projects the underlying ontology into a graph for exploration and query construction. This provides ability to query other domains, rather than only a specific domain, without high installation and configuration costs. (A8) Reusability: OptiqueVQS allows users to store, load, and modify queries. Queries are stored in a query catalogue with descriptive texts to facilitate their search and retrieval. End users can reuse existing queries or modify them to formulate more complex queries. 2.3
Navigation Graph
In OptiqueVQS, user queries have a graph-like structure and interaction with the ontology happens through graph navigation. However, OWL 2 axioms are not well-suited for a graph-based navigation. Indeed, note that OWL 2 axioms do not have a natural correspondence to a graph. Therefore, we need a technique to extract a suitable graph-like structure from a set of OWL 2 axioms. Intuitively, OptiqueVQS allows users to construct tree-shaped conjunctive queries where each path is of the form: Person(x), livesIn(x, y), City(y), ... Each such path essentially ‘connects’ classes like Person and City via properties like livesIn. At each query construction step OptiqueVQS suggests the user classes and properties that are semantically relevant to the already constructed partial query. We determine this relevance by exploiting the input OWL 2 ontology: we project the input ontology onto a graph structure that is called navigation graph [10] and use this graph at query construction time. More precisely, for each class in the partial query OptiqueVQS suggests only those properties and classes, which are reachable in the navigation graph in one step. Note that OWL 2 ontologies are essentially sets of first-order logic axioms and thus there is no
Ontology-based Visual Query Formulation: An Industry Experience
7
immediate relationship between them and a graph. This makes projection of OWL 2 ontologies onto a navigation graph a non-trivial task. In the remaining part of this section we will formally introduce navigation graph, define when a query is meaningful with respect to it, and finally we define the grammar of queries that users can construct with the help of OptiqueVQS. The nodes of a navigation graph are unary predicates and constants, and edges are labelled with possible relations between such elements, that is, binary predicates or a special symbol type. The key property of a navigation graph is that every X-labelled edge (v, w) is justified by a rule or fact entailed by O ∪ D which “semantically relates” v to w via X. We distinguish three kinds of semantic relations: (i) existential, where X is a binary predicate and (each element of) v must be X-related to (an element of) w in the models of O ∪ D; (ii) universal, where (each instance of) v is X-related only to (instances of) w in the models of O ∪ D; and (iii) typing, where X = type, and (the constant) v is entailed to be an instance of (the unary predicate) w. Formally: Definition 1. Let O be an OWL 2 ontology and D a knowledge graph. A navigation graph for O and D is a directed labelled multigraph G having as nodes unary predicates or constants from O and D and s.t. each edge is labelled with a binary predicate from O or type. Each edge e is justified by a fact or rule αe s.t. O ∪ C |= αe and αe is of the form given next, where c, d are constants, A, B unary predicates, and R a binary predicate: R (i) if e is c − → d, then αe is of the form R(c, d) or ∀y.[R(c, y) → y ≈ d]; R → A, then αe is a rule of the form >(c) → ∃y.[R(c, y) ∧ A(y)] or (ii) if e is c − ∀y.[R(c, y) → A(y)]; R (iii) if e is A − → B, then αe is a rule of the form ∀x.[A(x) → ∃y.[R(x, y)∧B(y)]] or ∀x, y.[A(x) ∧ R(x, y) → B(y)]; R → c, then αe is a rule of the form ∀x.[A(x) → R(x, c)] or (iv) if e is A − >(c) → ∃y.[R(y, c) ∧ A(y)] or ∀x, y.[A(x) ∧ R(x, y) → y ≈ c]; type (v) if e is c −−→ A, then αe = A(c). The first (resp., second) option for each αe in (i)-(iii) encodes the existential (resp., universal) R-relation between nodes in e; the first and second (resp., third) options for each αe in (iv) encode the existential (resp., universal) R-relation between nodes in e; and (v) encodes typing. A graph may not contain all justifiable edges, but rather those that are deemed relevant to the given application. To realise the idea of ontology and data guided navigation, we require that interfaces conform to the navigation graph. We assume that all the following definitions are parametrised with a fixed ontology O and a knowledge graph D. Definition 2. Let Q be a conjunctive query. The graph of Q is the smallest multi-labelled directed graph GQ with a node for each term in Q and a directed edge (x, y) for each atom R(x, y) occurring in Q, where R is different from ≈. We say that Q is tree-shaped if GQ is a tree. Moreover, a variable node x is labelled with a unary predicate A if the atom A(x) occurs in Q, and an edge (t1 , t2 ) is labelled with a binary predicate R if the atom R(t1 , t2 ) occurs in O.
8
Soylu et al.
Finally, we are ready to define the notion of conformation. Definition 3. Let Q be a conjunctive query and G a navigation graph. We say that Q conforms to G if for each edge (t1 , t2 ) in the graph GQ of Q the following holds: – If t1 and t2 are variables, then for each label B of t2 there is a label A of t1 R and a label R of (t1 , t2 ) such that A − → B is an edge in G. – If t1 is a variable and t2 is a constant, then there is a label A of t1 and a R label R of (t1 , t2 ) such that A − → t1 is an edge in G. – If t1 is a constant and t2 is a variable, then for each label B of t2 there is a R label R of (t1 , t2 ) such that t1 − → t2 is an edge in G. R – If t1 and t2 are constants, then a label R of (t1 , t2 ) such that t1 − → t2 is an edge in G. OptiqueVQS allows constructing conjunctive tree-shaped queries. The generation is done via reasoning over the navigation graph, which contain edges of types (iii)-(v) (see Definition 1). Now we describe the class of queries that can be generated using OptiqueVQS and show that they conform to the navigation graph underlying the system. First, observe that the OptiqueVQS queries follow the following grammar: query ::= A(x)(∧ constr(x))∗ (∧ expr(x))∗ expr(x) ::= sug(x, y)(∧ constr(x))∗ (∧ expr(y))∗ constr(x) ::= ∃yR(x, y) | R(x, y) | R(x, c) sug(x, y) ::= Q(x, y) ∧ A(y) where A is an atomic class, R is an atomic data property, Q is an object property, and c is a data value. The expression of the form A(∧ B)∗ designates that B-expressions can appear in the formula 0, 1, and so on, times. An OptiqueVQS query is constructed using suggestions sug and constraints constr, that are combined in expressions expr. Such queries are conjunctive and tree-shaped. All the variables that occur in classes and object properties are output variables and some variables occurring in data properties can also be output variables.
3
Evaluation
Three user experiments are conducted with different types of users. The first experiment is reported in our previous work [3] and involved a movie ontology and 15 casual users, who are bachelor students in different social science disciplines. The second and third experiments are conducted with our industrial partners, which are Statoil ASA and Siemens AG. In the Statoil experiment, an oil & gas ontology, which in total includes 253 concepts, 208 relationships (including inverse properties), and 233 attributes, is used. In the Siemens experiment, a diagnostic ontology, which in total includes five concepts, five relationships (excluding inverse properties), and nine attributes, is used. In both cases neither ontologies nor
Ontology-based Visual Query Formulation: An Industry Experience
9
data sets are public. The tasks used in Statoil and Siemens experiments are all conjunctive, see Table 1. A total of seven domain experts are engaged in the experiments, see Table 2 (Likert scale 1 for “not familiar at all” and 5 for “very familiar”). Table 1. Information needs used in the experiments (T1-9 Statoil and T10-14 Siemens). T
Information need
1
List all fields.
2
What is the water depth of the “Snorre A” platform (facility)?
3
List all fields operated by “Statoil Petroleum AS” company.
4
List all exploration wellbores with the field they belong to and the geochronological era(s) with which they are recorded.
5
List the fields that are currently operated by the company that operates the “Alta” field.
6
List the companies that are licensees in production licenses that own fields with a recoverable oil equivalent over more than “300” in the field reserve.
7
List all production licenses that have a field with a wellbore completed between “1970” and “1980” and recoverable oil equivalent greater than “100” in the company reserve.
8
List the blocks that contain wellbores that are drilled by a company that is a field operator.
9
List all producing fields operated by “Statoil Petroleum AS" company that has a wellbore containing “gas” and a wellbore containing “oil”.
10 Find all assemblies that exist in system. 11 Show all messages that tribune “NA0101/01” generated from “01.12.2009” to “02.12.2009”. 12 Show all turbines that sent a message containing the text “Trip” ’ between “01.12.2009” and “02.12.2009”. 13 Show all event categories known to the system. 14 Show all turbines that sent a message category “Shutdown” between “01.12.2009” and “02.12.2009”.
The experiments are designed as a think-aloud study and only a 5 min. introduction is given to participants. Each participant performs the experiment in a single session, while being watched by an observer. Formulating the query, executing it, and inspecting the result set equals to one attempt. Participants have a maximum of three attempts per task. A task is ended, when the participant acknowledges completion or exhausts his/her three attempts. In the Statoil experiment, participants overall have 84 percent correct completion rate and 69 percent first-attempt correct completion rate (i.e., percentage
10
Soylu et al. Table 2. Participant profiles (P1-3 Statoil and P4-7 Siemens). P
Age
1 2 3 4 5 6 7
39 40 49 33 27 60 45
Occupation
Education
Geologist Biostrat IT advisor Software engineer Diagnostic Engineer Mechanical Engineer Mechanical Engineer
Master Master Master Bachelor Bachelor Master Bachelor
Technical skills 3 2 5 5 5 3 1
Similar tools 3 1 4 2 5 1 2
of correctly formulated queries in the first attempt), while in the Siemens experiment, correct completion rate is 88 percent and first-attempt correct completion rate is 72 percent (see Figure 4). In our earlier experiment with casual users, there is a full correct completion rate and 80 percent first-attempt correct completion rate. The results are comparatively better, and this could be attributed to genericness of the ontology. Statoil users have lower scores and often commented that the ontology does not match to their understanding of the domain. This is because the ontology used in the Statoil experiment is automatically generated (i.e., bootstrapped), while the others are manually created. We acknowledge the situation and believe that the usability of an ontology is as crucial as the usability of a query formulation tool and is an overlooked issue in the research community. Overall, the results indicate high effectiveness and efficiency suggesting that OptiqueVQS is a viable tool for users without any technical background to construct considerably complex queries. OptiqueVQS also offers a good learnability as users can solve complex tasks without any training. The participants praised the capability of OptiqueVQS for formulating complex information needs into queries. A common statement was that such a solution will not only improve their current practices, but also augment their value creation potential.
4
Related Work
We distinguish existing visual methods for querying semantic data sources into two categories. The first category includes approaches that are primarily built on a VQL, which has a formal visual syntax and notation. The second category of approaches mainly employs a system of interactions, i.e., VQSs, which generates queries in target linguistic form. The notable examples of the fist category are LUPOSDATE [11], RDF-GL [12], GQL [13], and QueryVOWL [14]. LUPOSDATE and RDF-GL follow RDF syntax at a very low level through node-link diagrams representing the subject-predicateobject notation, while GQL and QueryVOWL represent queries at comparatively higher level, such as with UML-based diagrams. Each of these languages are managed by a VQS providing means for construction and manipulation of queries in a visual form. Albeit VQL-based approaches with higher level of abstraction
3
600
2.5
500
2 1.5 1
Time (s)
100 90 80 70 60 50 40 30 20 10 0
A"empt (Avg.)
Comple0on (%)
Ontology-based Visual Query Formulation: An Industry Experience
0.5 T2
T3
T4
T5
T6
T7
T8
400 300 200 100
0 T1
0
T9
T1
T2
T3
Task (Statoil) A:empt (Avg.)
Max. 3
600
2.5
500
2 1.5 1 0.5 0 T11
T12
T13
Task (Siemens) Comple4on (%)
A:empt (Avg.)
T14
Time (s)
100 90 80 70 60 50 40 30 20 10 0 T10
T4
T5
T6
T7
T8
T9
Task (Statoil)
A"empts (Avg.)
Comple0on (%)
Comple4on (%)
11
Min.
Avg.
400 300 200 100 0 T10
T11
T12
T13
T14
Task (Siemens) Max.
Min.
Avg.
Fig. 4. The results of Statoil and Siemens experiments.
are closer to end users, they still need to posses a higher level of knowledge and skills to understand the semantics of visual notation and syntax and to use it. The prominent examples of the second category are gFacet [15], SparqlFilterFlow [16], Konduit VQB [17], and Rhizomer [18]. gFacet and SparqlFilterFlow employ a diagram-based approach; however, diagrams representing the queries are rather informal. Konduit VQB and Rhizomer employ a form-based paradigm. Diagram-based approaches are good in providing a global overview; however, they remain insufficient for view (i.e., zooming into a specific concept for filtering and projection). This is because the visual space as a whole is mostly occupied for query overview. Form-based approaches provide a good view; however, they provide a poor overview, since the visual space as a whole is mostly occupied with the properties of the focus concept. Approaches combining multiple representation and interaction paradigms are known to be better as they could combine view and overview. Finally, gFacet and Rhizomer are originally meant for data browsing, that is they operate on data level rather than schema level and every user interaction generates and sends SPARQL queries in the background. Yet they are highly data-intensive, which is often impractical for large data sources.
5
Conclusion
OptiqueVQS enables end users to easily formulate comparatively complex queries at a conceptual level. It employs a formal ontology to graph projection method to support query formulation and ontology navigation, while the user interface remains rather informal and possesses important quality attributes.
12
Soylu et al.
OptiqueVQS is intentionally limited in expressiveness to achieve a usability expressiveness balance, for instance unions, cardinality restrictions, intersection, and individuals are not supported. However the future work includes implementation of more features without compromising the usability, such as optionals and inequality relationships for data properties. Acknowledgements. This research is funded by “Optique” (EC FP7 318338), as well as the EPSRC projects Score!, DBOnto, and MaSI3 .
References 1. Dadzie, A.S., Rowe, M.: Approaches to Visualising Linked Data: A Survey. Semantic Web 2(2) (2011) 2. Katifori, A., et al.: Ontology visualization methods - A survey. ACM Computing Surveys 39(4) (2007) 3. Soylu, A., et al.: Experiencing OptiqueVQS: a multi-paradigm and ontology-based visual query system for end users. Universal Access in the Information Society (in press) 4. Catarci, T., et al.: Visual query systems for databases: A survey. Journal of Visual Languages and Computing 8(2) (1997) 5. Giese, M., et al.: Optique: Zooming in on Big Data. IEEE Computer Magazine 48(3) (2015) 6. Leone, S., et al.: Exploiting Tag Clouds for Database Browsing and Querying. In: CAiSE’10. (2011) 7. Soylu, A., et al.: Towards Exploiting Query History for Adaptive Ontology-based Visual Query Formulation. In: MTSR’14. (2014) 8. Soylu, A., et al.: Ontology-based End-user Visual Query Formulation: Why, what, who, how, and which? Universal Access in the Information Society (submitted) 9. Soylu, A., Martin, G.: Qualifying Ontology-based Visual Query Formulation. In: FQAS’15. (2015) 10. Arenas, M., et al.: Faceted Search over Ontology-Enhanced RDF Data. In: CIKM’14. (2014) 11. Ambrus, O., et al.: Visual Query System for Analyzing Social Semantic Web. In: WWW’11. (2011) 12. Hogenboom, F., et al.: RDF-GL: A SPARQL-Based Graphical Query Language for RDF. In: Emergent Web Intelligence. Springer (2010) 13. Barzdins, G., et al.: Graphical Query Language as SPARQL Frontend. In: ADBIS’09. (2009) 14. Haag, F., et al.: Visual Querying of Linked Data with QueryVOWL. In: SumPre’15 and HSWI’14-15. (2015) 15. Heim, P., Ziegler, J.: Faceted visual exploration of semantic data. In: HCIV’09. (2011) 16. Haag, F., et al.: Visual SPARQL Querying Based on Extended Filter/Flow Graphs. In: AVI’14. (2014) 17. Ambrus, O., et al.: Konduit VQB: a Visual Query Builder for SPARQL on the Social Semantic Desktop. In: VISSW’10. (2010) 18. Brunetti, J.M., et al.: From Overview to Facets and Pivoting for Interactive Exploration of Semantic Web Data. International Journal on Semantic Web and Information Systems 9(1) (2013)