Available online at www.sciencedirect.com Available online at www.sciencedirect.com
Procedia Engineering
ProcediaProcedia Engineering 00 (2011) Engineering 15 000–000 (2011) 2301 – 2307 www.elsevier.com/locate/procedia
Advanced in Control Engineering and Information Science
Gear damage detection and diagnosis system based on COM module Renping Shaoa, Wentao Hub, Jingming Caoa,ba* a, b
School of Mechatronics, Northwestern Polytechnical University, Xi’an, Shaanxi, 710072, China
Abstract Empirical Mode Decomposition (short for EMD) based on time scale of local property of signal, is a self-adaptive signal disassembling and a new time-frequency analysis method. Using EMD and combining with the advantages of MATLAB and VC + +, a virtual instrument system of gear damage detection and diagnosis is developed by a mixed programming method. The interface is designed by VC + +, the calculation of test data, signal processing and graphical display are completed by MATLAB. Using COM module technology, it calls the *.m file conversion program in VC++. A different kind and multifunctional gear fault diagnosis software system is successfully empoldered, which possesses some functions, including the introduction of gear vibration signals, signal processing, feature extraction, graphics display, fault detection and diagnosis. Based on the validation of testing results, the system can be effectively used to detect damage and diagnose fault for gear system, and the proposed system can be to realize the function of Virtual Instrument. Thanks to using COM module technology, the expansion of systemic capabilities and software upgrades become much easier.
© 2011 Published by Elsevier Ltd. Open access under CC BY-NC-ND license. Selection and/or peer-review under responsibility of [CEIS 2011] Keywords: Virtual Instrument(VI), Empirical Mode Decomposition(EMD), COM module, Interface, Mixed programming ;
1. Introduction Virtual Instrument (short for VI) which has made use of the intelligent functions of computer such as computing, storage, playback, call, display and document management, complex information processing, * Corresponding author. Tel.: +0-000-000-0000 ; fax: +0-000-000-0000 . E-mail address:
[email protected]
1877-7058 © 2011 Published by Elsevier Ltd. Open access under CC BY-NC-ND license. doi:10.1016/j.proeng.2011.08.431
22302
Renping Shao et Procedia al. / Procedia Engineering 15 (2011) 2301 – 2307 Renping Shao, et al/ Engineering 00 (2011) 000–000
is a combination of computer and instrument. It achieves the specialized function of traditional instrument by software. The new instrument whose appearance and function are completely identical with the traditional hardware instrument fully utilizes the computer intelligence resource [1, 2]. At the present time, a gear transmission is one of primary driving-forms in mechanical transmission. When system component appears damage and failure, it will affect the safety and reliability of the system, especially the serious failure can lead to disastrous accidents. Therefore, the condition monitoring and fault diagnosis for gear system has important significance [3]. Empirical Mode Decomposition (EMD) based on the local characteristic time scale of the signal, which can decompose the signal into several intrinsic mode functions (IMF), each decomposed IMF highlights the local characteristic of the signal. Through analyzing IMF, we can more accurately and effectively grasp the characteristic information of the original data. In addition, the frequency component contained by each IMF is not only related with the sampling frequency, and more importantly, it also changes with the change of the signal itself. Therefore, EMD radically getting rid of the limitations of Fourier transform, is a self-adaptive time-frequency local analysis and very suitable for analysis of nonstationary and nonlinear processes [4]. Studying denoising problems of failures in feature extraction process of gear system by combining EMD and wavelet threshold denoising, and giving prominence to characteristics of fault signal using the combination of EMD and Higher Order Cumulant (short for HOC) for denoising, the both are effective method for gear fault diagnosis [5]. Therefore, this paper will develop the main program of gear failure analysis software based on virtual instrument technology platform by combining the advantages of MATLAB and VC + +. 2. EMD algorithm theory For any real signal s(t), firstly, determine all maxima and minima points of s(t), and then all maxima and all minima points are connected by two smooth curves which are respectively called as the upper envelope and the lower envelope up, all the signals are included in between the upper envelope and the lower envelope. Calculated the average value of two curves, denoted as m1(t), with s(t) minus m1(t), obtain: S(t)-m1(t)=h1(t)
(1)
Consider h1 (t ) as original signal, repeat the steps described above, obtain: h1(t)-m1,1(t)=h1,1(t)
(2)
Repeat screening k times, until the h1, k(t) becomes a IMF. The first IMF from original signal was denoted as c1(t)=h1,k(t)
(3)
The shortest cycle or the most elaborate components of the signal are included in c1(t). c1(t) is subtracted from the original signal, the first order remaining signal r1(t) is obtained s(t)-c1(t)=r1(t)
(4)
Considering r1(t) as a new original signal, repeat the above process, then it can get a second-order IMF, ..., the N-order remaining signal. The change of rN(t) is small enough or rN(t) is a constant. From N the above decomposition, we can obtain: s (t ) = cn (t ) + rn (t ) (5) =1 Where, ncn(t) is the n-th IMF, rn(t) is the signal remaining after obtained n IMFs by decomposition, which often represents the direct current (DC) component or trend of signal. Any one signal s(t) can be
∑
Renping et et al.al/ Procedia – 2307 Renping Shao Shao, / ProcediaEngineering Engineering1500(2011) (2011)2301 000–000
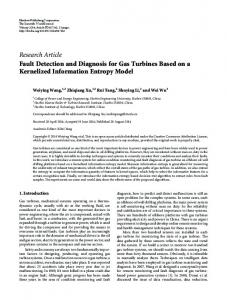
decomposed into n intrinsic mode functions and one residual rn(t). Usually, The most distinct and important information of the original signal is often focused on the first few IMFs obtained by EMD method. By engineering experience, the noise generally distributes in the high-frequency component of signal. Combining the EMD and wavelet threshold denoising, let the wavelet threshold denoising only to act on the high-frequency IMF components rather than the whole signal, which largely overcome the defect of directly wavelet threshold denoising to better highlight the fault characteristics of signal[6], thus effectively identifying different types of faults in low speed conditions. The signal detected by mechanical fault diagnosis often contains all kinds of noise, signal to noise ratio is very low. High Order Cumulant (HOC) spectrum has many important properties, such as generally complex value, with phase and amplitude information, with a double periodicity and symmetry. According to the analysis of these properties, it’s known that the High Order Cumulant spectrum which contains both amplitude and phase information of signal is not sensitive to Gaussian noise [7, 8]. IMF1, IMF2 and residual r3 will be obtained when signal is partly EMD decomposed. IMF1 mainly contains the high frequency information of signal; IMF2 mainly contains intermediary frequency information of signal; residual r3 mainly contains low frequency information of signal. Using three order cumulant spectrum to separately analyze three components, it can obtain three different level three order cumulant spectrum of the high frequency, intermediary frequency and low frequency of original signal. Since the EMD decomposition improves quality of the curve fitting and reduces the end point effect, the good intrinsic mode functions will be obtained, then the frequency related to fault characteristics of the signal and other frequencies have been stripped, in addition, because three order cumulant spectrum effectively suppresses the random noise, it will get a good show of fault feature to lay the foundation for fault diagnosis [9, 10]. 3. Development of detection and diagnosis system 3.1. Data acquisition system Testing system diagram shown in Figure 1. The system running is driven by the motor, through the coupling, the motor will transfer power to the gears of reducer, through the gear coupling, torque and speed sensors, and the power is passed to the magnetic loader. In the gear box, the driving gear 4 is failure gear to test, the YD series acceleration sensors are installed on the gears, The acceleration sensors which are used to pick up vibration signal of the gears, are respectively installed on failure gear and driven gear, in test, the sensors are installed in the symmetry places of the gear fault, shown in 5 of figure. When test, using controlling cabinet to observe the sensors of torque and speed, we adjust the motor speed to get the required output speed. The system speed is divided into four levels: 300rpm, 900rpm, 1200rpm and 1500rpm. By magnetic loader 9, the actual load of the system will be adjusted.
1 Motor; 2 Axis; 3 Motor coupling; 4 Driving gear; 5 Acceleration sensor; 6 Driven gear; 7 Gear coupling; 8 Torque and speed sensor; 9 Magnetic loader; 10 Bearing support Fig. 1. Testing equipment of gear system
2303 3
42304
Renping Shao et Procedia al. / Procedia Engineering 15 (2011) 2301 – 2307 Renping Shao, et al/ Engineering 00 (2011) 000–000
3.2. Mixed programming of MATLAB and VC + + using COM module technology MATLAB taken matrix as the basic data structure is very suitable for large scale numerical calculations. However, MATLAB is an interpreted language, so its execution speed is relatively slow. C + + is a compiled language, after being compiled, the program taken as binary code will be executed, so its execution speed is quite high, and this advantage will become more obvious when perform the multilevel nested loops operation. However, Visual C + + does not like MATLAB is good at achieving complex numerical calculation, therefore, this paper effectively combines the advantages of MATLAB and Visual C + +. The key thought of module is that an application system is cut into many modules with a certain independence of function. When the exploitation of all components are completed, put them together to get the complete application system, through the interfaces, the components interoperate with each other to co-work. When to need change, we will not change the whole system but change the affected components to reassemble the new upgrade software meets our needs. COM is short for component object module, it is a common object interface. According to the interface standard, any language can call it. Com Builder released in Matlab6.5 can change program written in MATLAB into COM components for other languages call. The method is simple and versatile, any function of MATLAB can almost be used (Note: COM does not support script files that we need turn into function to use). According to the characteristics of the system developed in this paper, the COM module technology is choosed for exploitation system, which changes the procedures of each signal analysis and processing algorithm written in MATLAB into COM components. After completion of system exploitation, when a better signal analysis and processing algorithms appears, we can simply update or add the relevant modules. 3.3. Construction of System The software, which could be run without MATLAB software environment, can be developed by COM module technology. There, VC + + is responsible to open the document and for the main interface, and MATLAB is responsible for numerical computation, signal processing, graphics display and other functions. The *.m file can be converted into DLL that VC + + can call by MATLAB Builder for COM, and finally the development of system is completed. The system, which has a number of functional interfaces, chiefly includes: the main function interface; the various interfaces of gear vibration signal analysis; the various interfaces of gear vibration signal diagnosis and identification; the interfaces of gear vibration signal detection and monitoring. Each interface includes corresponding sub-interface with analysis and diagnosis function, as shown in figure 2. 4. Operation of detection and diagnosis system 4.1. Import signal The main interface is shown in figure 3. It mainly introduces the signal acquired from the actual gear transmission testing system in order to facilitate subsequent analysis,identification, and diagnosis. The top column is used to show the physical address of imported data; “ChannelNum” is used to set the total channel number of data files; “Channel” is used to set the channel sequence of imported data; “DataLength” is used to display imported data length; “Fs (Hz)” is used to set the sampling frequency. If the data format is correct, the graph-displayed frame will display the waveform of the imported data. The right buttons are used for signal processing, calculation and analysis, feature extraction, identification and diagnosis etc.
Renping et et al.al/ Procedia – 2307 Renping Shao Shao, / ProcediaEngineering Engineering1500(2011) (2011)2301 000–000
Fig. 2. Structure of software system
Fig. 3. The main interface of software and the display of interface after importing data
4.2. Signal analysis and processing Signal processing and analysis include six buttons of “Analyse1” 、 “Entropy” 、 “Cluster” 、 “T_Analyse”、 “F_Analyse”、 “Nonlinear Analyse&Diagnose”. Clicking these buttons will pop up the corresponding sub-windows, in which signal analysis and processing functions and graphics will be realized. The following will only describe in detail the functions of “Nonlinear Analyse & Diagnose”, the button is used for the realization of data analysis and diagnosis of nonlinear systems. Clicking it can pop up a new window of “nonliear analyse”, there are five function buttons of “EMDto3floor”; “remove noise”; “EMD-HOC”; “ShortTimeFT” and “Freq-Energy” on it. By clicking “EMDto3floor” button, three levels EMD decomposition of the original signal is achieved, pop up the windows as shown in figure 4. At this point “remove noise” button has been activated, this button is used to realize the original signal denoising, and activate “Short Time FT”, “Freq-Energy” buttons. Clicking it can pop up “Signal Removing” windows as shown in figure 5, the window displays the original signal, noise and denoising signal. Clicking “Short Time FT” button can pop up “Short Time FT” windows as shown in figure 6, the window shows the short time Fourier transform of denoising signal. Clicking “EMD-HOC” button can pop up “EMD-HOC” windows as shown in figure 7. The windows show two-dimensional drawings and three-dimensional drawings of three-order cumulant spectrum of the original signal which was decomposed into three levels by EMD. Clicking the “Freq-Energy” button can pop up “Displaying Energy of Every Frequency band” windows which display the wavelet packet energy distribution of denoising signal, only mention one figure 8. 4.3. Fault identification and diagnosis Signal diagnosis includes “Diagnose1”, “Diagnose2”, and “Diagnose3”. The following only introduces the function of “Diagnose1”. Neural network algorithm is used to train and identify imported data, finally, to get the fault type of imported data. Producing the data sample, training data sample, introducing trained weight, diagnosing and getting test result can identify three faults of tooth root crack, tooth top crack, tooth face abrasion.
2305 5
62306
Renping Shao et Procedia al. / Procedia Engineering 15 (2011) 2301 – 2307 Renping Shao, et al/ Engineering 00 (2011) 000–000
Fig. 4. Three levels EMD decomposition of fault signal of tooth root short crack in 300 rpm
Fig. 6. STFT of fault signal of tooth root short crack in 300 rpm
Fig. 8. Frequency band energy of fault signal of
Fig. 5. Denoising of fault signal of tooth root short crack in 300 rpm
Fig. 7. Cumulant spectrum of fault signal of tooth root short crack in 300 rpm
Fig. 9. Interface of diagnosis
tooth root short crack in 300 rpm
After the “Diagnose1” button is clicked, a new window as figure 9 appeared. In the new window, it should be set the corresponding parameters. “StartPT” is the starting position of the interception segment, “SampLen” is the data length of each piece, “SampNum” is the number of data segment; Select the training sample fault type in the drop-down menu including three kinds: crack at tooth root, crack at teeth top and tooth face abrasion; Select “New” if create a new sample file, select “Old” if add samples into old sample files; “BlockNum” and L are same to the part above; P is time-serial model order; “Variance” is used to show time-serial analysis error. After the setting is finished, click the “MakeSamps” button, a save location window of the created samples pop-up to select store directory in it, and then click “OK” in the following window. The creation of sample is complete after clicking “OK” button in the prompt window. Then, click “Train” button, select the created sample to train. After training is completed, click
Renping et et al.al/ Procedia – 2307 Renping Shao Shao, / ProcediaEngineering Engineering1500(2011) (2011)2301 000–000
“GetWeight” button, select the trained weight, and finally click the “Diagnose” button to get the diagnostic results. As shown in the figure 9. 5. Conclusions Exploitation and operation of the detection and diagnosis system show that mixed programming of MATLAB and VC + + using COM module technology has great advantages in the virtual instrument development process. In a large context of system framework, each person accomplishes the exploitation of different modules to improve the efficiency of development; it need not modify the whole system to achieve software upgrade. It also shows that the system can effectively analyze and diagnose fault of gear system, and the proposed system can be effectively used in engineering diagnosis of different faults for gear system. Acknowledgments This research is sponsored by the Natural Science of China (NSFC) (Grant No.50575187), the fund of Chinese aviation science (01I53073), the fund of Natural science of Shaan xi province in China (2004E219) and the graduate carve out seed fund of Northwestern Polytechnical University (Z2011079). References [1] Shao Renping, Liu Hongyu. Research of Virtual Instrument System in Fault Diagnosis Based on HOC[J]. Chinese Journal of Science Instrument, 2008, 29(1): 5-10 [2] Shao Renping, Huan Xinna, Hu Junhui. Analysis of data mining of clustering and its application to mechanical transmission fault diagnosis[J]. Journal of Aerospace Power, 2008, 23 (10): 1933– 1938 [3] Markus Timusk, Mike Lipsett, Chris K. Mechefske. Fault detection using transient machine signals[J] Mechanical Systems and Signal Processing, 2008, 22(7) : 1724–1749 [4] Wlliams W J,Zalubas E J. Helicopter transmission fault detection via time-frequency, scale and spectral methods[J]. Mechanical Systems and Signal Processing, 2000, 14(4):25-30 [5] Li Zhenxing, Xu Hongzhou. Research of Method of Wavelet Threshold Denoising Based on EMD[J]. Computer Simulation, 2009, 26(9):325-328 [6] Yu DJ, Yang Y and Cheng JS. Application of time-frequency entropy method based on Hilbert-Huang transform to gear fault diagnosis[J]. MEASUREMENT, 2007, 40(9-10): 823-830. [7] J. Rafiee, F. Arvani, A. Harifi, M.H. Sadeghi. Intelligent condition monitoring of a gearbox using artificial neural network[J]. Mechanical Systems and Signal Processing, 2007, 21(4): 1746–1754. [8] de la Rosa, Juan José González. Higher-order cumulants and spectral kurtosis for early detection of subterranean termites[J]. Mechanical Systems and Signal Processing, 2008, 2(22):279-294 [9] Shao Renping, Liu Hongyu, Xu Yongqiang. Fault Detection and Diagnosis of Gear System Based on Higher Order Cumulants[J]. CHINESE JOURNAL OF MECHANICAL ENGINEERING, 2008, 44(6): 161-168. [10] Renping shao, Yonglong Li. The Application of CI-based Virtual Instrument in Gear Fault Diagnosis. The 3rd International Conference on Intelligent Information Technology Application (IITA2009), November21-22, 2009, Nanchang, China, IEEE Computer Society press: 190-193.
2307 7