Abstract: Many researchers have been studying the feasibility of using Artificial Neural. Networks (ANN) in structural health monitoring and damage detection.
NEURAL NETWORK BASED DAMAGE DETECTION USING A SUBSTRUCTURE TECHNIQUE Norhisham Bakhary, Hong Hao, Andrew J. Deeks School of Civil and Resource Engineering, The University of Western Australia, AUSTRALIA
Abstract: Many researchers have been studying the feasibility of using Artificial Neural Networks (ANN) in structural health monitoring and damage detection. It has been proven by both numerical simulation and laboratory test data that ANN can give reliable prediction of structural conditio ns. The main drawback of using ANN in structural condition monitoring is the requirement of enormous computational effort. Consequently almost all the previous work described in the literature limited the structural members to a small number of large e lements in the ANN model. This may result in the ANN model being insensitive to local damage, especially when this local damage is small. To overcome this problem, this study presents an approach to detect small structural damage by using ANN progressively. It uses the substructure technique together with a two-stage ANN to detect the location and extent of the damage. It starts by dividing the structure into a few substructures. The condition of each substructure is examined. Those substructures with condition change identified are further subdivided and their condition examined. By doing this progressively, the location and severity of low level structural damage can be detected. Modal parameters such as frequencies and mode shapes are used as the input to the ANN. To demonstrate the effectiveness of this approach, a two-span continuous concrete slab structure is used as an example. Different damage scenarios are introduced by reducing the local stiffness of the selected elements at different locations along the structure. The results show that this technique successfully detects simulated damage in the structure.
1 Introduction Damage assessment using vibration based data has received great attention for the last three decades. Since the early work by Cawley and Adam [1], dynamic parameters such as natural frequencies and mode shapes have been widely used for damage detection. Various methods have been researched and developed to produce an effective and accurate system to locate damages and estimate the damage severities in structures using those parameters. The rapid development of computer technologies has further enhanced the research and application of these methods in damage detection. The Artificial Neural Network (ANN) method is one technique that has been intensively studied. The ability of ANN to approximate continuous functions and pattern classification provides an efficient mechanism to detect damage from modal parameters. The basic idea of ANN applications in damage detection is to build a model to provide a relationship between modal parameters and structural parameters through a training process. Once the relationship is established, the trained ANN model is then capable of detecting damage from modal data. The success of ANN applications in damage detection using vibration parameters in civil structure was initiated by Wu et. al.[2], and since then has drawn considerable attention. Many studies have reported the great potential of ANN for damage detection [3-7]. Many successful applications of ANN to damage detection in numerical and laboratory structure models have been reported. Most of them have been limited to example structures with small number of degrees of freedom, and the damage levels have been quite significant. For example Zhao et. al.[8] used ANN to identify damage of a nine meter beam with 18 elements. The damage was introduced as a stiffness reduction of 15% to 45% of the original stiffness value of each element. Chang et. al [5] employed ANN to detect damage in an eightelement RC beam. The damage considered was stiffness reduction of 10% to 25% of design stiffness values in each element. Pandey and Barai [9] applied ANN to detect damage in a 0.5 meter long 21 -bar truss bridge model. The damage scenarios considered were formed by reducing the cross sectional area of one or a few truss members.
Examples of successful identification of local damage in structures by ANN are quite limited. This because detecting local damage in a structure may require a fine finite element mesh with large number of elements. In this situation, the use of a one-stage ANN model results in a high dimension network. The main drawback of such a one-stage ANN is the requirement of excessive computational time and computer memory to train the ANN model. The computational time and computer memory increase dramatically with the increasing number of structural degrees of freedom. Therefore, in most examples, rather large elements are used in structure model to reduce the degrees of freedom. Since a large element is insensitive to a small damage, severe damage scenarios are usually applied to demonstrate the ANN model. Several attempts have also been made to apply ANN to complex structures with high degrees of freedom. In those cases, the structures are divided to a small number of segments. Each segments consists of several elements [10-12] and all the elements within the same segment are assumed to have the same material properties. This simplification reduces the number of variables and makes training ANN model efficient. However, it also makes the ANN model insensitive to small local damage, and therefore reduces its ability to provide reliable structure damage detection. To overcome the difficulties discussed above, Yun and Bahng [13] developed a technique to identify damage in probable damage areas using a substructure technique. However, early and sometimes subjective judgement using conventional technique such as visual inspection is required to select the probable damage area. To improve this method Ko et. al. [14] has developed a three-stage identification technique. In their study, a novel technique utilizing auto associative neural network is used in the first stage to identify the existence of damage in the structure, followed by combination of modal curvature index and modal flexibility index to identify the damage area in the second stage. Once the probable damage area is identified an ANN model is used to determine the damage location and severity in the third stage. The disadvantages of this method are, i) the novel detection approach used in the first stage may not be sensitive enough to trigger the alarm for damage existence, as shown in two of the twelve cases analysed in the study; ii) modal curvature index and modal flexibility index are sometimes unable to provide accurate identification especially when damage is near the support area, as demonstrated in the study; iii) if the damage occurs in multiple areas, expensive computatio n is still required in the third stage to train ANN model as the number of areas that contain damage increases. This study presents a new approach to detect local structural damage using Artificial Neural Networks (ANN). It uses the substructure technique together with a two-stage ANN model. It first divides a structure into a few substructures. The ANN model is trained using the vibration properties of the structure and those of the substructure. Any change in the properties of each substructure will be identified. Those substructures with changed properties will be further divided into smaller substructures and the ANN model trained again to identify the changes. This process can be repeated to further divide the substructure, until the damage location and severity is clearly identified. To demonstrate the efficiency and reliability of this proposed method, a two-span concrete slab with various numerically simulated damage scenarios is used as an example. The damage cases considered include single and multiple damage areas of various severities.
2 Methodology 2.1 Substructure method Several studies are reported in employing the substructure technique for structural identification. Oreta et. al.[15] demonstrated the use of the substructure technique to identify the physical characteristics of a fra me element with an extended Kalman filter. Koh et. al. [16] proposed a tec hnique using a genetic a lgorithm together with substructure approach for structural identification. Recently, Yuen and Katafygiotis [17] presented a probabilistic substructure identification and health determination for linear systems. In this study, the substructure technique is applied together with ANN to identify local damage. This is done by dividing the full structure to several substructures. By doing this, each
substructure can be re presented by one ANN model, and thus the ANN models can be trained separate ly. This substantially reduces the number of unknowns in one ANN model. In this study, the full structure and every substructure are individually analysed using finite element method. Every substructure is analysed by assuming clamped boundary condition at both the left and right ends. By using the ANN, the relationship between modal parameters of full structure and substructures can be obtained, and so the condition of substructures can be examined from frequencies and mode shapes of the full structure.
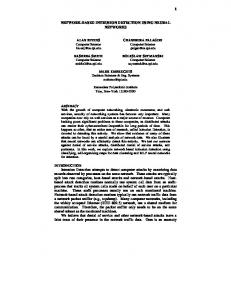
2.2 ANN model A two -stage ANN system is proposed in this study. Figure 1 depicts the basic structure of the system. Frequencies and mode shapes of the full structure
Frequencies of substructures PRIMARY ANN
. .
Location & damage severities Mode shapes of substructures
SECONDARY ANN
. . .
Figure 1: Structure of the two-stage ANN
The ANN model in the first stage is referred as the primary ANN and the second stage ANN is referred as the secondary ANN. The primary ANN is used to identify the substructures that have suffered damage, while the secondary ANN identify the damaged elements and estimate the damage severities. The primary ANN is trained to relate the frequencies and modes shapes of full structure and the frequencies of every substructure. Once the relationship is established, the ANN model can be used to estimate the frequencies of each substructure from modal parameters of the full structure. The substructures that suffer damage can be identified from its frequency change. In this study, the frequency change index (FCI) is defined as:
FCI = 1 − ( i
F ji ' F ji
)2
(1)
where Fi• and Fi are the frequency of interest and undamaged frequency of the ith substructure respectively, and j is the mode number. In the secondary ANN model, each substructure with significant frequency change will be represented by an independent ANN model to predict the E values (Young’s modulus) of the elements in this substructure. The output of primary ANN model is used together with the mode shapes of the corresponding substructure as the input variables. The change of the stiffness parameter or the damage severity for each element is denoted by a Stiffness Reduction Ratio (SRF), defined as:
SRF = 1 −
E' E
(2)
where E is the Young’s modulus in the intact state and E• is that of the damaged state.
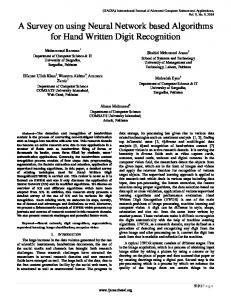
2.2.1 Design of primary ANN As mentioned above, the primary network is designed to predict the frequencies of every substructure from modal parameters of full structure. One ANN model is trained to relate the frequencies of the full structure to one modal frequency of all the substructures. The number of ANN models required depends on target number of modal substructure frequencies selected. The input variables are modal frequencies and mode shapes of the full structure. Outputs are modal frequencies of substructures. Figure 2 shows the structure of the primary ANN. λf 1 λf i φf 1 φf i λf 1 λf i φf 1 φf i λf 1 λf i φf 1 φf i
NN1
λs11 λ s j 1
NN2
λs 12 λs 2j
NNn
λs 1n λs nj
Figure 2: Schematic diagram for primary ANN
In the figure, n ANN models (NN1,NN2,…NNn ) are used to estimate n modal frequencies of j substruct ures ( λs n ) from the frequencies ( λf i ) and mode shapes ( φf i ) of the full structure. Subscript i refers to mode number and superscript j the substructure number. To deal with dimensionality problem in ANN model, not all the mode shape points are used in the input. Only selected points are used to represent the full structure mode shapes. j
Damage cases for training are generated based on Latin hypercube sampling [18]. The responses for the full structure and the substructures are computed using finite element analysis. The same material properties are applied for the full structure and the corresponding substructures, and hence any changes of condition in full structure will change the condition of the corresponding substructure. A multilayer backpropagation neural network with one hidden layer is used to train the ANN in this stage. Sigmoid functions are employed as non-linear activation functions for all layers. The ANN models are trained using Levenberg Maquardt (trainlm) algorithm with early stopping method to reduce the possibility of overfitting. The performance of training is measured using mean square error (MSE).
MSE =
1 n (O t − O p ) 2 ∑ n j =1
where Ot and Op are the target and predicted outputs. n is the number of data.
(1)
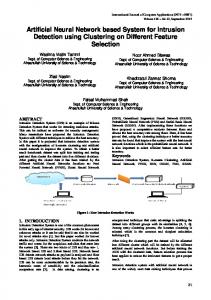
2.2.2 Design of secondary ANN The secondary ANN is used to predict the location and the severity of damaged elements in the substructure that is identified by the primary ANN. The input variables are the frequencies and mode shapes of the identified substructure. The frequencies are received fro m the primary ANN and the mode shapes are measured at nodes in the corresponding substructure. To train the ANN model, a new set of damage cases are generated using Latin hypercube sampling involving only the identified substructure. The responses of those cases are calculated in terms of full structure modal parameters. The calculated modal parameters are then presented to primary ANN to produce the frequencies of the substructure. This reduces the influence of error propagation from the primary ANN. The generated frequencies are then combined with the mode shapes to form a set of input variables for the secondary ANN. Figure 3 depicts the structure of the secondary ANN for substructure j. The input variables for ANN model (NNj) in the figure are modal frequencies
( λ1j ... λnj ) and mode shapes ( φs1j ...φsnj ) of substructure j, and the output variables are the E j
j
values of m elements in substructure j ( E 1 ... E m ). If more than one substructure is involved, each of them is represented by a different ANN model. These ANN models can be designed independently. Output of primary ANN
λ s1j j λ s n
NNj
φs1j φs nj
From Finite element analysis of full structure
E 1j E j m
Figure 3 Schematic diagram for secondary ANN
The same training scheme as in the primary ANN applied to this stage. Once trained, the ANN model is able to estimate the severities of the damaged elements in the substructures.
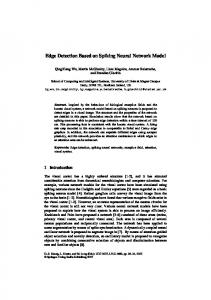
3 Numerical example A two -span concrete slab with dimensions of 6400mm x 800mm x 100mm (shown in Figure 4) is used as an example. The boundary condition is idealized as pin supports at the middle span and at 200mm from left and right end of the slab. The material properties are : E = 3. 2 × 10 N / mm , ρ = 2.45 × 10 kg / m , v = 0.2 . The finite element model of the slab consisted of 57 nodes and 32 shell elements. Figure 5(a)-(b) shows the slab mesh together with the assigned node numbers and element numbers. 10
2
3
3
200mm
3000mm
200mm
800mm
3000mm
Figure 4: Dimensions of the slab
1 4
7
10
13
16
8
11
14
17
2 5
3 6
9
12
15
19
22
20
18
23
21
25 26
24
28 29
27
200mm
31 32
30
34 35
33
37 38
36
40 41
39
42
43 44
46 47
45
48
49 50
51
52 55 53
56
54 57
200mm
375mm@16
a: Finite element mesh with node numbers
1 2
3 4
5 6
7
9
8
10
11 12
13
15
17
19
21
23
25
14
16
18
20
22
24
26
27 28
29 30
31 32
b: Finite element mesh with element numbers
Figure 5: Finite element mesh The modal analysis is conducted using the finite element method. It is assumed that the mode shapes are measured at every node. The four damage scenarios listed in Table 1 are simulated to assess the ANN performance. The damage scenarios are imposed by reducing the E values of the corresponding elements in the substructures by 5% to 15%. For scenarios 1, 2 and 3 the damage is applied to elements in substructure 2 with varying levels of severity, while for scenario 4 the damage is applied to substructures 2, 4 and 6. For comparison, damage identification is a lso performed using an ANN technique with a conventional approach. In this study, the term ‘conventional approach’ refers to the ANN technique where the structure is divided into several segments and every element within the same segment is assumed to have the same material properties. Table 2 lists the first three frequencies for these simulated damage scenarios.
Table 1: Damage scenarios
Scenario
Element number
1
7 8 7 8 5 6 7 8 9 10 5 6 7 8 9 10 15 16 17 18 23 24 25 26 27 28
2 3
4
E value 0.90 × 0.90 × 0.85 × 0.85 × 0.85 × 0.85 × 0.85 × 0.85 × 0.85 × 0.85 × 0.90 × 0.90 × 0.85 × 0.85 × 0.90 × 0.90 × 0.90 × 0.90 × 0.90 × 0.90 × 0.95 × 0.95 × 0.90 × 0.90 × 0.95 × 0.95 ×
Substructure
E E E E E E E E E E E E E E E E E E E E E E E E E E
2 2 2
2,4,6
Table 2: First three frequencies of the damage scenarios Undamaged 18.220 28.496 72.847
Mode 1 Mode 2 Mode 3
Scenario 1 18.102 28.342 72.755
Scenario 2 18.033 28.255 72.701
Scenario 3 17.721 27.939 71.904
Scenario 4 17.624 27.337 71.701
3.1 Conventional ANN Approach The slab is divided into seven segments as shown in Figure 6, and all the elements within the same segment are assumed to have the same material properties. An ANN model is used directly to relate the modal parameters to E values of each segment. For this case, the first three modal frequencies and mode shapes are used as the input variables and the E va lues of each segment are the output variables. Segment 2
1 2
3 4
Segment 1
5
7
9
6
8
10
Segment 4
11 12
13 14
Segment 3
15 16
17 18
Segment 6
19
21
20
22
23 24
Segment 5
25 26
27
29
31
28
30
32
Segment 7
Figure 6: Segmentation of the slab
To train the ANN model, 500 damage scenarios are created by applying damage to each segment based on the Latin hypercube sampling method [18]and responses for all these scenarios are computed using finite element analysis. To apply the early-stopping method,
450 damage cases are used for training and the rest are used for validation. ANN model with one hidden layer is used; the numbers of hidden nodes are obtained through a trial and error process. The model is trained using Levenberg Marquardt algorithm (trainlm), and the best ANN model obtained is with 19 hidden nodes. The training stopped at 42nd epoch and the final MSE obtained for training and validation are 0.00098 and 0.00105 respectively which indicate that the ANN is well trained. After that, the trai ned model is used to detect the simulated damage scenarios. Figure 7 shows the ANN prediction results. Scenario 2
Scenario 1 0.5 0.5
0.4
0.4
0.3
SRF
SRF
0.3 0.2
0.2 0.1
0.1
0
0 1
2
3
4
5
6
1
7
2
3
5
6
7
Segment
Segment
Scenario 3
Scenario 4
0.5
0.5
0.4
0.4
0.3
0.3
SRF
SRF
4
-0.1
-0.1
0.2 0.1
0.2 0.1
0
0
1
2
3
4
-0.1
5
6
7
1
2
3
4
5
6
7
-0.1
Segment
Segment
Actual damage segment
Figure 7. ANN prediction results for conventional ANN approach
The results show that all the segments that suffer damage are successfully identified. However, the actual damaged elements and the actual severities cannot be obtained. In fact, because this technique assumes all the elements in each segment have the same E value, it tends to average out the damage among all the elements. Therefore, it underestimates the damage as shown in Figure 7, and is insensitive to small damage levels.
3.2 Damage detection using substructure technique To apply the proposed approach, the same segmentation as in Figure 6 is applied, and thus 7 substructures are used. In the primary stage, three models (NNM1, NNM2, NNM3) are used to predict the first three modal frequencies of the seven substructures. The input variables used for all the ANN models are frequencies and mode shape values of the first three modes of the full structure. Again, 450 and 50 damage cases are used in training and validation respectively. The responses for all these cases are computed using finite element analysis by applying the same damage cases for full structure and substructures. All the ANN models are trained using Levenberg Marquardt algorithm (trainlm). Table 3 shows the ANN models, together with training and validation performance in terms of mean squared error (MSE). From the table, it is observed that the MSE values for training and validation is low for all ANN models, indicating that the relationships between modal parameters of full structure and frequencies of substructures are relia ble. Once the ANN models are trained, the damage scenarios generated earlier are then presented. Figure 8 s hows the results of the primary ANN.
Table 3: Training and validation of ANN models in the primary ANN
ANN model
Architecture
NNM1 NNM2 NNM3
57-20-7 57-20-7 57-20-7
Training performance (MSE 0.0010 0.0009 0.0010
Validation performance (MSE) 0.0029 0.0023 0.0025
Scenari o 2
Scenario 1 0.2
0.2
0.15
0.15 0.1 FCI
FCI
0.1
0.05
0.05
0
0 1
2
3
4
5
6
1
7
2
1st mode 2nd mode 3rd mode
Substructure
4
5
6
7 1st mode
Substructure
2nd mode 3rd mode
Scenario 4
Scenario 3 0.2
0.2
0.15
0.15
FCI
0.1 FCI
3
-0.05
-0.05
0.05
0.1 0.05
0 1
2
3
4
5
6
7
0 1
-0.05 Substructure
1st mode 2nd mode 3rd mode
2
3
4
5
6
7
-0.05 Substructure
1st mode 2nd mode 3rd mode
Figure 8: Results of the primary stage
The results show that the highest FCI values are obtained at substructure 2 for Scenario 1, 2 and 3. For Scenario 4, the highest FCI appeared at substructure 2, 4 and 6. These results show that the substructures that contain damages are correctly detected for all damage scenarios. It is also noticed the FCI values are almost the same when calculated using different modal frequencies for all damage scenarios. In the secondary ANN, the identified substructure is further divided. Only the elements involved in the identified substructure need to be considered as possible damage components in this stage. For scenario 1, 2 and 3, only substructure 2 is involved, and the possible damaged elements are elements 5 to 10. Only one ANN model is used to determine the damage elements and severities (NNS2). For scenario 4, the damaged elements and severities are identified using 3 ANN models in this stage, where every damaged substructure is represe nted by an ANN model. The ANN models involved are NNS2, NNS4 and NNS6 for substructures 2, 4 and 6 respectively. The input variables used are the first three modal frequencies generated in the previous stage, supplemented by mode shapes at all of the nodes in corresponding substructure. For example, the frequencies used as the input variables for substructure 2 a re generated by NNM1, NNM2, and NNM3 in the first stage and the mode shape values are obtained at points 10 to 21. The output variables of every ANN model at this stage are the E values of each element in the corresponding substructure. All the ANN models involved are trained individually using 450 damage cases and validated using 50 cases. The predictions of the ANN models for the four damage scenarios considered in this study are shown in Figure 9(a)-(d).
Scenario 3 (Output of NNS2)
1
1
0.8
0.8
0.6
0.6
SRF
SRF
Scenario 1 (Output of NNS2 )
0.4 0.2
0.4 0.2
0 5
-0.2
6
7
8
9
Element
0
10
5
Prediction
6
7
8
Element
Actual
9
10 Prediction Actual
a: Scenario 1
b: Scenario 2
Scenario 2 (Output of NNS2) 1
SRF
0.8 0.6 0.4 0.2 0 5
-0.2
6
7
8
9
Element
10 Prediction Actual
d: Scenario 3
Scenario 4 1 0.9
Output of NNS2
0.8
Output of NNS6
Output of NNS6
0.7 SRF
0.6 0.5 0.4 0.3 0.2 0.1 0 5
6
7
8
9
10
15
16
17
18
Element
23
24
25
26
27
28 Prediction Actual
d: Scenario 4 Figure 9: Results of the secondary stage
These results show that for Scenarios 1 to 3, NNS2 correctly identified the damaged element and the damage severities in a single substructure. For Scenario 4, all the corresponding ANN models also correctly identified the multiple damage locations. In comparison with the conventional technique, this approach can provide more precise results in terms of damage location and severities. These results indicate that the purposed approach can be used to identify local damage in structure; moreover, this approach also can be used to predict the damage in multiple substructures. The proposed method can also be used to identify damage in complex structures with large degrees of freedom. With increasing structural degrees of freedom, using the conventional ANN approach normally requires an ANN neural network of large dimension. For example, to identify damage in the example analysed in this study, 32 output nodes are involved in the output layer when using one-stage ANN model. Thus to develop a well trained ANN, a large number of nodes are required in the hidden
layer. Increasing the nodes will exponentially increase the size of the weight in the interconnected nodes of the ANN model. As a result, it requires more computational time and computer memory. For a complex structure with a large number of degrees of freedom, the enormous computer requirement and computational cost are prohibitive. Using the proposed substructure method, the size of the ANN models in both stages can be kept small to reduce the needs of computational time and computer memory.
4 Conclusion The study presented a new approach in applying ANN for damage identification. A substructure technique is employed together with a two-stage ANN to detect low level damage in the structure. A comparison with the conventional technique demonstrated the efficiency and reliability of the proposed approach. The results show that by dividing the full structure to substructures and analysing each substructure independently, local damage can be better identified. The proposed approach also can be used to solve the problem of multiple damage locations in multiple substructures. In term of computational needs, the proposed approach is effective in reducing the size of ANN model; as a result the computational effort can be reduced substantially.
References [1] [2] [3] [4] [5] [6] [7] [8] [9] [10] [11] [12] [13] [14] [15] [16] [17] [18]
Cawley, P. and R.D. Adams, The location of defects in structures from measurements of natural frequencies. Journal of Strain Analysis, 1979. 14(2): p. 49-57. Wu, X., J. Ghaboussi, and J.H. Garrett, Use of n eural networks in detection of structural damage. Computers & Structures, 1992. 42(4): p. 649-659. Barai, S.V. and A.K. Pandey, Vibration signature analysis using Artificial Neural Network. Journal of Computing in Civil Engineering, 1995. 9(4): p. 259-265. Worden, K., Structural fault detection using novelty measure. Journal of Sound and Vibration, 1997. 201(1): p. 85-101. Chang, C.C., T.Y.P. Chang, and Y.G. Xu, Structural damage detection using an iterative neural network. Journal of Intelligence Material Systems and Structure, 2000. 11: p. 32-42. Chen, Y.M. and M.L. Lee, Neural networks-based scheme for system failure detection and diagnosis. Mathematics and Computers in Simulation, 2002. 58(2): p. 101-109. Zapico, J.L., K. Worden, and F.J. Molina, Vibration-based damage assessment in steel frames using neural networks. Journal of Smart Materials and Structures, 2001. 10: p. 553 -559. Zhao, J., J.N. Ivan, and J.T. DeWolf, Structural damage detection using artificial neural network. Journal of Infrastructure Systems, 1998. 4(3): p. 93-101. Pandey, A.K., M. Biswas, and M.M. Samman, Damage detection from changes in curvature mode shapes. Journal of Sound and Vibration, 1991. 145(2): p. 321-332. Ni, Y.Q., et al. Vibration-based damage localization in Ting Kau Bridge using Probabilistic Neural Network. in Advances in Structural Dynamics. 2000. Hong Kong. Lee, J., et al., Health-monitoring method for bridge under ordinary traffic loadings. Journal of Sound and Vibration, 2002. 257(2): p. 247-264. Xu, H. and J. Humar, Damage detection in a girder bridge by artificial neural network technique. Computer-aided and Infrastructure Engineering, 2006. 21(6): p. 450-464. Yun, C.-B. and E.Y. Bahng, Substructural identification using neural networks. Computers & Structures, 2000. 77(1): p. 41-52. Ko, J.M., Z.G. Sun, and Y.Q. Ni, Multi-stage identification scheme for detecting damage in cable-stayed Kap Shui Mun bridge. Engineering Structures, 2002. 24(7): p. 857-868. Oreta, W.C. and T. Tanabe, Element identification of member properties of framed structures. Journal of Structural Engineering ASCE, 1994. 120(7): p. 1961 -1976. Koh, C.G ., B. Hong, and C.Y. Liaw, Substructural and progressive structural identification method. Engineering Structures, 2003. 25(12): p. 1551-1563. Yuen, K.V. and L.S. Katafygiotis, Substructure identification and health monitoring using noisy response measurement only. Computer-Aided and Infrastructure Engineering, 2006. 21(4): p. 280-291. Helton, J.C. and F.J. Davis, Latin hypercube sampling and the propagation of uncertainty in analyses of complex system. Reliability Engineering and System Safety, 2003. 81: p. 23-69.