Self-Organizing Maps (SOM) and Particle Swarm. Optimization (PSO) clustering algorithms are investigated. Several aspects of these algorithms are discussed ...
Gene Clustering Using Self-Organizing Maps and Particle Swarm Optimization Xiang Xiao Electrical and Computer Eng. Indiana University Purdue University Indianapolis Indianapolis, IN 46202
Ernst R. Dow Eli Lilly and Company Eli Lilly Corporate Center Indianapolis, IN 46285
Zina Ben Miled Electrical and Computer Eng. Indiana University Purdue University Indianapolis Indianapolis, IN 46202
Abstract Gene clustering, the process of grouping related genes in the same cluster, is at the foundation of different genomic studies that aim at analyzing the function of genes. Microarray technologies have made it possible to measure gene expression levels for thousand of genes simultaneously. For knowledge to be extracted from the datasets generated by these technologies, the datasets have to be presented to a scientist in a meaningful way. Gene clustering methods serve this purpose. In this paper, a hybrid clustering approach that is based on SelfOrganizing Maps and Particle Swarm Optimization is proposed. In the proposed algorithm, the rate of convergence is improved by adding a conscience factor to the Self-Organizing Maps algorithm. The robustness of the result is measured by using a resampling technique. The algorithm is implemented on a cluster of workstations.
1. Introduction Gene clustering methods are essential in the analysis of gene expression data collected over time and under different experimental conditions. Microarray expression data for thousands of genes can now be collected efficiently and at a relatively low cost. Clustering was used, for example, to understand the functional differences in cultured primary hepatocytes relative to the intact liver[1]. In another study, clustering techniques were used on gene expression data for tumor and normal colon tissue probed by oligonucleotide arrays [2]. This latter study was based on the expression data of a collection of 40 tumor
Russell Eberhart Electrical and Computer Eng. Indiana University Purdue University Indianapolis Indianapolis, IN 46202 Robert J. Oppelt Eli Lilly and Company Eli Lilly Corporate Center Indianapolis, IN 46285
and 22 normal colon tissue samples. A two-way clustering algorithm was applied to the data and resulted in a separation of cancerous from non-cancerous tissue and a strong indication that coregulated genes cluster together. Gene clustering techniques were also used to analyze temporal gene expression data during rat central nervous system development [3]. This study was based on the temporal mRNA expression of 112 genes and it established that most of the patterns are clustered into five basic expression patterns. Clustering aggregates similar input patterns into distinct, mutually exclusive subsets referred to as clusters. As stated by Anderberg [4], “the objective is to group the data units or the variables into clusters such that elements within a cluster have a high degree of ‘natural association’ among themselves while the clusters are ‘relatively distinct’ from one another.” Clustering is a two-phase process. In the first phase, the number of clusters in the data is determined or assumed. The second phase assigns each data point (pattern) to a single cluster. Several clustering algorithms such as hierarchical clustering [3,5], Principle Component Analysis based (PCA-based) [6,7], genetic algorithms [8], and artificial neural networks [1,9,10,11], have been used to cluster gene expression data. Particle Swarm Optimization [12] is another computational intelligence method that, to the best of our knowledge, has not been used to cluster gene expression data. In this paper Particle Swarm Optimization is used with Self-Organizing Maps to cluster genes. In Section 2, Self-Organizing Maps and Particle Swarm Optimization are reviewed and the proposed hybrid clustering approach that uses both of these algorithms is discussed. Descriptions of the rat [1] and yeast [13] benchmark data sets that are used in this paper are described in Section 3. Section 4 includes the clustering
result for the proposed hybrid algorithm and a comparison of this result to that of clustering using either SelfOrganizing Maps or Particle Swam Optimization. Related work is the subject of Section 5. Section 6 of this paper summarizes the major findings of this study.
2. Hybrid SOM and PSO Algorithm In this section the advantages and disadvantages of Self-Organizing Maps (SOM) and Particle Swarm Optimization (PSO) clustering algorithms are investigated. Several aspects of these algorithms are discussed including issues dealing with large gene expression data sets and execution time. In addition, two complementary techniques to clustering algorithms, namely conscience and resampling, are also discussed. Finally, the proposed hybrid SOM/PSO algorithm is introduced.
2.1 Self Organizing Maps Self-Organizing Maps (SOM) were introduced in [14]. The foundation of this algorithm comes from the orderly mapping of information in the cerebral cortex. With SOM, high dimensional datasets are projected onto a one- or two-dimensional space. Typically, a SOM has a twodimensional lattice of neurons and each neuron represents a cluster. The adaptation (learning) process of SOM is unsupervised. All neurons compete for each input pattern; the neuron that is chosen for the input pattern wins it. Only the winning neuron is activated (winner-takes-all). The winning neuron updates itself and neighbor neurons to approximate the distribution of the patterns in the input dataset. After the adaptation process is complete, similar clusters will be close to each other (i.e., topological ordering of clusters). Topological ordering helps in detecting both distinct and similar clusters quickly. The SOM algorithm is very efficient in handling large datasets. The SOM algorithm is also robust even when the data set is noisy [15]. However, SOM has a few disadvantages. For example, the number of clusters needs to be specified. As previously mentioned, clustering is a two-phase process: determining the number of clusters and clustering the data. Determining the number of clusters is not trivial since the characteristics of the data set are usually not known a priori. However, as suggested in [16], this can be overcome by running the algorithm with varying numbers of clusters and selecting the most appropriate clustering result according to a figure of merit. SOM has been widely used as a clustering method. In [10], SOM was used to analyze hematopoietic differentiation successfully. In [11], it was used to analyze yeast gene expression data [13], and in [1] it was applied to temporal gene expression analysis of monolayer cultured rat hepatocytes dataset.
2.2 Particle Swarm Optimization Particle swarm optimization (PSO) [12] is an evolutionary computation method. In order to find an optimal or near-optimal solution to the problem, PSO updates the current generation of particles (each particle is a candidate solution to the problem) using the information about the best solution obtained by each particle and the entire population. Each particle has a set of attributes: current velocity, current position, the best position discovered by the particle so far and, the best position discovered by the particle and its neighbors so far. The user can define the size of the neighborhood. There is one version of PSO called global PSO in which all the particles are considered to be neighbors of each other. All particles start with randomly initialized velocities and positions. Then the nth component of the new velocity and the new position for the ith particle are updated by using the following equations:
Vi,n(t +1) = w*Vi,n(t) +c1 *(Gi (t) − Xi,n(t)) +c2 *(li,n(t) − Xi,n(t)) (1) X i ,n (t + 1) = X i ,n (t ) + Vi ,n (t + 1) (2) where w is the inertia weight [17]; c1 and c2 are random numbers, Gi is the best particle found so far within the neighbors and li,n is the best position discovered so far by the corresponding particle. Velocity magnitudes are often clipped to a predetermined maximum value, Vmax. PSO has been applied to several optimization problems. For example, PSO was applied to human tremor analysis [18]. It was also applied to reactive power and voltage control [19], and PSO was used to train neural networks [20]. PSO is effective in nonlinear optimization problems and it is easy to implement. In addition, only few input parameters need to be adjusted in PSO. Because the update process in PSO is based on simple equations, PSO can be efficiently used on large data sets. A disadvantage of the global PSO is that it tends to be trapped in a local optimum under some initialization conditions.
2.3 Conscience The conscience is an auxiliary mechanism for competitive learning [21]. The conscience directs each component that takes part in a competitive learning toward having the same probability to win the competition. Conscience was added to SOM by assigning each output neuron a bias. To become a winner, the output neuron has to overcome its own bias. The conscience is implemented so that the bias is proportional to the frequency that an output neuron wins the competition. First an intermediary parameter yi is calculated for the ith output neuron as follows:
1 ith ouput neuron is the winner y i = th 0 i ouput neuron is not the winner
similarity matrix. A similarity matrix is constructed as follows:
(3)
Then the bias factors pi and the final biases bi are calculated by using the following equations:
(
p = p + B yi − p bi = C (1 / N − pi ) new i
old i
old i
)
(4) (5)
where N is the number of output neurons, and B and C are two parameters that the user selects. These two parameters dictate by how much the winning neuron should be penalized each time. In this paper, B is set to 0.0001 and C is set to 10, while initially bi = 0 and pi = 1/N [21]. In clustering, it is important to have the output of SOM as close as possible to the pattern distribution in the dataset. The purpose of the conscience is to obtain a better approximation of the pattern distribution. Consciencebased competitive learning has also been used in other applications such as modeling, classification, etc. For example, in [22] color images were classified by this method and high classification accuracy was obtained even when regions of the image are very similar in color.
2.4 Resampling One of the major issues in using a clustering algorithm to cluster new and unknown expression data is measuring the robustness of the clustering result. For this purpose, a resampling technique was proposed in [16]. This technique is based on the simple idea that stipulates that if the algorithm is applied to a randomly selected subset of the original set, then patterns that are in the same cluster in the original clustering should also be in the same cluster in the clustering result obtained for the subset if the result is robust. Multiple subsets can be selected randomly and the results of clustering these subsets can be compared to the original clustering result in order to measure the robustness of the clusters obtained. The difference between the clustering based on the randomly selected subset and the original clustering result is measured by a merit function given in [16] which is expressed as follows:
∑∑ (T (µ ) −T )
2
ij
merit =
j
ij
i
No. of patterns in the selected subset (µ )
In Equation 6, T ij
similarity matrix and
Tij
(6)
is an element in the original is an element in the resampled
1 pattern i and j are in the same cluster Tij = 0 pattern i and j not in the same cluster
(7)
The symbols i and j correspond to the indices of patterni and patternj in the similarity matrix for the original clustering and for the clustering after resampling. These indices are preserved among the original data and any subset of the data selected randomly for the purpose of resampling. As previously mentioned, several subsets are selected and processed by the clustering algorithm and the mean value of all the merits calculated for each subset is regarded as the measure for the robustness of the result. The smaller the value of the merit the more robust the algorithm is. This technique can be used in conjunction with any clustering algorithm. Although it does not improve the clustering, it can be used to assess the quality of the result. The method can also be used to estimate the number of clusters needed for a given dataset. Given an unknown data set, several runs of a given clustering algorithm under varying input parameters can be performed. As suggested in [16], if resampling is used with each run, the clustering result of choice is the one with the lowest merit value. As will be shown in Section 4, this can be used to choose an adequate number of clusters when running a clustering algorithm on an unknown data set. One of the major drawbacks of the resampling technique is that it is computationally expensive. There are two important parameters that are associated with this technique: the percentage of the original data that is selected as part of any subset and the number of times the resampling is repeated. As indicated in [16], the subset of the data selected should be close to 60% of the original data. Also, the number of times resampling is performed depends on the percentage selected and the size of the original data set. In this study, we found that for large data sets, resampling should be performed about 100 times, and for small data sets repeating the resampling 20 to 50 times is sufficient. These two parameters are clearly application dependent. However, from the experiment conducted in these studies, it was established that resampling may need to be performed repeatedly on a large number of patterns, which is computationally expensive and sometimes amounts to the running of the original algorithm 50 to 100 times on nearly the same amount of data as the original data. Therefore, the resampling technique was implemented in parallel by using the parallel virtual machine environment (PVM) [23]. In the parallel implementation, the original clustering is performed on the master node. This can be done by using any clustering method. In the case of this study it was PSO, SOM or the proposed hybrid SOM/PSO clustering algorithm. Once this phase is completed, several subsets are selected at
random and the same clustering algorithm is repeated on these subsets using one of the available slave nodes based on a workpool approach. Each slave is assigned a new subset from the workpool when it finishes the subset it is currently processing. For each subset, the merit is calculated by the slave node that is assigned to the subset. The aggregate merit of all the subsets is computed by the master node. Since the clustering of the individual subsets is completely independent, very little communication overhead is incurred by the parallel implementation. This overhead consists of the master node distributing the data subsets and collecting the merit values at the end of the computation. As will be shown in Section 4, this parallel implementation results in significant speedups if resampling is performed a large number of times.
2.5 Particle Swarm Optimization Applied to Selforganizing Maps The proposed hybrid SOM/PSO algorithm uses PSO to evolve the weights for SOM. The weights are trained by SOM in the first stage. In the second stage they are optimized by PSO. In the first stage of the hybrid SOM/PSO algorithm, SOM is used to cluster the dataset. In this stage either regular SOM or SOM with conscience can be used. The SOM normally runs for 100 iterations and generates a group of weights. In the second stage, PSO is initialized with the weights produced by SOM in the first stage. Then PSO is used to refine the clustering process. Each particle consists of a complete set of weights for SOM. The dimension of each particle is the number of input neurons of SOM times the number of output neurons of SOM. The objective of PSO is to improve the clustering result by evolving the population of particles. The global version of PSO was used in this case. The population of particles was set to 40. PSO was run for 20 epochs. The inertia weight was set to 0.4 during all the epochs to emphasize a local search near the weights generated by SOM. The use of SOM followed by PSO was dictated by the fact that SOM is efficient in generating a topological order among the clusters. PSO can then be used to refine this clustering.
3. Experiment Setup The experiments performed in this study focus on evaluating the proposed hybrid SOM/PSO algorithm. The SOM/PSO, the original SOM and the PSO algorithms, were applied to two data sets: the yeast data set [13] and the rat data set [1]. These data sets are described in the next subsections. The execution times for the sequential and the parallel execution times of the algorithms under study were collected on a linux cluster with one master node and four slave nodes. The master node has a PIII 1.2GHz processor and 1024 MBytes RAM. Each slave node has two PIII 1.2GHz processors and 1024 MBytes
RAM.
3.1 Yeast Gene Expression Data The yeast data set [13] consists of 6554 gene expression profiles. Each profile records the fluctuation of expression levels over two cell cycles, which contain 17 time points. Each profile in this data set was normalized to unit length so that the comparisons were made on the basis of shape, i.e., relative heights of each component with each profile. For the standalone SOM, each neuron of SOM was initialized with random numbers. Each profile is fed to SOM and then the best matching neuron and its neighbors are updated such that their distance with respect to the profile is minimized. One epoch is completed when all 6554 profiles are fed to the network. SOM ran for 100 epochs with a time-varying learning rate and a timedecreasing Gaussian neighborhood function. In the standalone PSO, the dimension of each particle equals the number of input neurons multiplied by the number of output neurons. Each particle can be divided into as many segments as the number of output neurons. Each segment represents the centroid of a cluster. Particles were initialized with random numbers. Thus, an original clustering can be obtained by assigning each gene expression profile to the cluster with the closest centroid. The particles are then updated by using equations (1) and (2). For the hybrid SOM/PSO, the first stage is the same as the standalone SOM. After SOM ran for 100 epochs, the weights generated were used to initialize particles in PSO. Then the same process used in the standalone PSO is repeated in the second stage of the proposed hybrid method. The results generated by the three methods are compared in Section 4.
3.2 Rat Hepatocytes Gene Expression Data This gene expression data set is the monolayer cultured rat hepatocytes data set [1]. It contains 4116 gene expression
profiles. Each profile consists of data from five time points (4 hour, 12 hour, 24 hour, 48 hour and 72 hour). The profiles were scaled to –1 and 1 so that the comparisons were made on the basis of the magnitude. All three approaches were applied to this data set by following the same methodology used for the yeast data set.
4. Result For each of the yeast and rat data sets, sixty percent of the entire data set was resampled. The resample process was repeated 20 times. Merits were calculated with respect to each cluster so that the robustness of individual clusters could be investigated. The average merits for each cluster over the twenty times resample were calculated as the final
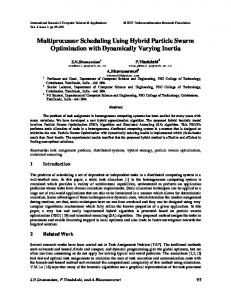
merit of each cluster. Figures 1 and 2 show the average merits over all clusters for a varying cluster sizes for the yeast and the rat data sets, respectively. The average merits reported in figures 1 and 2 are smaller for SOM or SOM/PSO compared to PSO. This indicates that both SOM and SOM/PSO are more robust than PSO. The average merits for SOM and SOM/PSO are comparable. Figures 1 and 2 show that for both SOM and SOM/PSO the 8x8 cluster size corresponds to the knee of the average merit curve. As mentioned previously, this analysis can be used to select an appropriate cluster size. For the above example, 8x8 represents the best trade-off between the robustness and the trivial case where the number of clusters becomes very large for the problem. The 8x8 cluster size was selected for the remainder of the experiments in this paper.
expected that they would cluster together [24]. In this paper both 18srRna and 25srRna genes are identified as srRna genes. There are a total of 39 p450 genes in the rat hepatocytes data set and 40 srRna genes in the yeast data set. If the clustering method works well, those genes should be in the same cluster or in clusters that are close to each other.
(a) 6
7
8
40
Figure 1: The average merit over all clusters for the rat hepatocytes data set for varying number of clusters. 48
56
(b)
Figure 2: The average merit over all clusters for the yeast data set for varying number of clusters.
Figure 3: Left upper (a) and right lower (b) corners for SOM clustering of the rat hepatocytes data set.
The clustering results of the three methods were compared by examining the distribution of p450 genes on the map for the rat hepatocytes data set and srRna genes for the yeast gene expression data set. In isolated hepatocyte cells, it is known that cytochrome p450 expression is decreased over time, and these transcripts have been shown to cluster together [1]. The 18srRna and 25sRna processing proteins are highly expressed and are transcribed together from the same transcript, so it is
In the standalone PSO, p450 genes were part of a large cluster. This cluster contains most of the genes in the rat hepatocytes data set, which indicates that clustering was not adequately performed here. In SOM, most of the p450 genes were included in clusters 54, 60, 62, 63 and 64. Although these genes were distributed across several clusters, these clusters were topologically close to each other. For the SOM/PSO method, most of the p450 genes were included in clusters 6, 7, 8, 14, and 22. These clusters
are also topologically close to each other. In SOM, six p450 genes were included in cluster 63. This cluster had a total of 21 genes. In SOM/PSO, the same six p450 genes were included in cluster 7. This cluster had a total of 24 genes. Cluster 7 of SOM/PSO had three more genes than cluster 63 of SOM. In SOM, these genes were assigned to cluster 62, which is topologically adjacent to cluster 63.
weights and positive weights were grouped together. These two distinct groups of weights were placed on the two corners of the map (left upper and right lower corners for SOM; left lower and right upper corners for SOM/PSO). Actually, if figures 5a and 5b are rotated along the x-axis, they look nearly identical to figures 3a and 3b, respectively. For the standalone PSO, very little similarity exists among nearby clusters, and also there are no apparent distinctions among clusters that are topologically far from each other. 6
7
8
0
8
(a) 6
7
16
8 40
(a) 1
2
3
48
56
(b)
Figure 4: Left upper (a) and right lower (b) corners for PSO clustering of the rat hepatocytes data set. The overall map is of size 8 by 8 cluster. Figure 3a and 3b show the average expression of the patterns in the clusters for the clusters in the left upper corner and right lower corner of the map. For the rat hepatocytes data set, the original size of the map was set to 8 by 8. Figures 3 and 4 show the left upper and right lower corners of the map for SOM and PSO clustering, respectively, in the case of the rat hepatocytes data set. Figure 5 shows the left lower and right upper corners of the map for SOM/PSO clustering also in the case of rat hepatocytes data set. For SOM (Figure 3) and SOM/PSO (Figure 5), the negative
(b)
Figure 5: Right upper (a) and left lower (b) corners for SOM/PSO clustering of the rat hepatocytes data set. Cluster 1 in Figure 3 (SOM) and cluster 57 in Figure 5 (SOM/PSO) contain the genes with the largest positive
magnitude for the first three attributes of the data set. In the case of the SOM/PSO two additional genes are in cluster 57. In SOM one of these genes is in cluster 9 and the other is in cluster 10. Both of these clusters are neighbors as shown in Figure 3. Another interesting case is that of cluster 63 of Figure 3 (SOM) and cluster 7 of Figure 5 (SOM/PSO). In SOM/PSO, cluster 7 contains 21 genes. Three of these genes are in cluster 62 of SOM while the rest are in cluster 63. Clusters 62 and 63 are topological neighbors. For the rat hepatocytes data set, the SOM and SOM/PSO clustering results are essentially similar. Method
SOM PSO SOM/PSO
Cluster number 56 64 36 8 16
Size of the cluster 39 43 6551 30 32
improvement to the SOM algorithm will improve both approaches. Table 2 shows the number of iterations with and without conscience for the SOM algorithm. For both the rat and yeast data set the conscience reduces the number of epochs by more than half.
Number of matches 7 33 40 30 10
Table 1: clustering of srRna genes for the yeast data set. Table 1 shows the distribution of the srRna genes for the yeast data set. The srRna genes were divided across two clusters by the standalone SOM. These two clusters are adjacent on the map. The majority of the srRna genes are in cluster 64, which includes 33 out of the 43 srRna genes. SOM/PSO also generated two clusters for srRna genes, which are topological neighbors. One of the clusters, cluster 8, contains only srRna genes. This indicates that the proposed hybrid SOM/PSO approach results in a better clustering for srRna genes. For the yeast data set, the size of the map was also set to 8 x 8. Figures 6, 7 and 8 show the left-most and the rightmost columns on the map for the three methods. For SOM/PSO, the clusters exhibiting the sine patterns are in the left-most column on the map. Furthermore, the phase of the patterns gradually shifts from the upper cluster to the lower cluster in the column. This was the expected behavior of the data set. SOM also clustered sine patterns in several clusters. However, these clusters were distributed among the left and right columns. The phase shift was missing from the map. The standalone PSO approach generated a map that did not exhibit any of the expected features. In order to investigate the impact of conscience on the speed of convergence, the SOM implementation was modified so that the SOM algorithm terminates when the difference in intra-cluster variance between one epoch and the next is less than 0.0001. The number of epochs that were executed was recorded in the case when the conscience was used and when it was not used. Since the SOM algorithm is part of both the standalone SOM approach as well as the SOM/PSO approach, any
Figure 6: The left most and right most columns for SOM clustering of the yeast data set. Data Set Rat Hepatocytes Yeast
SOM without conscience 540
SOM with conscience 150
450
220
Table 2: Number of epochs for the SOM algorithm with and without conscience. In addition to reducing the number of epochs, SOM with conscience also is more robust than SOM without conscience. Resampling was performed 20 times. The average merits for SOM and SOM/PSO with and without conscience are shown in Table 3.
Data set Rat Yeast
Without conscience SOM SOM/PSO 0.000808 0.000912 0.000717 0.000752
With conscience SOM SOM/PSO 0.000535 0.000544 0.000548 0.000566
takes longer to execute than the sequential version of SOM.
Table 3: The average merit values for SOM and SOM/PSO with and without conscience for the rat hepatocytes and the yeast data sets.
Figure 8: The left most and right most columns for SOM/PSO clustering of the yeast data set.
5. Related Work
Figure 7: The left most and right most columns for PSO Clustering of the yeast data set. The execution times of the parallel implementations of the SOM, PSO and SOM/PSO algorithms with resampling on the rat hepatocytes data set is shown in Figure 9. The parallel implementation of resampling for all three approaches improves execution times and allows robustness to be evaluated for larger data sets and an increased number of patterns in the resampling. The benefit of parallelization is more prominent when the execution time of the original algorithm is long and when the number of resamples increases. Higher speedups are obtained for the standalone PSO and SOM/PSO than the standalone SOM because the sequential version of PSO
In [15], SOM network was compared with hierarchical clustering methods on 252 data sets. These data sets were designed to include data imperfections such as dispersion, outliers, irrelevant information, and nonuniform cluster densities. SOM outperformed hierarchical clustering methods for 191 of the 252 data sets. It was more robust and had higher accuracy. However, when the dispersion of the data set was low or cluster densities varied greatly, SOM was inferior to hierarchical clustering methods. The SOM network did better than, or at least as well as, the best of the seven popular hierarchical clustering algorithms in about 76% of the case tested, and even better with high-dispersion data sets. It should be noted that a conscience was not implemented in the SOM networks used in [15]. Since the number of outputs was limited to the number of known clusters, and linear topology was chosen, the conscience probably would not have been useful. SOM did relatively less well on data sets with low dispersion for which one cluster contained at least 60
percent of the population (and for which there were four or more clusters). This situation is almost never encountered in real-world data sets. Most real life data sets have high dispersion, and a majority of the cluster population is scattered over several clusters. In [25], five clustering algorithms, average linkage hierarchical clustering, k-means, Partitioning Around Medoids (PAM), SOM with the neighborhood radius approaching one and SOM with the neighborhood radius approaching zero were compared. It was found that kmeans and SOM with the neighborhood radius approaching zero generated similar results because the SOM algorithm reduces to k-means if the neighborhood radius is set to zero. It was also found that a larger neighborhood radius in the SOM algorithm increases robustness while sacrificing intra-cluster compactness. The hybrid combination of SOM and PSO proposed in this paper combines unsupervised learning (SOM) and reinforced learning (PSO). It maintains the desirable topological ordering of SOM while generating either a similar clustering (rat hepatocytes data set) or a more refined clustering (yeast data set). This paper extends previous work by adding a second stage to SOM.
execution time(sec)
Number of times resampling is performed = 20
Acknowledgment This work was support in part by Eli Lilly and Company.
1
2
3
4
5
number of nodes SOM
PSO
SOM/PSO
execution time(sec)
Number of times resampling is performed = 50
6. Conclusions The hybrid SOM/PSO method proposed in this paper preserves the topology structure of SOM. It also attempts to generate a more compact clustering result than SOM. In other words, SOM/PSO tries to tune the original SOM such that it can achieve a better tradeoff between the average quantization error and the topographic error [26]. This was particularly apparent for the yeast data set where the proposed hybrid method generated the expected result with a phase shift of sine patterns on one column. For the rat hepatocytes data set the result of the clustering by using SOM or SOM/PSO are essentially the same. The conscience can be used with either the standalone SOM or the proposed SOM/PSO method, and results in a faster convergence and a better representation of the pattern distribution in the data set. Furthermore, the conscience tends to improve the robustness of the original algorithm. This paper also shows that resampling is a useful technique for estimating the robustness of the algorithm. Since resampling is computationally expensive, it should be implemented in parallel if the input data sets are large.
35 30 25 20 15 10 5 0
80 70 60 50 40 30 20 10 0
1
2
3
4
5
number of nodes
SOM
PSO
SOM/PSO
Figure 9: Execution time in seconds of the parallel implementations of SOM, PSO and SOM/PSO with resampling for the rat hepatocytes data set.
Reference 1
Thomas K Baker, Mark A Carfagna, Hong Gao, Ernst R. Dow, Qingqin Li, George H. Searfoss, and Timothy P. Ryan. “Temporal Gene Expression Analysis of Monolayer Cultured Rat Hepatocytes,” Chem. Res. Toxicol., Vol 14, No. 9, 2001. 2 U.Alon, N.Barkai, D.A.Notterman, K.Gish, S.Ybarra, D.Mack, and A.J.Levine. “ Broad Patterns of Gene Expression Revealed by Clustering Analysis of Tumor and Normal Colon Tissues Probed by Oligonucleotide Arrays,” Proc. Natl. Acad. Sci. USA, Vol 96, pp. 6745-6750, Cell Biology, June 1999. 3 Xiling Wen, Stefanie Fuhrman, George S. Michaels, Daniel B. Carr, Susan Smith, Jeffery L. Barker, and Roland Somogyi. “Large-scale temporal gene expression mapping of central
nervous system development,” Proc. Natl. Acad. Sci. USA, Vol 95, pp 334-339, Neurobiology, Jan 1998. 4 Anderberg, M.R., “Cluster Analysis for Applications,” Academic Press Inc., New York, 1973. 5 Eisen, M. Spellman, PL, Brown, PO, Brown, D. “Cluster Analysis and Display of Genome-wide expression patterns,” Proc. Natl. Acad. Sci. USA 95: 14863-14868, 1998. 6 K. Y. Yeung, W. L. Ruzzo. “Principal Component Analysis for Clustering Gene Expression Data,” Bioinformatics, 17:763-774, 2001. 7 S. Raychaudhuri, J. M. Stuart, and R. B. Altman. “Principal Components Analysis to Summarize Microarray Experiments: Application to Sporulation Time Series,” Pacific Symposium on Biocomputing 2000, Honolulu, Hawaii, 452-463, 2000. 8 Leping Li, Clarice R. Weinberg, Thomas A. Darden, and Lee G. Pedersen. “Gene Selection for Sample Classification Based on Gene Expression Data: Study of Sensitivity to Choice of Parameters of the GA/KNN Method,” Bioinformatics, 17: 11311142, 2001. 9 Javier Herrero, Alfonso Valencia, and Joaquín Dopazo. “A hierarchical unsupervised growing neural network for clustering gene expression patterns,” Bioinformatics, 17: 126-136, 2001. 10 Tamayo, P, Slonim, D, Mesirov, J, Zhu, Q, Kitareewan, S, Dmitrovsky, E, Lander, ES, Golub TR. “Interpreting Patterns of Gene Expression with Self-organizing Maps: Methods and Application to Hematopoietic Differentiation,” Proc. Natl. Acad. Sci. USA 96: 2907-2912, 1999. 11 Toronen. P. Kolehmainen, M, Wong, G.Cartren, E. “Analysis of Gene Expression Data Using Self-organizing Maps,” FEBS letters 451: 142-146, 1999. 12 J.Kennedy and R. C. Eberhart, “Particle Swarm Optimization,” Proc. IEEE International Conference on Neural Networks, IV, 1942-1948. Piscataway, NJ: IEEE Service Center, 1995. 13 Cho, R. J., Campbell, M. J., Winzeler, E. A., Steinmetz, L., Conway, A., Wodicka, L., Wolfsberg, T. G., Gabrielian, A. E., Landsman, D., Lockhart, D. J. and Davis, R. W. “A Genomewide Transcriptional Analysis of the Mitotic Cell Cycle,” Molecular Cell, Vol. 2, pp. 65-73, 1998. 14 Kohonen, T., “Self-organizing Maps,” 2nd ed., Springer-Verlag, Berlin, 1995. 15 Paul Mangiameli, Shaw K. Chen and David West, “A Comparison of SOM neural network and hierarchical clustering methods,” European Journal of Operational Research, Vol. 93, Issue 2, 6, pp. 402-417, 1996 16 Erel Levine and Eytan Domany. “Resampling Methods for Unsupervised Estimation of Cluster Validity,” Neural Computation 13, 2573-2593, 2001. 17 Y. Shi, R. Eberhart, “A Modified Particle Swarm Optimizer,” Proc. IEEE Int. Conf. on Evolutionary Computation, pp. 69-73, 1998. 18 Eberhart, R. C., and Hu, X. “Human Tremor Analysis Using Particle Swarm Optimization,” Proc. Congress on Evolutionary Computation 1999, Washington, DC, pp 1927-1930. Piscataway, NJ: IEEE Service Center, 1999. 19 Yoshida, H., Kawata, K., Fukuyama, Y., Takayama, S., and Nakanishi, Y. “A Particle Swarm Optimization for Reactive Power and Voltage Control Considering Voltage Security Assessment,” IEEE Transactions on Power Systems, Vol. 15, No.4, pp. 1232-1239, 2000. 20 Salerno, J. “Using the Particle Swarm Optimization Technique to Train a Recurrent Neural Model,” IEEE International
Conference on Tools with Artificial Intelligence, pp. 45-49, 1997 21 DeSieno, D. “Adding a Conscience to Competitive Learning”, IEEE International Conference on Neural Networks, Vol. 1, pp. 117-124, New York, 1988. 22 Verikas, A. and Malmqvist, K. “Increasing Colour Image Segmentation Accuracy by means of fuzzy post-processing,” IEEE International Conference on Neural Networks, Vol. 4, pp. 1713-1718, Perth, WA, Australia, 1995. 23 A. Geist, A. Beguelin, J.Dongarra, W.Jiang, R.Manchek, and V. Sunderam “PVM: Parallel Virtual Machine \ A Users’ Guide and Tutorial for Networked Parallel Computing,” MIT Press, 1994. 24 Lani F. Wu, Timothy R. Hughes, Armaity P. Davierwala, Mark D. Robinson, Roland Stoughton, and Steven J. Altschuler. “Large-scale Prediction of Saccharomyces cerevisiae Gene Function Using Overlapping Transcriptional Clusters,” Nat. Genetics, Vol. 31, 2002. 25 Gengxin Chen, Saied A. Jaradat, Nila Banerjee, Tetsuya S. Tanaka, Minoru S. H. Ko and Michael Q. Zhang “Evaluation and Comparison of Clustering Algorithms in Analyzing ES Cell Gene Expression Data,” Statistica Sinica, Vol. 12, pp. 241-262, 2002 26 Kiviluoto, K., “Topology Preservation in Self-organizing Maps,” Proc. Intl. Conf. on Neural Networks, pp. 294-299, 1996.