Available online at www.sciencedirect.com
ScienceDirect Procedia Computer Science 47 (2015) 13 – 21
Gene Expression Data Classification using Support Vector Machine and Mutual Information-based Gene Selection Devi Arockia Vanitha Ca,1, Devaraj Db, Venkatesulu Mc a Department of Computer Science, The S.F.R College for Women, Sivakasi – 626123, Tamil Nadu, India. b Department of Computer Science and Engineering, Kalasalingam University, Krishnankoil – 626126, Tamil Nadu, India. c Department of Computer Applications, Kalasalingam University, Krishnankoil – 626126, Tamil Nadu, India.
Abstract DNA microarray technology can monitor the expression levels of thousands of genes simultaneously during important biological processes and across collections of related samples. Knowledge gained through microarray data analysis is increasingly important as they are useful for phenotype classification of diseases. This paper presents an effective method for gene classification using Support Vector Machine (SVM). SVM is a supervised learning algorithm capable of solving complex classification problems. Mutual information (MI) between the genes and the class label is used for identifying the informative genes. The selected genes are utilized for training the SVM classifier and the testing ability is evaluated using Leave-one-Out Cross Validation (LOOCV) method. The performance of the proposed approach is evaluated using two cancer microarray datasets. From the simulation study it is observed that the proposed approach reduces the dimension of the input features by identifying the most informative gene subset and improve classification accuracy when compared to other approaches. © 2015 The TheAuthors. Authors.Published PublishedbybyElsevier Elsevier B.V. © 2015 B.V. This is an open access article under the CC BY-NC-ND license Peer-review under responsibility of organizing committee of the Graph Algorithms, High Performance Implementations (http://creativecommons.org/licenses/by-nc-nd/4.0/). Peer-review under (ICGHIA2014). responsibility of organizing committee of the Graph Algorithms, High Performance Implementations and Applications and Applications (ICGHIA2014) Keywords: Classification; DNA Microarray; Gene Selection; Support Vector Machine; Mutual Information
1.
Introduction
Microarray data classification is a supervised learning task that predicts the diagnostic category of a sample from its expression array phenotype [1]. It takes labeled gene expression data samples and generates 1 * C.Devi Arockia Vanitha. Tel.: +0-948-646-2030; E-mail address:
[email protected]
1877-0509 © 2015 The Authors. Published by Elsevier B.V. This is an open access article under the CC BY-NC-ND license (http://creativecommons.org/licenses/by-nc-nd/4.0/). Peer-review under responsibility of organizing committee of the Graph Algorithms, High Performance Implementations and Applications (ICGHIA2014) doi:10.1016/j.procs.2015.03.178
14
C. Devi Arockia Vanitha et al. / Procedia Computer Science 47 (2015) 13 – 21
a classifier model that classifies new data samples into different predefined diseases. The major issue in Gene Classification is feature selection [2]. In the literature, statistical approaches like weighted voting scheme [3], nearest neighbor classification [4], discrimination methods [5] and least square and logistic regression [6] were used to develop the classifier model for gene expression data. These statistical approaches usually result in an inflexible classification system that is unable to classify a sample, if the expressions of genes are slightly different from the predefined profile. Bhuvaneswari et al. [7] proposed a framework to find informative gene combinations and to classify gene combinations belonging to its relevant subtype by using fuzzy logic. Fuzzy systems adapt numerical data (input/output pairs) into human linguistic terms, which offer very good capabilities to deal with noisy and missing data. However, defining the rules and membership functions requires a lot of prior knowledge from human expert. Due to their ability to map the input-output data, Artificial Neural Networks (ANN) has been proposed for gene expression data classification. Bevilacqua et al. [8] used Feed-Forward NN to develop an accurate classifier. Khan et al. [9] used neural networks to analyze microarray data from patients with small round blue-cell tumors. In Chen et al. [10] introduced classifying gene expression data using artificial neural network ensembles based on samples filtering. Neural networks can map the input data into different classes directly with one network. Besides, the neural network methods can easily accommodate nonlinear features of the gene expression data [9]. Neural networks can also be easily adapted to produce continuous variables instead of discrete class labels. This will be useful for cases where we need to predict the level of the medical indicator rather than classify the samples into binary categories [11]. But the Neural networks generally adopt gradient-based learning methods, which are susceptible to local minima and take long time for training [12]. Recently, Support Vector Machines have been proposed for gene data classification. In the gene classification method presented by Furey et.al [13], the SVM performs well with a simple kernel when analysing microarray expression data for genes from several tissue or cell types. Brown et al. [14] introduce a method of functionally classifying genes in the gene expression data from DNA microarray hybridization experiments using Support Vector Machine. SVMs have many features that make them attractive for gene expression analysis, including their flexibility in choosing a similarity function, sparseness of solution when dealing with large data sets, the ability to handle large feature spaces, and the ability to identify outliers [14]. Because of the above features SVM is adopted in this work for gene data classification. A major issue for current gene expression analysis is to identify the informative genes, given the disparity between the number of genes measured and number of individuals sampled [15]. The phenotypes of samples can be discriminated through only a small subset of genes whose expression levels strongly correlate with the class distinction. These genes are called informative genes. The remaining genes in the gene expression matrix are regarded as noise in the data set [3]. Performing gene selection helps to reduce the dimension of gene expression data and thus improving the training time. More importantly, gene selection removes a large number of irrelevant genes which improves the classification accuracy. Guyon et al. [16] proposed a gene selection method that utilizes Support Vector Machine methods based on Recursive Feature Elimination (RFE). It retains the set of features that has the highest classification power. The Gene Selection method proposed by Golub et.al [3] is a correlation metric that selects genes that have big between-class mean expression value and small within-class variation of expression value. Keller et al. [17] used a likelihood measurement for gene selection. Given a training data set, genes whose expression values are a good indication of the class separation was selected. This paper uses mutual information [18] for selecting informative genes because of its nonlinearity, robustness, scalability and good empirical successes. The primary objectives of the proposed Gene Expression data classification using SVM and MI are, (1) to select the informative genes using Mutual Information technique, (2) to train and test SVM classifier model using the selected genes with different kernel settings and (3) to test the generalization ability of the developed classifier model using standard LOOCV method. The proposed approach is evaluated on two microarray data sets: Colon cancer and Lymphoma data and the results are presented. This paper is organized as follows. Section 2 deals with the classification of microarray data. Section 3 describes the overall design of SVM-MI approach. Section 4 deals with working principle of Mutual Information technique. Section 5 provides the details of SVM and different types of kernels used in this
15
C. Devi Arockia Vanitha et al. / Procedia Computer Science 47 (2015) 13 – 21
work. Section 6 presents the description about the data sets, experiment conducted, results and discussions. Section 7 concludes the work. 2.
Microarray Data Classification
A gene is a segment of DNA that contains all the information necessary to create all sorts of proteins in our body. Different cell types express different subsets of their genes [19]. Microarray expression experiments allow the recording of expression levels of thousands of genes simultaneously. These experiments primarily consist of either monitoring each gene many times under different conditions or alternately evaluating each gene in a single environment but in different types of tissues, especially cancerous tissues [3] [20]. Microarray expression experiments have great potential for use as part of standard diagnosis tests performed in the medical community [13]. In microarray gene classification problem, given a set of genes and the corresponding class label, the aim is to derive the relation among the genes of the same class, so that when a test gene is given, the corresponding class label is retrieved. Mathematically, this is stated as: given a set of data the objective is to develop a classifier which maps an object to its . The classifier model is constructed by analyzing the samples described by a set of class label features called input features. Each sample is assumed to belong to a predefined class, called the output class label. In this paper, we address two-class classification problem for gene expression data. Features are gene expression coefficients and Patterns correspond to samples from patients. The problem is to develop a classifier suitable for genetic diagnosis using available training examples from cancer and normal patients. 3.
Proposed Approach
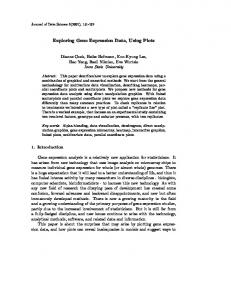
The proposed Microarray based SVM disease classification system takes the selected gene expression samples with labels and generates a classifier model that classifies new samples into different predefined diseases. The gene selection is important for Microarray data classification because of its high dimension. Removing noisy or irrelevant genes might improve the performance of the classifier. Fig. 1 illustrates the schematic diagram of the proposed approach. The gene expression data is split into two sets: Training set and Test set. Using MI [18], the informative genes are selected. The selected genes are used to train the classifier. Test set is used to estimate the performance of the developed system. Training Data
Gene Selection (MI)
Test Data
Gene Selection (MI)
Adjust SVM Classifier Parameters
Microarray Gene Expression Data
Fig. 1
SVM Classifier
Classification Decision
L O O C V
Schematic diagram of proposed approach
An SVM learn to discriminate between the members and non-members of a given functional class based on expression data. Having learned the expression features of the class, the SVM could recognize new genes as members or non-members of the class based on their expression data. The generalization ability of the generated classifier model is computed using the Leave-one-out cross validation method. This method makes the best use of the available data and avoids the problems of random selections. 4.
Gene Selection using Mutual Information
One of the major problems with the present gene expression analysis techniques is gene dimensionality [15]. Selection of relevant genes for sample classification is a common task in most gene expression studies [21]. In this work, Mutual information (MI) [18] technique is used to select informative
16
C. Devi Arockia Vanitha et al. / Procedia Computer Science 47 (2015) 13 – 21
genes from the original gene expression profile. To compute MI, the probability distribution of genes are needed which in practice are not known, and the best we can do is to use the histogram of the data. The steps involved in computing the MI from the histogram of the training data are given below: ? The data set is arranged in the ascending order based on the output. ? The output class label (Y) is divided into two groups and the initial entropy H(Y) is calculated using
?
The input genes (X) are divided into ten levels and their conditional entropies H(Y/X) are evaluated using
?
Next, the mutual information of each gene with respect to the output is computed using
The mutual information of all the genes is arranged in ascending order. The first few genes that have high mutual information value are selected as informative genes to train the support vector machine. 5.
SVM for Classification
The Support Vector Machine (SVM) is a state-of-the-art classification method introduced in 1992 by Boser, Guyon, and Vapnik [23]. The theory of SVM is based on the idea of structural risk minimization (SRM) [23]. The architecture of SVM is shown in Fig. 2.
yi
output
Bias
K(
K(
K(
…
…
…
Kernels
… Input x
Fig. 2
Structure of an SVM
In Fig. 2, the notation xi denotes the ith vector in a dataset {(xi,yi)}, i = 1 to n where yi is the label , i = 1 to n associated with xi. The objects xi are called patterns, inputs and also examples. The K( represents the kernel functions of real-valued data. Given a training set of instance-label pairs and Y the support vector machine (SVM) require the solution of the following optimization problem: (4)
C. Devi Arockia Vanitha et al. / Procedia Computer Science 47 (2015) 13 – 21
Here training vectors are mapped into a higher (may be infinite) dimensional space by the function . The simplest form of a prediction problem is binary classification: trying to discriminate between objects that belong to one of two categories — positive (+1) or negative (-1). SVMs use two key concepts to solve this problem: large-margin separation and kernel functions. An SVM first maps the input into a high-dimensional feature space and finds a separating hyperplane that maximizes the margin between two classes in this space. Maximizing the margin is a quadratic programming (QP) problem and can be solved from its dual problem by introducing Lagrangian multipliers. Without any knowledge of the mapping, the SVM finds the optimal hyperplane by using the dot product functions in feature space that are called kernels. The solution of the optimal hyperplane can be written as a combination of a few input points that are called support vectors [24]. SVMs belong to the general category of kernel methods. A kernel method is an algorithm that depends on the data only through dot-products. When this is the case, the dot product can be replaced by a kernel function which computes a dot product in some possibly high dimensional feature space. The four basic kernels are: Linear : Quadratic
:
Polynomial
:
Radial Basis Function (RBF) : The selection of an appropriate kernel function is important, since the kernel function defines the feature space in which the training set examples will be classified. SVM classifier is adopted in this work due to its high accuracy, ability to deal with high-dimensional data such as gene expression, and flexibility in modeling diverse sources of data [25]. 6.
Simulation Results
This section presents simulation results of the proposed approach using two cancer microarray datasets. Simulations are conducted to examine the learning ability and generalization ability of the proposed SVM approach. The proposed approach is implemented in MATLAB and executed in a PC with Intel Core i3 processor with 2.40 GHz speed and 4 GB of RAM. Table 1 Dataset Colon cancer (Alon et al., 1999) Lymphoma (Alizadeh et al., 2000)
Details of gene expression dataset.
Total samples
No. of Genes
62
2000
45
4026
Class labels
Class wise samples
Tumor
40
Normal
22
Germinal Centre B-Like (GCL) Activated B-Like (ACL)
23 22
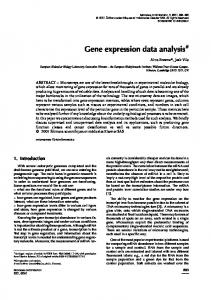
Table 1 gives the details of gene expression data set used in the simulation. Both the data sets two class gene expression profiles [26][27]. The data sets consist of a matrix of gene expression vectors obtained from DNA microarrays for a number of patients. The first set was obtained from cancerous or normal colon tissues. The second set was obtained from cancer patients with two different types of lymphoma. Case 1: Colon Cancer Data Classification Colon Cancer Gene expression information was extracted from DNA micro-array data resulting, after pre-processing, in a table of 62 tissues×2000 gene expression values by Alon et. Al [20]. The 62 tissues include 22 normal and 40 colon cancer tissues. The matrix contains the expression of the 2000 genes with highest minimal intensity across the 62 tissues. The problem is to distinguish the cancer samples from the normal samples. Gene selection using MI is performed to remove the genes that do not contribute to the accuracy of the classifier. Fig. 3 shows the mutual information of all input genes of Colon data set with respect to the output classes.
17
18
C. Devi Arockia Vanitha et al. / Procedia Computer Science 47 (2015) 13 – 21
Mutual Information 0.25
Mutual Information
0.2
0.15
0.1
0.05
0
0
200
400
600
Fig. 3
800
1000 Input Genes
1200
1400
1600
1800
2000
Mutual information for the input genes of Colon
From Fig. 3, it is clear that only a small set of genes are possessing significant information about the disease. With regard to the studies suggesting that only few genes are sufficient for understanding their biological relationship with the target diseases, ten genes with higher MI value are selected as informative genes. Table 2 gives the detail of the genes selected using MI for Colon data set. Table 2 Gene No.
Gene ID
493
R87126
1772 1582 1042 897
H08393 X63629 R36977 H43887
780
H40095
571 513 1671 1423
R42501 M22382 M26383 J02854
Genes selected through MI for Colon. MI Value
Gene Description yq31b10.s1 Soares fetal liver spleen 1NFLS, 1st strand cDNA was primed with a Pac I – oligo(dT) primer yl92a10.s1 Soares infant brain 1NIB, 1st strand cDNA was primed with a Not I – oligo(dT) primer H.sapiens mRNA for p cadherin yf53h07.s1 Soares infant brain 1NIB yo70c01.s1 Soares breast 3NbHBst, 1st strand cDNA was primed with a Not I – oligo(dT) primer yn85b03.s1 Soares adult brain N2b5HB55Y, 1st strand cDNA was primed with a Not I – oligo(dT) primer yf91a09.s1 Soares infant brain 1NIB, 1st strand cDNA was primed with a Not I – oligo(dT) primer mitochondrial matrix protein P1 (nuclear encoded) mRNA Human monocyte-derived neutrophil-activating protein (MONAP) mRNA 20-kDa myosin light chain (MLC-2) mRNA
0.2276 0.1983 0.1983 0.1983 0.1983 0.1983 0.1983 0.1983 0.1729 0.1729
The learning ability of the proposed SVM approach is examined by using all the samples as training patterns with top three genes selected using MI as input for Colon dataset. Each gene in the test set can be classified in one of four ways: True Positives (the number of tumor tissues classified correctly), True Negatives (the number of normal tissues classified correctly), False Positives (the number of normal tissues misclassified), and False Negatives (the number of tumor tissues misclassified). Table 3 presents the number of normal tissues misclassified (FP), tumor tissues misclassified (FN), tumor tissues classified correctly (TP), and normal tissues classified correctly (TN) identified by each method for Colon cancer dataset. Column 2 is the number of genes (features) used. Table 3 Method
Results of Colon Cancer Tissue Experiments.
Genes (Gene no.)
8
Correctly classified 19 (0.6129)
12 (0.3870)
2
19 (0.6129)
11 (0.3548)
0 0
9 11
23 (0.7419) 20 (0.6451)
8 (0.2580) 11 (0.3548)
9
11
8
12 (0.3870)
19 (0.6129)
17
3
8
20 (0.6451)
11 (0.3548)
TP
TN
FP
FN
KNN
3
16
4
ANN
8
11
9
3 0
20 20
3 3
SVM linear SVM RBF SVM quadratic SVM polynomial
3 (493, 1772 & 1582)
Error Rate
C. Devi Arockia Vanitha et al. / Procedia Computer Science 47 (2015) 13 – 21
Compared to the other SVM similarity metrics, the linear function SVM provide superior performance in classifying the gene expression data. In addition, the performance of the SVM classifiers was compared to that of two standard machine learning algorithms k-nearest neighbour and Feed-forward neural network. The SVM with linear kernel produced the maximum classification accuracy with only 3 informative genes. Leave-One-Out Cross-Validation (LOOCV) [28] method is used to assess the classifying ability of the developed system. Fig 4 shows the procedure of LOOCV. The LOOCV procedure works as by dividing all samples into K subsets randomly, where K is the total number of samples. Then K - 1 subsets are used to train the model and the remaining Kth sample is used for testing and the same is repeated for K times such that each sample is given a chance for testing the performance. The LOOCV accuracy is calculated using
where Cc is the number of correctly classified samples in K experiments. Total number of examples Experiment 1 Experiment 2 Experiment 3
. . .
Single test example
Experiment N Fig. 4
LOOCV Method
For Colon data set, the 62 samples were divided as 61 samples for training and a single sample for testing the performance of the proposed system. This procedure is iterated 62 times so that each sample is used for evaluating the performance of the developed classifier. Table 4 shows the average classification accuracy rate by each method in the LOOCV evaluation for the Colon data set. Table 4
Generalization ability of different approaches.
S.No
Method
1 2 3 4 5 6
KNN ANN SVM linear SVM RBF SVM quadratic SVM polynomial
LOOCV Mean accuracy rate 0.4451 0.5092 0.6774 0.6051 0.4023 0.4683
Case 2: Lymphoma Cancer Data Classification Lymphoma is a broad term encompassing a variety of cancers of the lymphatic system. The lymphoma data set includes 45 tissues x 4026 genes [29]. There are altogether two types of lymphomas. The first category, Germinal Centre B-Like (GCL) has 23 patients, and the second type Activated B-Like (ACL) has 22. The problem is to distinguish the Germinal Centre B-Like (GCL) samples from the second type Activated B-Like (ACL) samples. Table 5 shows the top ten genes with the highest MI value.
19
20
C. Devi Arockia Vanitha et al. / Procedia Computer Science 47 (2015) 13 – 21 Table 5
Genes selected through MI for Lymphoma.
Gene No. 1317 1281 1279
Gene ID
Gene Description
GENE3261X GENE3332X GENE3330X
1278
GENE3329X
1277 1276
GENE3328X GENE3327X
1264
GENE3315X
2439 2438 75
GENE3968X GENE3967X GENE3939X
Unknown; Clone=1353015 Unknown UG Hs.120716 ESTs; Clone=1334260 Unknown; Clone=825199 Unknown UG Hs.224323 ESTs, Moderately similar to alternatively spliced product using exon 13A [H.sapiens]; Clone=1338448 Unknown UG Hs.136345 ESTs; Clone=746300 Unknown UG Hs.169565 ESTs, Clone=825217 FMR2=Fragile X mental retardation 2=putative transcription factor=LAF-4 and AF-4 homologue; Clone=1352112 Deoxycytidylate deaminase; Clone=1302032 Deoxycytidylate deaminase; Clone=1185959 Unknown UG Hs.169081 ets variant gene 6 (TEL oncogene); Clone=1355435
MI Value 0.3836 0.3836 0.3836 0.3836 0.3836 0.3836 0.3836 0.3378 0.3378 0.3378
The SVM with linear kernel produced 100% classification accuracy with only 4 informative genes. Table 6 Method
Results of Lymphoma Tissue Experiments.
10
10
1
1
Correctly classified 20 (0.9090)
4
11
11
0
0
22 (1.00)
(1317 1281, 1279, &1278)
11
11
0
0
22 (1.00)
0 (0.00)
9
11
0
2
20 (0.9090)
2 (0.0909)
8
11
0
3
19 (0.8636)
3 (0.1363)
10
10
1
1
20 (0.9090)
2 (0.0909)
Genes (Gene No.)
KNN ANN SVM linear SVM RBF SVM quadratic SVM polynomial
TP
TN
FP
FN
Error Rate 2 (0.0909) 0 (0.00)
Table 6 shows the classification results of Lymphoma using each method. Compared to other methods, support vector machine with linear kernel and Feed forward neural network yields the maximum percentage for correctly classified data with minimum number of genes. For Lymphoma data set, the 45 samples were divided as 44 samples for training and a single sample for testing the performance of the proposed system. This procedure is iterated 45 times so that each sample is used for evaluating the performance of obtained membership function and rule set. Table 7 shows the average classification accuracy rate by each method in the LOOCV evaluation for all the data sets. Table 7
Generalization ability of different approaches for Lymphoma data. S.No 1 2 3 4 5 6
7.
Method KNN ANN SVM linear SVM RBF SVM quadratic SVM polynomial
LOOCV Mean accuracy rate 0.9565 0.9580 0.9777 0.9560 0.9537 0.9598
Conclusion
This paper has presented a SVM-based approach for microarray gene data classification. Support Vector Machines are well suitable for the analysis of broad patterns of gene expression from microarray data. They can easily deal with a large number of features (genes) and a small number of patterns (samples). The problem of dealing with large number of features is eliminated by obtaining the feature subset for a given classifier. Mutual information between genes is used to identify the informative genes in the gene selection process. Gene selection using MI has its impact in the classification performance by SVM. SVM with linear kernel produced highest accuracy in of classification of tissues in the cancer
C. Devi Arockia Vanitha et al. / Procedia Computer Science 47 (2015) 13 – 21
datasets. The proposed approach can be used as a decision making tool by the physician in the diagnosis of disease. References 1. GaneshKumar P, Aruldoss Albert Victore T, Renukadevi P, Devaraj D. Design of Fuzzy Expert System for Microarray Data Classification using a Novel Genetic Swarm Algorithm. Expert Systems with Applications 2012; 39-2, p. 1811-1812. 2. Dudoit S. et al. Comparison of discrimination methods for the classification of tumors using gene expression data. Journal o f American Statistics Association 2002; 97(457), p. 77–87. 3. Golub TR, Slonim DK, Tamayo P, Huard C, Gassenbeek M, Mesirov JP, Coller H, Loh ML, Downing JR, Caligiuri MA, Bloomfield DD and Lander ES. Molecular Classification of Cancer: Class Discovery and Class Prediction by Gene Expression Monitoring, Science 1999; 286-15, p. 531-537. 4. Li L. Gene selection for sample classification based on gene expression data: Study of sensitivity to choice of parameters of the ga/knn method. Bioinformatics 2001; 17, p.1131–1142. 5. Fort G, Lacroix SL. Classification using partial least squares with penalized logistic regression, Bioinformatics 2005; 21-7, p.1104–1111. 6. Fan L. et al. A sequential feature extraction approach for naïve bayes classification of microarray data. Expert Systems with Applications 2009; 36-6, p.9919–9923. 7. Bhuvaneswari V, Vanitha K. Classification of Microarray Gene Expression Data by Gene Combinations using Fuzzy Logic. International Journal of Computer Science, Engineering and Applications 2012; 2-4, p.79–98. 8. Bevilacqua V, Mastronardi G, Menolascina F, Paradiso A, Tommasi S. Genetic Algorithms and Artificial Neural Networks in Microarray Data Analysis : a Distributed Approach 2006; 14(November). 9. Khan J, Wei,M.Ringner JS, Saal,M.Ladanyi LH, Westermann,F.Berthold F, Schwab M, Antonescu CR, Peterson C, and Meltzer S, Classification and Diagnostic Prediction of Cancers Using Gene Expression Profiling and Artificial Neural Networks. Nature Medicine 2001; , 7-6, p. 673-679. 10. Wutao Chen, Huijuan Lu, Mingyi Wang and Cheng Fang. Gene Expression Data Classification Using Artificial Neural Network Ensembles Based on Samples Filtering. International Conference on Artificial Intelligence and Computational Intelligence 2009; 1, p. 626 – 628 11. Ringner M, Peterson C, Khan J. Analyzing Array Data Using Supervised Methods. Pharmacogenomics 2002; 3-3, p. 403-415. 12. Linder R, Dew D, Sudhoff H, Theegarten D, Remberger K, Poppl SJ, Wagner M. The Subsequent Artificial Neural Network (SANN) Approach Might Bring More Classificatory Power to ANN-Based DNA Microarray Analyses. Bioinformatics 2004; 20- 18, p. 3544-3552. 13. Furey TS et al. Support Vector Machine classification and validation of cancer tissue samples using microarray expression data. Bioinformatics 2000; 16, p.906–914. 14. Michael PS Brown, William Noble Grundy, David Lin, Nello Cristianini, Charles Walsh Sugnet, Terrence S Furey, Manuel Ares, Jr., David Haussler. Support Vector Machine Classification of Microarray Gene Expression Data. UCSC-CRL-99-09 15. Narayanana A, Keedwell EC, Gamalielsson J, Tatineni S. Single-layer artificial neural networks for gene expression analysis. Neurocomputing 2004, 61, p. 217 – 240. 16. Guyon I, Weston J, Barnhill S, Vapnik V. Gene selection for cancer classification using support vector machines. Machine Learning 2000; 46, p.389–422. 17. Keller A, Schummer M, Hood L, Ruzzo W. Bayesian classification of DNA array expression data. Technical Report, University of Washington August 2000. 18. Devaraj D, Yegnanarayana B, Ramar K. Radial basis function networks for fast contingency ranking. Journal of Electrical Power and Energy Systems 2002; 24, p.387–393. 19. Sung-Bae Cho, Hong-Hee Won. Machine learning in DNA microarray analysis for cancer classification. Proceedings of the First Asia-Pacific bioinformatics conference on Bioinformatics 2003; 19, p.189-198. 20. Alon U et al. Broad patterns of gene expression revealed by clustering of tumor and normal colon tissues probed by oligonucleotide arrays. Proceedings of the National Academy of Sciences of the United States of America 1999; 96(12), p.6745– 6750. 21. Lee JW, Lee JB, Park M, Song SH. An extensive evaluation of recent classification tools applied to microarray data. Computation Statistics and Data Analysis 2005; 48, p.869-885. 22. Boser BE, Guyon IM, Vapnik VN. A training algorithm for optimal margin classifiers. 5th Annual ACM Workshop on COLT 1992; p.144–152. 23. Vapnik VN. The Nature of Statistical Learning Theory. New York: Springer-Verlag 1995. 24. Chun-Fu Lin, Sheng-De Wang. Fuzzy Support Vector Machines. IEEE Transactions on Neural Networks 2002; 13-2. 25. Sch lkopf B, Tsuda K, Vert JP. Kernel Methods in Computational Biology. MIT Press series on Computational Molecular Biology 2004. 26. http://llmpp.nih.gov/lymphoma 27. http://microarray.princeton.edu/oncology 28. Ben-Dor, A. et al. Tissue classification with gene expression profiles. Journal Computational Biology 2000, 7(3-4), p.559–583. 29. Alizadeh, A. et al. Distinct types of diffuse large B-cell lymphoma identified by gene expression profiling. Nature 2000, 403(3), 503–511.
21