Generalization of Land Cover Maps by Mixed Integer Programming∗ Jan-Henrik Haunert
Alexander Wolff
Institute of Cartography and Geoinformation Leibniz Universitat ¨ Hannover Appelstraße 9a 30167 Hannover, Germany
Fakultat ¨ fur ¨ Informatik Universitat ¨ Karlsruhe P.O. Box 6980 D-76128 Karlsruhe, Germany
[email protected]
http://i11www.iti.uka.de/people/awolff
ABSTRACT
1.
We present a novel method for the automatic generalization of land cover maps. A land cover map is composed of areas that collectively form a tessellation of the plane and each area is assigned to a land cover class such as lake, forest, or settlement. Our method aggregates areas into contiguous regions of equal class and of size greater than a user-defined threshold. To achieve this goal, some areas need to be enlarged at the expense of others. Given a function that defines costs for the transformation between pairs of classes, our method guarantees to return a solution of minimal total cost. The method is based on a mixed integer program (MIP). To process maps with more than 50 areas, heuristics are introduced that lead to an alternative MIP formulation. The effects of the heuristics on the obtained solution and the computation time are discussed. The methods were tested using real data from the official German topographic data set (ATKIS) at scales 1:50.000 and 1:250.000.
In most countries national mapping agencies provide topographic data sets, which form the basis for different map products. To support maps of different scales, data sets of different detail have been built up. Collecting these data sets independently, as it is often done up to now, has two disadvantages. First, multiple acquisition of data is expensive and not efficient. Second, it may result in inconsistencies since different cartographers can come to different results when mapping the real world. To improve efficiency and consistency, automatic generalization techniques have been applied. Usually two problems are distinguished: Model generalization, which aims at a reduction of detail for digital representation, and cartographic generalization, which creates visually pleasant maps. In this paper, we address model generalization. Generally, the aim of model generalization is to create an output that satisfies the requirements of the target data set, while preserving characteristic features. While formalized requirements like minimal dimensions are often defined in the specifications of the data set, the formal description of the statement’s second part is a rather difficult task. However, if the changes applied to the source data set can be expressed by quantitative measures, the generalization task can be formalized as a constrained optimization problem.
Categories and Subject Descriptors H.2.8 [Database Management]: Database Applications— Spatial Databases and GIS
General Terms
GENERALIZATION
Algorithms
1.1 Keywords Generalization, Aggregation, Mixed Integer Programming ∗ This work was started at the seminar “Spatial Data: Mining, Processing and Communicating” organized by J.-R. Sack, M. Sester, M. Worboys and P. van Oosterom; Schloss Dagstuhl, Germany, February 2006. The authors acknowledge support from grants SE 645/2-1 and WO 758/4-2 of the German Research Foundation (DFG).
Permission to make digital or hard copies of all or part of this work for personal or classroom use is granted without fee provided that copies are not made or distributed for profit or commercial advantage and that copies bear this notice and the full citation on the first page. To copy otherwise, to republish, to post on servers or to redistribute to lists, requires prior specific permission and/or a fee. ACM-GIS’06, November 10–11, 2006, Arlington, Virginia, USA. Copyright 2006 ACM 1-59593-529-0/06/0011 ...$5.00.
Aggregation problem
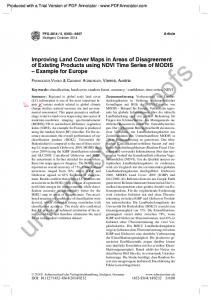
Within topographic databases, the information about land cover is usually represented by polygons that belong to different classes such as deciduous forest, grassland or settlement. To avoid conflicts, overlaps of polygons are explicitly prohibited. Also gaps are forbidden to ensure integrity. Generalizing this kind of map normally involves the generalization of classes and the aggregation of features. An example for class generalization is that the classes deciduous forest and coniferous forest are replaced by the class forest. Here we assume, that these class inheritance relationships are unambiguous and known. According to these relationships the source data set can be reclassified, and the aggregation task can be performed independently. A comprehensive discussion on the class abstraction task is given by van Smaalen [13]. The aggregation problem is due to area thresholds that are defined differently for the source and the target data set. Simply omitting features from the source data set that are too small for the target scale would violate the prohibition of
Legend Settlement
Grassland
Grove
Wood
Farmland
Water
Figure 1: Source data set ATKIS DLM 50 (1:50.000).
gaps. Therefore, features need to be merged with neighbors, which results in changes of their classes.
1.2
An iterative algorithm
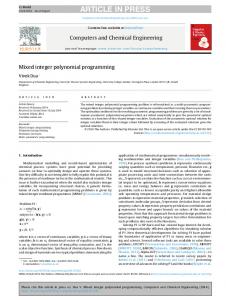
A popular approach to the aggregation problem is to select features in increasing order of their importance and to merge them with one of their neighbors, until all features satisfy the area threshold [12]. Choosing the neighbor for this merge is done by taking semantic similarities of classes as well as geometric measures into account. In a previous study [7] this linear time algorithm was tested using data and specifications from the German ATKIS project. Figure 1 shows a sample with 50 areas from the ATKIS DLM 50, which is used as basis for topographic maps at the scale 1:50.000. All the presented examples were taken from a data set that covers a rural area close to the city of Hamburg, Germany. The ATKIS specifications also define area thresholds for a data set with less details, namely the ATKIS DLM 250 corresponding to the scale 1:250.000. Thresholds differ among different classes, since some classes like lakes are considered to be more important than others. According to a priority definition for merges of adjacent features, the iterative algorithm leads to the result shown in Figure 2. Though the area thresholds are met, the result does not satisfy, since classes were changed for a major part of the data set. Features that do not satisfy the area threshold and do not have neighbors of the same class are very likely to change classes in this procedure. A cartographer would try to avoid changes of relatively large features. In many cases this can be done by altering smaller neighbors that bridge gaps to features of the same class. These solutions will most likely not be found by an algorithm that greedily merges features with the best neighbor. Therefore, we formulate the aggregation task as a global optimization problem.
Figure 2: Result after iteratively merging areas with neighbors. Obtained regions bounded by bold lines.
2.
DEFINITION AND RELATED WORK
In this section we give an exact definition of the aggregation problem. We then show that the problem is NP-hard, i.e., one cannot expect to find an exact polynomial-time solution. Finally we summarize related problems and possible approaches.
2.1
Definition of the basic problem
We consider the aggregation task as a coloring problem of the adjacency graph G(V, E), where each node v ∈ V corresponds to an area feature of the source data set. An edge e = (u, v) ∈ E expresses, that u and v share a common boundary. Note that G is planar. We first give a basic problem definition, which later can be modified to solve more involved tasks. Given • a planar graph G(V, E) with node weights w : V → R+ and node colors γ : V → Γ, where Γ is the set of all map colors, • a threshold value θ ∈ R+ and • a distance function d : Γ2 → R+ 0 , find a new coloring γ 0 : V → Γ, so that • each connected component induced by one color has weight at least θ, P 0 • v∈V w(v) · d(γ(v), γ (v)) is minimized. Weights of nodes correspond to area sizes and colors to land cover classes. The threshold, which is the same for all classes in this basic problem definition, is a lower bound for the area of the regions in the output. The contribution of a node to the total cost is the product of its weight and the distance between its original and its new color. We refer to this problem as Land cover map generalization with minimum color change.
The definition of an appropriate distance function is a non-trivial task that needs expertise. Semantic similarities of classes as well as preferences for keeping certain classes unchanged need to be considered. Alternatively, machinelearning techniques can be applied to derive preferences for the aggregation automatically if a sample data set for the target scale exists [10]. However, this problem will not be discussed here. We have defined reasonable distance values for classes of the examples shown here, but our algorithms do not make any restricting assumptions concerning the distance function.
2.2
NP-hardness
We now investigate the computational complexity of land cover map generalization. We show that the problem is NPhard, i.e., one cannot expect to find an exact polynomialtime solution. This justifies that we will later turn to mixedinteger programming and to heuristic methods. Theorem 1. Land cover map generalization with minimum color change is NP-hard, even if the number of colors is restricted to two. Proof. Let us first introduce the problem PlanarVertexCover. Given a graph G = (V, E), a vertex cover of G is a subset of V that contains at least one of the two endpoints of each edge in E. It is known that the problem of finding vertex covers of minimum cardinality is NP-hard even if the input graphs are restricted to be planar [5]. Our proof is by reduction from PlanarVertexCover. Given a planar graph G we define a corresponding instance G0 of our map generalization problem such that an optimal solution of G0 yields a minimum vertex cover of G. Since this reduction can be done in polynomial time, our problem is NP-hard. Figure 3 illustrates the reduction. To obtain the input graph G0 for the generalization problem we split each edge of G into two edges by inserting a new vertex. We define the inserted vertices to be white and the other vertices to be black. We set the threshold θ to 1, and the weights of the white and black vertices to 0.1 and 1, respectively. We charge one unit for changing the color of a vertex of G0 from black to white and n for the opposite color change, where n is the number of vertices in G. The distance function is defined so that it is always more expensive to change a white vertex to black than to change both adjacent black vertices to white. Because of this at least one neighbor of each white vertex will change its color. In an optimal solution of the map generalization problem the set of vertices in G0 that have changed color from black to white corresponds to a minimum vertex cover of G. The same reduction also shows that land cover map generalization cannot be approximated arbitrarily well. This is known for minimum vertex cover [6].
−→
Figure 3: Reduction from PLANARVERTEXCOVER.
2.3
Existing models for spatial contiguity
The main difficulty of the map aggregation problem is to model the spatial contiguity of regions. Different adaptable approaches exist that have been motivated by problems from operations research. Typical problems that have been addressed are the alignment of sales territories [14] or the definition of electoral districts [9]. Most approaches have in common that for each region one node is defined to be the center. All other nodes are assigned to one of the centers to express the membership to a region. To express that a node v belongs to the region with center i binary variables xiv can be introduced. If we assume that all nodes are potential centers, this leads to O(|V |2 ) variables. However, the variables xiv do not suffice to express constraints that ensure spatial contiguity without excluding feasible solutions. A simple possibility for a general contiguity model is to consider paths of arcs in the set A = {uv, vu | {u, v} ∈ E}. If v belongs to center i, then there must exist a path from v to i, such that all nodes on the path belong to the center i. For this we would need additional binary variables paiv with paiv = 1 iff arc a belongs to the path from v to i. This results in O(|E||V |2 ) variables. Since G is planar we end up with a MIP of cubic size. Another popular model for spatial contiguity is to define a precedence relationship for nodes relative to a center [14]. In other words, for each center a direction is defined for the edges of the adjacency graph, such that all arcs direct to the center (i.e., no cycles exist). According to this model a node v can be part of a component with center i if and only if one of its direct predecessors relative to i is part of this component. If we assume that all nodes are potential centers, the model can be expressed by the equation X xiv ≤ xiu ∀i ∈ V, v ∈ V − {i}, (1) u∈Predi (v)
with Predi (v) being the set of direct predecessors of v, relative to the center i. With this model the number of variables is quadratic, which is an advantage compared to the first model. However, not all connected regions are feasible, which can be seen as a disadvantage of this method. The precedence relationship is often used to exclude regions that are not compact, which is important for many applications. Yet, there is no guarantee for compactness. An alternative general contiguity model was introduced by Shirabe [11]. The model is applied to the problem of selecting a contiguous set of nodes and an included center from a graph, such that certain constraints are satisfied and an objective is optimized. The basic idea is to define a flow fa on the arcs in A. To ensure spatial contiguity, different constraints for the inflow and outflow of a node need to be formulated. First, the center is the only sink of the flow network, i.e., the incoming flow exceeds the outflow. Second, a node that belongs to the selected region is a source of the center’s network, i.e., the outflow exceeds the inflow by a certain amount. Third, the outflow from a node that does not belong to the region is zero. The problem is different to ours, since we want to aggregate all nodes into multiple contiguous sets. However, the method can be easily adapted by introducing variables fia that express the flow for center i. Additionally the variables xiv are needed. This approach would lead to a quadratic number of variables and constraints. We utilize a similar model for our problem which has only a linear number of variables and constraints. We
present our formulation in Section 3 and compare it to the model of Shirabe. Another technique for spatial allocation is to reduce the adjacency graph first to a tree, and then to find an optimal partition of the tree. This method has computational advantages, since the tree partitioning can be solved for many special cases in polynomial time by dynamic programming. However, the definition of an appropriate tree is a difficult task. The tree partitioning can be used for an optimal rounding of fractional variables that result from LP relaxations of integer programs for certain aggregation problems [9]. Also heuristic methods such as simulated annealing and genetic algorithms have been applied to problems that demand contiguous districts [1]. However, the definition of appropriate neighborhood structures and incremental operators that are needed for these approaches is a difficult task.
3.
A MIP OF LINEAR SIZE
In this section we present our new linear-size MIP for the map aggregation problem that we defined in Section 2.1. We also give a simple extension that allows the user to specify different thresholds for different classes.
3.1
Formulation of the basic problem
Our mixed integer program for the map aggregation problem is based on a similar contiguity model as that of Shirabe. The main difference is that we do not introduce variables that express the membership of nodes to regions. We only need variables to express the colors of the nodes and variables for the flow on the graph. For this it suffices to define one flow variable fa per arc, and so the number of variables is O(|V ||Γ|). If |Γ|, the number of colors, is constant, the number of variables is linear. All equations are linear, and so the problem can be solved with standard procedures that use solutions of LP relaxations as bounds for the objective function. We build upon the idea that each connected component has a center, i.e., a sink that consumes a certain amount of flow from the network. Each edge of the graph is represented by two directed arcs in this network. Each node that is not a sink is defined to be a source that contributes a positive amount of flow to the network, so that a connection to a sink is ensured. In our approach, the network flow is utilized not only to ensure the contiguity of the components, but also to guarantee the threshold constraint. The amount of flow contributed by a source is defined to be the same as the node’s weight. Therefore, the sum of the sink’s own weight and its consumption of flow corresponds to the total weight of the component. This must exceed the threshold. An additional constraint is needed to ensure that adjacent nodes have identical colors if the flow on the connecting arcs is not zero. The MIP for the problem from Section 2.1 is defined as follows: Variables sv ∈ {0, 1} fa ∈ R+ 0 Fa ∈ {0, 1} yvc ∈ {0, 1}
sv = 1 iff node v is a sink. flow on arc a ∈ A = {uv, vu | {u, v} ∈ E}. Fa = 1 if arc a carries positive flow. yvc = 1 iff node v receives color c (i.e., γ 0 (v) = c).
Objective function XX Minimize w(v) · yvc · d(γ(v), c)
(2)
v∈V c∈Γ
Constraints If flow fa > 0, then Fa = 1: M · Fa ≥ fa
∀a ∈ A
(3)
The constant M can be any number greater than the maximal possible weight of a component. To be on the safe side, we define M to be the weight of the whole data set: X M= w(v) (4) v∈V
Each source v (sv = 0) contributes a flow that equals its weight. For each sink v (sv = 1), the incoming flow exceeds the difference of the threshold and the weight of v: X X fa − fa ≥ w(v) − sv · M ∀v ∈ V (5) a=vu∈A
X
a=uv∈A
fa −
a=vu∈A
X
fa ≤ w(v) − sv · θ
∀v ∈ V
(6)
a=uv∈A
Each node has exactly one color: X yvc = 1 ∀v ∈ V
(7)
c∈Γ
If there is flow on an arc, then both incident nodes have the same color: yuc ≥ yvc + (xuv − 1)
∀uv ∈ A, c ∈ Γ
(8)
Constraints (3)–(8) suffice to model our problem. However, the set of feasible solutions for the variables xa and sv can be reduced by adding an additional constraint which expresses that a source has only one outgoing arc with flow and a sink has none. X xa = 1 − sv ∀v ∈ V (9) a=vu∈A
By this, we enforce that the network of arcs with flow is a set of trees, where each tree has exactly one sink. Note that the set of feasible map colorings is not affected and so the optimality is still guaranteed. Yet, we observed a reduction of computation time.
3.2
Different thresholds for different classes
To cope with different thresholds for different classes, the model needs to be extended. The function θ : Γ → R+ is defined to assign a threshold to each color. If we claim that the sink keeps its original color, the threshold for the component can be fixed. For this, we add the following requirements to the problem definition in Section 2.1: • Each component must contain at least one node v with γ(v) = γ 0 (v). From a cartographic point of view, this limitation is reasonable, since classes should not appear out of nothing in the target dataset. Adding the new requirement to our MIP requires two changes. First, we replace Constraint (6) by the following very similar constraint: X X fa − fa ≤ w(v) − sv · θ(γ(v)) ∀v ∈ V (10) a=vu∈A
a=uv∈A
Second, we need an additional constraint to ensure that a sink keeps its original color: yv,γ(v) ≥ sv
∀v ∈ V
(11)
We refer to this MIP, i.e., to the objective function (2) and constraints (3)–(5) and (7)–(11), as the basic MIP. The definition of different thresholds would also be possible without the limitation of one unchanged node per component. Especially for the case, that no unique correspondences between the classes of both datasets exist, this version of the problem becomes relevant. Additional variables svc ∈ {0, 1} would need to be defined for this, with svc = 1 iff sv = 1 and yvcP= 1. The term sv · θ in (6) would need to be replaced by c∈Γ svc · θ(c). However, this formulation will not be discussed in more detail.
3.3
Results
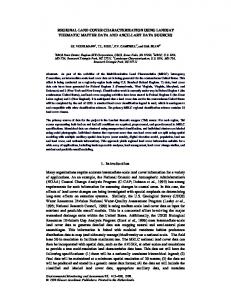
We implemented and tested the basic MIP described in the previous subsection on the ATKIS data set that was introduced in Section 1.2. In particular, we applied it to the 50-area instance depicted in Figure 1. The result is shown in Figure 4. Note that small areas that separate areas of same classes were modified, so that expensive modifications of larger areas could be avoided. This clearly fulfills the expectation and resembles the result that perhaps would have been created by a cartographer. However, a shortcoming of the model is that geometric measures are not taken into account and compact geometries are not preferred compared to others. A possible extension of the model will be discussed in Section 5.1. The time needed for computation and the difficulty of its prediction is a severe disadvantage of the basic MIP. An instance with 30 nodes was solved within 90s, but for the instance with 50 nodes in Figure 4 a gap of 10% between the best found solution and the lower bound for the objective function remained even after 20 hours. For the objective function the value 2.15 was obtained. A solution that is guaranteed to be within 10% of optimal is certainly satisfactory for our application, but the time consumption and its rapid increase are not. Since no approximation algorithm with performance guarantee is known for the map aggregation problem, heuristics need to be defined, which find reasonable good solutions reasonably fast. The performance of the discussed methods is summarized in Table 1.
unchanged color as sink. All other nodes could be defined to be sources. Note that we do not run the risk of constricting the problem so much that it becomes insolvable, since we know that a feasible solution exists. However, the solution that was obtained with the iterative algorithm presented in Section 1.2 does not suffice to do this. Some areas like the grassland feature in the upper left corner of Figure 1 are eliminated by the iterative algorithm and will not be recovered when being fixed as source. A more careful modification can be done by defining that each node v with weight greater than the threshold is a sink. Obviously, one can construct special cases for which the optimal solution violates this constraint. Yet it is questionable whether this restriction is an unwanted deficit or a favorable feature, since it could be intended that an area must not change its color if it fulfills the requirements of the target scale. About 7% of all areas in our data set at scale 1:50.000 fulfill the requirements of the target scale 1:250.000, which is a considerable ratio. However, it turned out that this heuristic does not suffice to obtain a reasonable fast performance. We make a compromise and define the heuristic as follows.
4.
Sink & Source Heuristic:
4.1
HEURISTICS Defining sinks and sources
To reduce the computation time for our method, we need heuristics to eliminate variables. In our basic MIP a sink keeps its color and defines the threshold for its component. Thus, a sink can be regarded as dominant area or center of a region. A possibility to reduce the number of variables is to find dominant features in advance and to make them sinks. The guarantee to obtain the optimal solution is lost with this heuristic approach, but it is very likely that the result is not much worse than the optimum. Similarly, defining very small areas a priori as sources will most likely not affect the result of the MIP. Probably it is possible to constrain all nodes to be sinks or sources if a good start solution exists. For each region of the start solution we could define the largest area with
Figure 4: Result obtained by our MIP.
• For each region obtained with the iterative algorithm, the largest area with unchanged color is a sink and • each other area of size less than 10% of the threshold is a source. The first statement includes all areas with size greater than their thresholds and other dominant areas. In addition to the second statement, we constrain a node as source if a neighbor of the same color is defined to be a sink. This does not affect the set of feasible map colorings. Also, we can eliminate many variables yvc , since we know that the new color of a region must exist in the set of colors of potential sinks. With this heuristic we obtained the same results as before. For the instance with 50 nodes the result with proof of optimality was achieved within 2.7 hours.
4.2
P-R MIP
To improve the performance we define and test an alternative mixed integer program based on precedence relationship, to which we refer as the P-R MIP. For this we only need the variables xiv that were introduced in Section 2.3. Equation (1) ensures the contiguity of the components. Additionally we need to introduce the following constraints. Each node belongs to one center. X xiv = 1 ∀v ∈ V
(12)
i∈V
For each center the threshold is fulfilled. X w(v) · xiv ≥ θ(γ(i)) · xii ∀i ∈ V
Distance Heuristic: (13)
v∈V
The objective can be expressed by XX minimize w(v) · xiv · d(γ(v), γ(i)).
Here, too, we insist that centers (i.e., nodes with xii = 1) keep their color. Although the formulation of the problem becomes very simple with this model, it seems to be a disadvantage that the number of variables is quadratic. We later introduce a heuristic which reduces the number of variables so that it is again of linear order. First, however, we discuss how to define an appropriate precedence relationship. Given a node i, we can calculate for each node v the area aiv of the smallest contiguous region that contains i and v. This is a variation of the well-known single-source shortestpath problem which can be solved with Dijkstra’s famous algorithm [4]. This area measure can be interpreted as distance between i and v which can be used to define the precedence relationship. We define the set Predi (v) to contain all neighbors of v that are closer to i according to this distance: (15)
With this approach we obtain exactly the same solution as in Figure 4 in only 62 seconds with proof of optimality.
4.3
Heuristics for the P-R MIP
To eliminate variables we can use the fact that two nodes are very unlikely to be merged if their distance is large. For this we use the distance that was introduced in the previous section for the definition of the precedence relationship. For each node i, we define the set of nodes whose distance from i is less than the threshold. Si = {v ∈ V | aiv < θ(γ(i))}
• Two nodes belong to different regions, if all regions that contain both nodes can be split into two parts of size greater than their thresholds.
(14)
i∈V v∈V
Predi (v) = {u ∈ V | aiu < aiv ∧ {u, v} ∈ E}
guarantee of no additional cost. In this case we could eliminate the variables xiv and xvi without restricting the feasible map colorings. This would greatly reduce the size of the problem. If we assume that for a given center i the number of nodes v with Si0 ∪ Sv0 6= ∅ is constant, then the number of variables would be linear. We could continue with these considerations to eliminate variables of our MIP for different thresholds and one unchanged node per component. However, we apply the discussed reduction, knowing that it is a heuristic which can theoretically affect our solution. The confinement made by using the precedence relationship is probably much larger than this elimination of variables.
(16)
In other words, if a node u is not contained in Si , then each contiguous region that contains i and u satisfies the threshold of i. We define Si0 to be the set of nodes in Si and their neighbors. If Si = ∅ we define Si0 = {i}. We can make the following observation: If the sets Si0 and Sv0 do not intersect, then each contiguous region that contains the nodes i and v can be separated into two regions with centers i and v, such that both parts satisfy their thresholds. Without the constraint that the new color of a region is defined by the original color of its center and with equal thresholds, we would be able to do this separation with the
Additionally we tested the effect of our sink & source heuristic from Section 4.1. For the P-R MIP this means that the variable xiv can be eliminated if node i is a source or node v is a sink. Also here we applied the result that was obtained with the iterative algorithm. The effect of this intervention is more drastic here, since the precedence relationships are defined for the centers. By fixing nodes as sources, the set of feasible contiguous regions is confined.
4.4
Discussion of performance
Both, the basic MIP from Section 3 and the P-R MIP from Section 4.2 based on precedence relationship, were tested for instances of different sizes and with different combinations of the presented heuristics. For these tests we used the Interactive Optimizer of the software ILOG CPLEX 9.100 on a Linux server with 4 GB RAM and a 2.2 GHz AMD-CPU. Table 1 summarizes our results. All instances were solved with proof of optimality, except the one marked with a star. The first column of Table 1 shows the results that were obtained with the iterative algorithm from Section 1.2. All computations took less than a second on a standard desktop PC. The distance between land cover classes defined in Section 2.1 guided the choice of the neighbor to be merged. Whenever neighbors with equal costs occurred, we chose the neighbor with the largest area. The time needed for the solution of our original MIP is very high and increases rapidly. For cartographic applications this is not appropriate, but the obtained results allow to assess the results from other methods. The computation time can be reduced with the sink & source heuristic from Section 4.1. For our examples no differences to the general solution arise. Also by definition of precedence relationship in Section 4.2 the computation time is reduced while the solution is only marginally affected. The computation time is greatly reduced by the application of the sink & source heuristic to the P-R MIP. Still the effects on the obtained results are acceptable. The distance heuristic is effective only for relatively large instances. This is plausible, since long distances that allow to eliminate variables hardly exist in small data sets. With applicability on data sets of 400 features the presented methods become relevant for cartographic production. An example for an instance with 400 areas is shown in Figure 5 and Figure 6. However, the processing of a whole map sheet is not possible so far. A map sheet of the
nodes 30 40 50 60 100 200 300 400
Iter. alg. obj. 5.51 5.35 6.35 6.88 8.84 13.37 22.56 29.04
basic MIP pure sink & source time obj. time obj. 90.2 1.73 10.3 1.73 12.7h 1.67 620.0 1.67 ∗ 2.7h 2.15 20.0h 2.15
pure time obj. 4.6 1.73 26.6 1.76 62.2 2.15 570 2.60
P-R MIP distance sink & source time obj. time obj. 8.5 1.73 0.01 2.41 32.7 1.76 0.03 1.82 95.2 2.15 0.45 2.34 416.5 2.60 0.79 2.96 21.6 4.20 100.4 6.35 714.7 14.68 1366.9 19.15
s. & s. + dist. time obj. 0.01 2.41 0.03 1.82 0.24 2.34 0.76 2.96 21.5 4.20 202.9 6.35 444.8 14.68 1032.2 19.15
Table 1: Experimental results. Computation times are in seconds CPU time unless marked with h, which stands for hours. All instances were solved to optimality except ∗ . “Obj.” refers to the value of the objective function.
Figure 5: Source data set ATKIS DLM 50 (1:50.000) with 400 areas.
Figure 6: Result obtained for input from Figure 5 by P-R MIP with sink & source and distance heuristic.
German topographic map at scale 1:50.000 covers an area of 22km×22km. The presented examples were taken from a data set of the same size. This contains more than 5000 polygons.
to minimize the total boundary length of the regions. A first attempt with this objective showed that regions not only become more compact but also tend to become larger, which is undesirable. Different compactness measures have been discussed that use Euclidean distances or squared Euclidean distances between nodes and their corresponding centers [2, 8]. We define δ : V 2 → R+ 0 to be the Euclidean distance between the centroids of two areas. For the P-R MIP, we can define a compactness measure C which manages with existing variables: XX C= w(v) · δ(i, v) · xiv (17)
5.
FUTURE WORK
In order to enhance the visual appearance of the output of our method, the boundaries of the regions can be simplified. For this existing methods can be applied [3]. A problem that is more inherent to our method is that the obtained regions are not compact. We discuss some ideas to improve our method in this respect. We also propose an approach for processing large instances.
5.1
Creating more compact shapes
For the cartographic application not only the similarity of classes but also the geometric characteristics of shapes need to be considered. A new objective function is needed to express that regions with compact shapes are preferred. A compactness measures can be added to the existing objective function if a factor for the trade-off between both objectives is defined. A reasonable approach to obtain compact areas is
i∈V v∈V
Generally penalties are given for long distances. Although the variables xiv do not exist in our basic MIP we can define a reasonable compactness measure C 0 with existing variables, namely X C0 = δ(u, v) · fa . (18) a=uv∈A
The idea is that, for a compact region, the flow that is contributed by a source needs a short distance to reach the sink. Therefore, penalties are given for long flow distances.
Figure 7: Measures for compactness: Based on direct distance (left) and based on adjacency graph (right).
Figure 7 illustrates the difference of both measures. While measure C takes distances on direct lines into account (left), measure C 0 utilizes the length of the shortest path included in the region (right). Tests are needed to approve these considerations. A possible shortcoming of both measures is that distances between centroids are applied. If the shapes are complex, these are not necessarily meaningful.
5.2
Processing large instances
The iterative algorithm is fast, but it produces solutions of relatively high cost. However, more sophisticated heuristic algorithms are thinkable. In combination with our presented optimization methods, heuristic methods can be envisioned that consider not only single areas but groups of features. A simple possibility to process a bigger data set is to partition the complete map into disjoint patches and to process these patches independently. A serious problem of this approach is that areas on the edges of patches might be forced to perform relatively expensive color changes, since neighbors of more similar colors belong to other patches. To reduce these fringe effects we propose to divide the whole data set into overlapping patches that are processed successively, e.g., by starting with the patch in the upper left corner and proceeding line by line. Regions at the edge of processed patches define the overlap and should be broken up into their constituting areas when appending a new patch. These areas need to be aggregated anew with the new patch. This time, however, we can avoid the fringe effects by allowing that these areas are assigned to the previously generated adjacent regions. This can easily be done by introducing additional nodes with fixed colors. The proposed procedure has not been implemented and tested so far, but we expect that it is a practicable approach that will satisfy the demands of our application.
6.
CONCLUSION
Our method for the aggregation of areas produces maps that satisfy the criteria of the target scale such that changes of land cover classes are minimal. Our measure of minimality is based on a distance function that expresses semantic similarities between classes. Our tests show that the basic MIP is too slow for data sets of more than 30 areas. However, the obtained solutions are useful for comparison with heuristics. Combining a MIP based on precedence relationship with other heuristics we could solve instances of 400 areas in reasonable time.
Especially the sink & source heuristic that defines certain nodes as region centers led to an impressive acceleration. We conclude that (a) it is possible to solve the map aggregation problem for significant problem sizes near-optimally, and (b) using global optimization for high-quality mapping, where computation time is not the prime concern, yields results that are clearly superior to ad-hoc solutions. On the other hand our tests show that the resulting areas are not compact. Since generalization aims at simplifying geometry, different extensions are proposed that will lead to more compact shapes. Further research is necessary to address this issue.
7.
REFERENCES
[1] P. K. Bergey, C. T. Ragsdale, and M. Hoskote. A simulated annealing genetic algorithm for the electrical power districting problem. Annals of Operations Research, 121:33–55, 2003. [2] J. B. Cloonan. A note on the compactness of sales territories. Management Science, 19(4, Part 1):469–470, December 1972. [3] M. de Berg, M. van Kreveld, and S. Schirra. A new approach to subdivision simplification. In Twelfth International Symposium on Computer-Assisted Cartography, volume 4, pages 79–88, Charlotte, North Carolina, 1995. [4] E. W. Dijkstra. A note on two problems in connexion with graphs. Numerische Mathematik, 1:269–271, 1959. [5] M. R. Garey, D. S. Johnson, and L. Stockmeyer. Some simplified np-complete problems. In Proceedings of the sixth annual ACM symposium on Theory of computing, pages 47–63, 1974. [6] J. H˚ astad. Some optimal inapproximability results. Journal of the ACM, 48(4):798–859, 2001. [7] J.-H. Haunert and M. Sester. Propagating updates between linked data sets of different scale. In Proceedings of XXII International Cartographic Conference, 11–16 July 2005, A Coru˜ na, Spain, 2005. [8] S. W. Hess and S. A. Samuels. Experiences with a sales districting model: Criteria and implementation. Management Science, 18(4, Part II):41–54, December 1971. [9] M. Schr¨ oder. Gebiete optimal aufteilen. PhD thesis, University of Karlsruhe, 2001. [10] M. Sester, K.-H. Anders, and V. Walter. Linking objects of different spatial data sets by integration and aggregation. GeoInformatica, 2(4):335–358, 1998. [11] T. Shirabe. A model of contiguity for spatial unit allocation. Geographical Analysis, 37:2–16, 2005. [12] P. van Oosterom. The GAP-tree, an approach to ‘on-the-fly’ map generalization of an area partitioning. In J.-C. M¨ uller, J.-P. Lagrange, and R. Weibel, editors, GIS and Generalization – Methodology and Practice, number 1 in GISDATA. Taylor & Francis, London, 1995. [13] J. van Smaalen. Automated Aggregation of Geographic Objects. PhD thesis, Wageningen University, 2003. [14] A. A. Zoltners and P. Sinha. Sales territory alignment: A review and model. Management Science, 29(11):1237–1256, November 1983.