HTTP Video Streaming Assessment. Martın Varela. â .... Performance Analysis Tool for Adaptive Bitrate Video Streaming,â in Proceedings of the 2014 ACM ...
Generating Realistic YouTube-like Stall Patterns for HTTP Video Streaming Assessment ∗ VTT
Mart´ın Varela∗ , Hyunwoo Nam† , Henning Schulzrinne† , and Toni M¨aki‡
Technical Research Centre of Finland, † Columbia University, USA, ‡ Aalto University, Finland
Abstract—In this short paper we briefly describe the results of analyzing a large-scale data set of actual YouTube stall patterns collected world-wide as part of Columbia University’s YouSlow project, and how we used it to create a simple model for generating realistic stalling patterns with a given number of stalls, a given average stall duration, and a pattern structure (describing the relative length of the stalling events). These stall patterns can be used to perform subjective assessment of HTTP video under realistic conditions. A tool for generating the patterns and the data accompanying this paper has been released for the research community to use.
I.
I NTRODUCTION
When designing subjective assessment experiments, for any kind of media, it is often — though not necessarily always — useful to have the media samples resemble those that are found “in the wild”. In general, this requires access to live measurements, often in large numbers. In this work we present a simple analysis of one such large-scale data set, namely the one gathered by Columbia University as part of their YouSlow [1], [2] project1 . The YouSlow project produced a Chrome web browser extension able to collect playback information from YouTube videos. The information collected includes the initial buffering time, the requested bit rates throughout the playback, the duration and time of stalling events, and also information of the rough geographic location of the user, and the ISP through which he or she is connected to the Internet. The project has been very successful, and has collected so far over 1.1 million traces across 114 countries, providing a wealth of data to analyze. Our goal with the tool presented in this paper is to provide a means for experimenters to create stalling patterns like those observed by real YouTube users, via a simple stochastic process, and allowing for full reproducibility of the results. We consider three aspects of the stalling patterns:
II.
The results presented herein correspond to a subset of the YouSlow data set, comprising approximately 1.1 million traces. Of those, approximately 680000 traces contained rebuffering events. The traces were provided with 1 second granularity, showing for each second of play time, whether the video was indeed playing, or stalled (stalling events below 1s in duration do not show due to rounding of the stall times). As these traces are collected from actual usage, the duration of the videos is highly variable. We discarded traces under 30s in duration, as well as those where no playout had occurred (i.e., the user abandoned the video before the initial buffering time lapsed), or where no stalls were observed. After this filtering, we were left with 543673 traces. There are several outliers in the data set, corresponding to aberrant behaviour in some sessions. We have chosen not to remove those points, as they do happen in practice (and are not extremely rare, either). We therefore summarize the data about the stalling behaviour as shown in Table I. TABLE I.
the number of stalling events observed,
•
their average duration, and
•
their structure, in terms of relative sizes
At this stage, the tool only allows for the generation of the stalling patterns, and does not consider the potential adaptations that would accompany them in normal playout. The rest of the paper is organized as follows. Section II presents the observations from the YouSlow data set. Section III presents the tool for creating the stalling patterns, and its performance. We conclude the paper and discuss future extensions to this work in Section IV. 1 https://dyswis.cs.columbia.edu/youslow/
S UMMARY OF THE YOU S LOW DATASET STATISTICS
Variable
Min
1st quartile
Median
3rd quartile
Max
Number of stalls Avg. stall duration Stddev of stall durations Avg. inter-stall time
1 1.00s 0.00s 1.89s
1 1.00s 0.00s 51.86
1 2.00s 0.00s 133.0s
2 3.57 0.43s 275.00s
159 261400.00s 239800.00s 228500.00
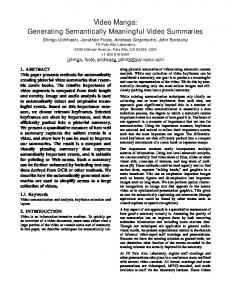
As can be seen, there tends to be little variation in the number of stalls and their duration, whereas they can arrive at quite different intervals (this may also be affected by the different video lengths, of course, so larger variations are to be expected). A high level view of these variables across the data set can be seen in Figure 1. III.
•
YOU S LOW DATA
S TALLING PATTERN G ENERATION
The stalling process can be seen as an on/off process, which can be modeled by a simple 2-state Markov chain, as depicted in Figure 2 The transition probabilities of the model, p and q are related to the frequency of the stalling and their duration. In particular, 1 sr . sd and q = 1/sd, with sr and sd being the rate of p = 1−sr stall time to total playout time, and the average stall duration, respectively. The pattern generator takes a target stalling rate (rate of stall time to video time) and an average stall duration, a video duration, and optionally a stall structure, and generates a suitable set of traces (the number of traces, and a seed for the RNG are also taken as command line arguments).
TABLE II.
S UMMARY OF THE GENERATED PATTERNS STATISTICS
Variable
Min
1st quartile
Median
3rd quartile
Max
Number of stalls Avg. stall duration Stddev of stall durations Avg. inter-stall time
1.000 1.00s 0.00s 4.67s
2.000 1.50s 0.00s 32.31s
2.000 2.20s 0.70s 72.71s
4.000 4.00s 1.70s 158.30s
146.000 127.00s 84.00s 40840.00s
TABLE III.
S UMMARY OF THE YOU S LOW SUBSET STATISTICS
Variable
Min
1st quartile
Median
3rd quartile
Max
Number of stalls Avg. stall duration Stddev of stall durations Avg. inter-stall time
1.000 1.00s 0.00s 1.94s
2.000 1.50s 0.00s 31.00s
2.000 2.33s 0.50s 82.00s
4.000 5.60s 2.91s 211.00s
146.000 201500.00s 201500.00s 61260.00s
and those in the generated traces are in largely overlapping sets, but are not exactly the same. This is due to some of the observed conditions on the YouSlow data set not being feasible for the trace generator. The generator works by creating a large number of traces with the desired target characteristics, and filtering those that fit best according to some criteria. In order to avoid excessive computational cost, the search space is bound, and thus some conditions are not necessarily feasible. The full literate source code for the analysis and pattern generation, along with the data and the pre-built binaries and plots can be found at https://github.com/mvarela/ YT-stall-trace-gen. IV. Fig. 1. YouTube stalling behaviour in terms of average stall duration, their standard deviations, and the average inter-stall times, collected from the YouSlow dataset. Only 5K samples shown due to space concerns, the full data set plots can be found along with the source materials for this paper.
C ONCLUSION
We have presented a short analysis of the stalling behaviour of YouTube streams, based on data gathered by the Columbia University YouSlow project (over 680K traces). Based on that analysis, we have built and validated a stall pattern generator that is able to produce test stalling patterns similar to those observed in the wild, for use in subjective assessment. The tool has been already successfully used in [3]. The next step in this line of work is the generation of adaptation patterns, and combined adaptation and stall patterns close to those observed in actual YouTube usage.
Fig. 2. The 2-state Markov model used. When in state 0 the playback is normal, whereas in state 1 the playback is stalled.
The optional structure argument allows to define the relative duration of the stalls, so for instance “U:U” would be two stalls of equal (“unit”) duration, whereas “U:G:G” would be a shorter stall followed by two longer ones. It should be noted that imposing a stall structure may result in no suitable patterns being generated, as not all combinations of stall rate, duration and structure are feasible. We executed the generator with the characteristics of a subset of the traces shown in Figure 1, and the patterns obtained are characterized in Table II (the corresponding statistics for the subset shown in Figure 1 are shown in Table III). As can be seen from these values, the traces generated behave similarly to those observed in the actual service usage (with the exception of some extreme values). It should be noted the conditions in the studied subset of YouSlow data,
The code for the generator and for generating all the results presented herein is provided in a self-contained Emacs org-mode file, along with a data trace file, which enables reproducing all the results herein with minimal effort. R EFERENCES [1] H. Nam, K.-H. Kim, D. Calin, and H. Schulzrinne, “YouSlow: A Performance Analysis Tool for Adaptive Bitrate Video Streaming,” in Proceedings of the 2014 ACM Conference on SIGCOMM, ser. SIGCOMM ’14. New York, NY, USA: ACM, 2014, pp. 111–112. [Online]. Available: http://doi.acm.org/10.1145/2619239.2631433 [2] H. Nam, K.-H. Kim, and H. Schulzrinne, “QoE Matters More Than QoS: Why People Stop Watching Cat Videos,” in Proceedings of IEEE Infocom 2016, San Francisco, USA, Apr. 2016. [3] T. M¨aki, M. Varela, and D. Ammar, “A Layered Model for Quality Estimation of HTTP Video from QoS Measurements,” in SITIS / QUAMUS 2015, Bangkok, Thailand, Nov. 2015.